Low phylogeographic structure of Rhinella arunco (Anura: Bufonidae), an endemic amphibian from the Chilean Mediterranean hotspot
11
0
0
Texto completo
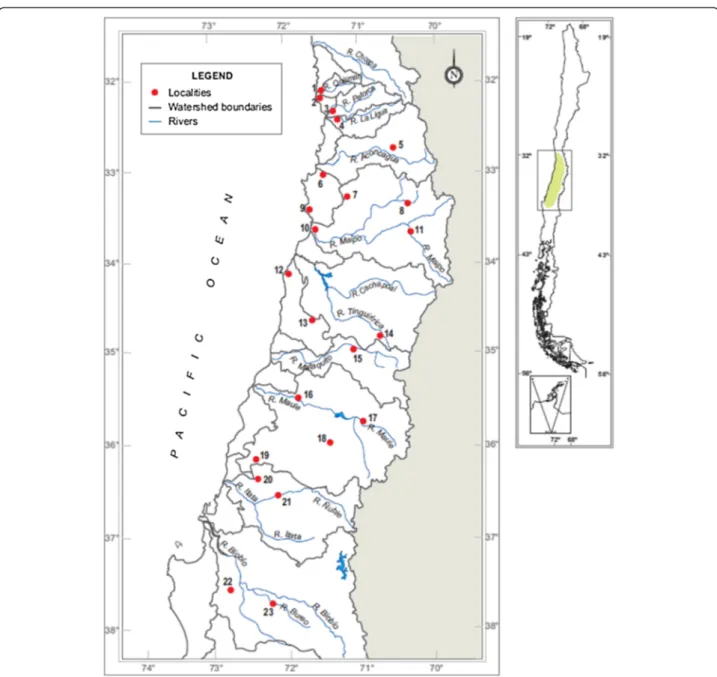
(2) Vásquez et al. Zoological Studies 2013, 52:35 http://www.zoologicalstudies.com/content/52/1/35. the demographics and distributions of the biota, implying a loss of genetic diversity due to important decreases in their population sizes, followed by post-glacial demographic and range expansions (Hewitt 2000; Sérsic et al. 2011). Topographically, Mediterranean Chile has tripartite relief (Niemeyer and Cereceda 1984; Armesto et al. 2007), that is, two parallel mountain chains with a north–south orientation, the Andes Range and the Coastal Range, separated by an intermediate depression or central valley. A number of watersheds which originate in the Andes cross the intermediate depression forming wide valleys, the most important being the Aconcagua, Maipo, Maule, and Biobío Rivers (Amigo and Ramírez 1998, Armesto et al. 2007). The water volume of these rivers was influenced by climatic changes in the Pleistocene. For example, melting produced greater increases in water volume than those currently observed, and these phenomena may have been barriers for the dispersion of some species (e.g., Liolaemus monticola, Lamborot and Eaton 1997). Several studies have evaluated the effects of Pleistocene glaciations and geographic barriers on the genetic structure of vertebrate species in the central zone of Chile. Victoriano et al. (2008) compared patterns of genetic variation of three lizard species of the genus Liolaemus sampled in different latitudinal ranges (Liolaemus tenuis, 31° to 40°S; Liolaemus lemniscatus, 32° to 37°S; and Liolaemus pictus, 37° to 42°S). In L. lemniscatus, which mainly inhabits the Mediterranean zone, they found more genetic variation in populations of the extreme north compared to those of the south of its range. Those authors proposed an effect of glaciations on populations of the south and greater stability in the northern part of the distribution, since the latter area was less impacted by periglacial effects. Unmack et al. (2009) studied populations of the freshwater fish Trichomycterus areolatus, which is distributed in major watersheds from 30° to 45°S, and found no evidence of the effects of Pleistocene glaciations on its genetic diversity. Those authors identified the topography of the central Chile and oceanic barriers as the most important factors which limited the connectivity of populations among river basins. Finally, in a genetic study of populations of the colubrid Philodryas chamissonis from 29° to 38°S, Sallaberry-Pincheira et al. (2011) found a high level of phylogeographic structure, four latitudinally differentiated haplogroups, and high levels of intrapopulational genetic diversity in the Maipo River basin (33°S). Among vertebrates, amphibians have advantages as models for phylogeographic studies, including a global distribution, a high degree of genetic structure, and the ease for obtaining samples (Zeisset and Beebee 2008). Their complex life cycle restricts them to aquatic development or sites with high humidity (Duellman and Trueb 1994), and since they have humid skin, they have a low tolerance to desiccation, which suggests a low dispersion capacity of. Page 2 of 11. individuals (Duellman and Trueb 1994; Beebee 1996). These reproductive and physiological restrictions are usually accompanied by the presence of philopatry (Blaustein et al. 1994; Vences and Wake 2007). As a consequence, these factors produce a high degree of genetic structure, even at short geographic distances, due to direct influences of water availability and temperatures (Buckley and Jetz 2007). At a larger geographic scale, amphibian species usually have strong phylogeographic structures, which mainly appear to reflect historical events which have affected their populations (reviewed in Vences and Wake 2007; some exceptions are Burns et al. (2007), Makowsky et al. (2009), and Chen et al. (2012)). Several recent genetic and phylogeographic studies in different zones of Chile used amphibians as models (e.g., Méndez et al. 2004; Correa et al. 2010) or included species of amphibians which inhabit the Mediterranean zone (Victoriano et al. 1995; Brieva and Formas 2001; Correa et al. 2008a). However, those studies used species whose distributions span beyond the Mediterranean zone, or used few samples within this zone, which were insufficient to evaluate hypotheses of historical genetic differentiation or to compare with co-distributed taxa. Rhinella arunco (Molina, 1782) is one of two species of anurans endemic to Mediterranean Chile; it is distributed from 32° to 38°S (Cei 1962; Correa et al. 2008b), including the coastal zone, the intermediate depression, and the Andean foothills up to 1,450 m (Figure 1). Its populations are closely associated with a landscape dominated mainly by sclerophyllous matorral, where the river basins exhibit large fluctuations in the amount of available water. This study investigated the phylogeographic structure of R. arunco in its entire distribution range, using a fragment of the control region of mitochondrial (mt)DNA as a genetic marker. The objective was to evaluate whether Pleistocene glaciations and/or geographic barriers (watersheds and rivers) were relevant factors which could explain the genetic differentiation of this species in its distribution range.. Methods Localities and study material. We used 160 individuals from 23 localities representative of the entire distribution range of R. arunco, which extends from 32° to 38°S (Cei 1962; Correa et al. 2008b). Samples included the main river basins in the distribution of this species (Figure 1, Table 1). Individuals included adults, juveniles, postmetamorphics, metamorphics, premetamorphics, and larvae, all of which were deposited in the herpetological collection of the Departamento de Biología Celular y Genética, Universidad de Chile (DBGUCH). Permits for the capture and collection of animals were provided by the Servicio Agrícola y Ganadero (SAG; resolutions 3085/2000, 2105/2004, and 13/2006)..
(3) Vásquez et al. Zoological Studies 2013, 52:35 http://www.zoologicalstudies.com/content/52/1/35. Page 3 of 11. Figure 1 Geographic locations of the 23 localities of R. arunco included in this study (see Table 1). Also indicated are the limits of the watersheds and their corresponding main rivers. The approximate distribution of the species is shown on the right (green-colored area).. Obtaining sequences of mtDNA. Genomic DNA was isolated using a salt method (modified from Jowett (1986)) from muscle (tongues of juveniles, metamorphics, and postmetamorphics) or tail (premetamorphics and larvae). From adults we used the liver, thigh muscle, toe, or interdigital membrane. We amplified a fragment of mtDNA which is a partial sequence of the cytochrome (Cyt) b gene (61 bp) plus 855–857 bp from the contiguous extreme of the control region. The primers used were CytbA-L (5′GAATYGGRGGWCAACCAGTAGAAGACCC-3′) and ControlP-H (5′-GTCCATAGATTCASTTCCGTCAG3′), both reported by Goebel et al. (1999). Reagents for. the polymerase chain reaction (PCR) were 3 mM MgCl2, 0.16 mM of each dNTP, 0.2 μM of each primer, 1 U of Taq polymerase (Invitrogen, Carlsbad, CA, USA), and 50 to 100 ng of genomic DNA. The PCR thermal profile was 94°C for 3 min, followed by 42 cycles of 94°C for 30 s, 56°C for 45 s, and 72°C for 90 s, with a final extension at 72°C for 10 min. PCR products were sequenced (both strands) in an automatic ABI3730XL sequencer (Applied Biosystems, Carlsbad, CA, USA). Sequences were edited and reviewed by eye using the BioEdit version 7.1.3 program (Hall 1999). The multiple alignment was performed with the ClustalX version 2.0 program (Larkin et al. 2007), using the default parameter values..
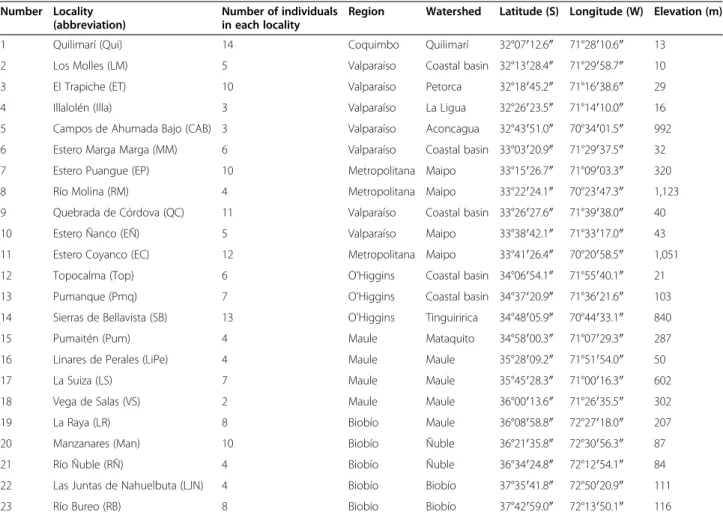
(4) Vásquez et al. Zoological Studies 2013, 52:35 http://www.zoologicalstudies.com/content/52/1/35. Page 4 of 11. Table 1 Coordinates and elevations of the localities of R. arunco included in this study, numbered from north to south (see map in Figure 1) Number Locality (abbreviation). Number of individuals Region in each locality. Watershed. Latitude (S) Longitude (W) Elevation (m). 1. Quilimarí (Qui). 14. Coquimbo. Quilimarí. 32°07′12.6″. 71°28′10.6″. 13. 2. Los Molles (LM). 5. Valparaíso. Coastal basin 32°13′28.4″. 71°29′58.7″. 10. 3. El Trapiche (ET). 10. Valparaíso. Petorca. 32°18′45.2″. 71°16′38.6″. 29. 4. Illalolén (Illa). 3. Valparaíso. La Ligua. 32°26′23.5″. 71°14′10.0″. 16. 5. Campos de Ahumada Bajo (CAB) 3. Valparaíso. Aconcagua. 32°43′51.0″. 70°34′01.5″. 992. 6. Estero Marga Marga (MM). 6. Valparaíso. Coastal basin 33°03′20.9″. 71°29′37.5″. 32. 7. Estero Puangue (EP). 10. Metropolitana Maipo. 33°15′26.7″. 71°09′03.3″. 320. 8. Río Molina (RM). 4. Metropolitana Maipo. 33°22′24.1″. 70°23′47.3″. 1,123. 9. Quebrada de Córdova (QC). 11. Valparaíso. Coastal basin 33°26′27.6″. 71°39′38.0″. 40. 10. Estero Ñanco (EÑ). 5. Valparaíso. Maipo. 33°38′42.1″. 71°33′17.0″. 43. 11. Estero Coyanco (EC). 12. Metropolitana Maipo. 33°41′26.4″. 70°20′58.5″. 1,051. 12. Topocalma (Top). 6. O'Higgins. Coastal basin 34°06′54.1″. 71°55′40.1″. 21. 13. Pumanque (Pmq). 7. O'Higgins. Coastal basin 34°37′20.9″. 71°36′21.6″. 103. 14. Sierras de Bellavista (SB). 13. O'Higgins. Tinguiririca. 34°48′05.9″. 70°44′33.1″. 840. 15. Pumaitén (Pum). 4. Maule. Mataquito. 34°58′00.3″. 71°07′29.3″. 287. 16. Linares de Perales (LiPe). 4. Maule. Maule. 35°28′09.2″. 71°51′54.0″. 50. 17. La Suiza (LS). 7. Maule. Maule. 35°45′28.3″. 71°00′16.3″. 602. 18. Vega de Salas (VS). 2. Maule. Maule. 36°00′13.6″. 71°26′35.5″. 302. 19. La Raya (LR). 8. Biobío. Maule. 36°08′58.8″. 72°27′18.0″. 207. 20. Manzanares (Man). 10. Biobío. Ñuble. 36°21′35.8″. 72°30′56.3″. 87. 21. Río Ñuble (RÑ). 4. Biobío. Ñuble. 36°34′24.8″. 72°12′54.1″. 84. 22. Las Juntas de Nahuelbuta (LJN). 4. Biobío. Biobío. 37°35′41.8″. 72°50′20.9″. 111. 23. Río Bureo (RB). 8. Biobío. Biobío. 37°42′59.0″. 72°13′50.1″. 116. Numbers of individuals in each locality used to obtain mitochondrial sequences are indicated as well as the administrative regions and watersheds.. Phylogeographic and genetic analyses. Haplotypes were extracted using the DnaSP version 5.10.01 program (Librado et al. 2009), including polymorphic sites with indels. For each locality with four or more individuals, we calculated, using Arlequin version 3.5.1.2 (Excoffier and Lischer 2010), the number of haplotypes, haplotype diversity, and mean difference between pairs of sequences (Π). All of these measures were calculated including sites with indels. To visualize the phylogenetic relationships among haplotypes, we constructed a haplotype network (Bandelt et al. 1999) using the Network version 4.6.1.0 program (http:// www.fluxus-engineering.com/sharenet.htm). Then, with the objective of detecting signals of demographic expansion, we calculated Tajima's D (Tajima 1989) and Fu's Fs statistics (Fu 1997) using the DnaSP program, utilizing the haplogroups obtained in the median-joining analysis as units. The phylogeographic structure was evaluated with the following approximations: 1. To establish whether the limits of the watersheds or the main rivers in the distribution of the species have. acted as geographic barriers, we performed an analysis of molecular variance (AMOVA), grouping the 23 localities by watershed and by their locations between the four main rivers (Aconcagua, Maipo, Maule, and Biobío) using the Arlequin program, with 10,000 permutations. By watershed, 11 groups were defined: (a) Quilimarí (Qui) and Los Molles (LM); (b) El Trapiche (ET) and Illalolén (Illa); (c) Campos de Ahumada Bajo (CAB); (d) Marga Marga (MM) and Quebrada de Córdova (QC); (e) Estero Puangue (EP), Río Molina (RM), Estero Ñanco (EÑ), and Estero Coyanco (EC); (f) Topocalma (Top) and Pumanque (Pmq); (g) Sierras de Bellavista (SB); (h) Pumaitén (Pum); (i) Linares de Perales (LiPe), La Suiza (LS), Vega de Salas (VS), and La Raya (LR); (j) Manzanares (Man) and Río Ñuble (RÑ); and (k) Las Juntas de Nahuelbuta (LJN) and Río Bureo (RB). Although the first two groups are localities from different watersheds, we grouped them due to their geographic proximity (<15 km). For the main rivers, five groups were defined: (a) Qui, LM, ET, Illa, and CAB; (b) MM, QC, EP, EÑ, and RM; (c) EC, Top, Pmq, SB, Pum, and LS; (d) LiPe, VS, LR, Man, and RÑ; and (e) LJN and RB..
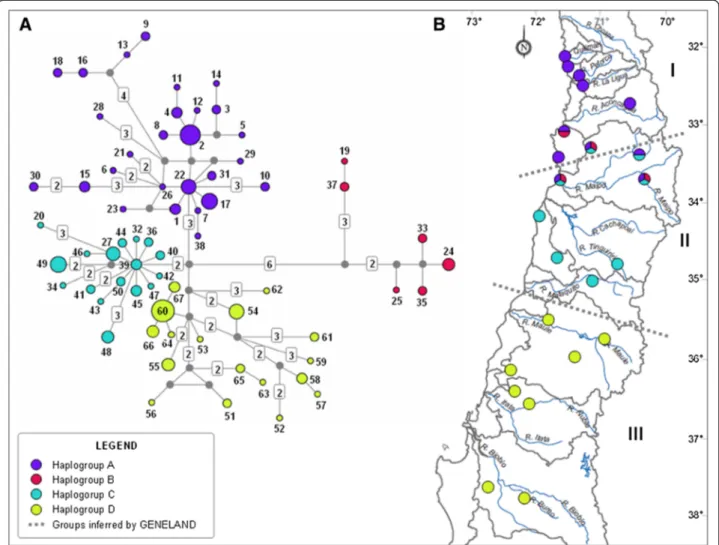
(5) Vásquez et al. Zoological Studies 2013, 52:35 http://www.zoologicalstudies.com/content/52/1/35. 2. We performed a Geneland version 1.0.7 analysis (Guillot et al. 2005a, 2005b) to evaluate the presence of population structure, using a statistical model based on Bayesian inferences implemented in an R platform (Ihaka and Gentleman 1996). This analysis evaluates the presence of population structure in a group of geo-referenced genotypic or haplotypic data by inferring and localizing genetic discontinuities. The most probable number of population units (K) was determined by a Markov chain Monte Carlo method, with five repetitions (5 × 10⁶ iterations in each) of K = 1 to 7. Once the most probable value of K was obtained, we performed an AMOVA with the groups defined by this value, using Arlequin.. Results We obtained an alignment of 919 sites, of which 6 presented indels, and 87 were polymorphic. Sequences were deposited in GenBank (HQ132643-70, KC778264-6, KC778272-5, KC778279-84, KC778291-319, KC778322-33, KC778335-44, KC778348-61, KC778364-5, and KC81714899). Among 160 sequences, there were 67 haplotypes. The geographic location of the haplotypes and measures of intrapopulational diversity are shown in Table 2. The indices of genetic diversity decreased from north to south (Table 2). The three largest values of haplotype diversity were found in localities between 32° and 33°S (ET, 0.956 ± 0.059; EP, 0.933 ± 0.077; and EC, 0.909 ± 0.056), from the watersheds of the Petorca and Maipo Rivers; while the localities with the lowest haplotype diversity (LS, 0.286 ± 0.196; RÑ, 0; and LJN, 0) were found south of 35°S, between the Maule and Biobío Rivers. The median-joining analysis showed four haplogroups (called A, B, C, and D) with north–south segregation, separated by few mutational steps (Figure 2A). Haplogroup A was composed of 27 haplotypes from the extreme north and center of the distribution (32°07′ to 33°41′S), located in the watersheds of the Quilimarí, Petorca, La Ligua, Aconcagua, and Maipo Rivers. Haplogroup B included six haplotypes from the central zone of the distribution (33° 03′ to 33°41′S), mostly in the Maipo River watershed. Haplogroup C contained 17 haplotypes from the central zone (33°15′ to 34°58′S), including localities between the Maipo and Mataquito River watersheds, as well as coastal basins in this range. Finally, haplogroup D was composed of 17 haplotypes from the most austral part of the distribution (35°28′ to 37°42′S), between the watersheds of the Maule and Biobío Rivers (Table 2 and Figure 2B). Three haplogroups (A, B, and C) overlapped geographically. Haplogroup B, which was the most divergent, overlapped with haplogroups A and C at around 33°S, including the Maipo River watershed; only haplogroup D showed an exclusive geographic distribution (south of 35°S). We found evidence of recent demographic expansion for haplogroups A, C, and D using Fu's Fs statistic. Tajima's D showed. Page 5 of 11. negative values, but they were not significant for these haplogroups (Table 3). The AMOVA for localities grouped by watershed showed a variance component among groups (Fct = 0.396) that was greater than the analysis grouping localities between rivers (Fct = 0.327); however, in both cases, the variance within populations was greater (Table 4). The Geneland analysis found three genetic groups in the study area (with a posterior probability of 0.6), one of which (the most austral) exactly coincided with one of the haplogroups recognized in the haplotype network (haplogroup D), while the other two genetic groups corresponded to haplogroups A, B, and C (Figures 2B and 3). The first group was composed of localities located between 32° and 33°30′S, including one locality from the Maipo River basin (Estero Puangue) (Figure 3). The second group was composed of localities from 33°30′ to 35°S, between the watersheds of the Maipo and Mataquito Rivers (Figure 3). Finally, the third group was composed of localities from the Maule River to the south (35° to 38°S, Figure 3). The three population units (I, II, and III) found in this analysis are indicated by dashed lines in Figure 2B. The AMOVA of the three groups found by Geneland showed a variance component among groups (Fct = 0.393), which was also lower than the variance within populations (Table 4).. Discussion Taken together, the different analyses performed using sequences of the control region revealed that R. arunco has a low phylogeographic structure. The haplotype network showed four haplogroups with low genetic divergence among them, three of which overlapped geographically. The AMOVAs showed that the genetic variance was greater within populations than among groups of populations. The Geneland analysis showed three population units, with low support probability. These results suggest that there have not been important geographic barriers that limited the expansion of this species within its distribution. A low level of phylogeographic structure was also reported by Correa (2010) for Rhinella atacamensis (see below), the sister species of R. arunco (Méndez 2000; Pramuk et al. 2007), which is distributed between 25° and 32°S. However, this pattern contrasts with the results of Correa et al. (2010) in Rhinella spinulosa and with a number of phylogeographic studies in bufonids from North America, Europe, and Asia (Rowe et al. 1998; Masta et al. 2003; Smith and Green 2004; Jaeger et al. 2005; Zhang et al. 2008, among others). The AMOVAs indicated that neither watersheds nor main rivers in the current distribution of R. arunco were important barriers for the expansion of this species, which contrasts with a report by Unmack et al. (2009) for the freshwater fish T. areolatus, in the same latitudinal range. Those authors detected a direct effect of topography,.
(6) Vásquez et al. Zoological Studies 2013, 52:35 http://www.zoologicalstudies.com/content/52/1/35. Page 6 of 11. Table 2 Geographic distributions of the 67 haplotypes of the mitochondrial control region of R. arunco and measures of intrapopulational genetic variation Number. Locality (abbreviation). Number of sequences. Number of haplotypes. Haplotype diversity ± SD. Π ± SD. Haplotypes. 1. Quilimarí (Qui). 14. 6. 0.802 ± 0.090. 2.450 ± 1.409. 1-6. 2. Los Molles (LM). 5. 3. 0.800 ± 0.164. 1.800 ± 1.236. 2, 7, 8. 3. El Trapiche (ET). 10. 8. 0.956 ± 0.059. 5.555 ± 2.915. 2, 4, 9-14. 4. a. Illalolén (Illa). 3. 1. 15. 5. Campos de Ahumada Bajoa (CAB). 3. 2. 9, 16. 6. Estero Marga Marga (MM). 6. 3. 0.733 ± 0.155. 9.200 ± 4.937. 17-19. 7. Estero Puangue (EP). 10. 8. 0.933 ± 0.077. 7.356 ± 3.761. 2, 20-26. 8. Río Molina (RM). 4. 2. 0.500 ± 0.265. 5.500 ± 3.343. 27, 28. 9. Quebrada de Córdova (QC). 11. 5. 0.818 ± 0.083. 3.018 ± 1.703. 1, 17, 22, 29, 30. 10. Estero Ñanco (EÑ). 5. 4. 0.900 ± 0.161. 9.200 ± 5.106. 31-34. 11. Estero Coyanco (EC). 12. 7. 0.909 ± 0.056. 8.393 ± 4.181. 24, 27, 33, 35-38. 12. Topocalma (Top). 6. 4. 0.867 ± 0.129. 1.933 ± 1.269. 39-42. 13. Pumanque (Pmq). 7. 4. 0.809 ± 0.130. 2.190 ± 1.372. 43-46. 14. Sierras de Bellavista (SB). 13. 4. 0.654 ± 0.106. 3.307 ± 1.816. 27, 47-49. 15. Pumaitén (Pum). 4. 2. 0.667 ± 0.204. 0.666 ± 0.626. 39, 50. 16. Linares de Perales (LiPe). 4. 3. 0.833 ± 0.222. 5.500 ± 3.343. 51-53. 17. La Suiza (LS). 7. 2. 0.286 ± 0.196. 1.428 ± 0.984. 54, 55. 18. Vega de Salasa (VS). 2. 2. 19. La Raya (LR). 8. 5. 0.857 ± 0.108. 5.750 ± 3.079. 20. Manzanares (Man). 10. 5. 0.844 ± 0.080. 3.555 ± 1.972. 55, 60, 63-65. 21. Río Ñuble (RÑ). 4. 1. 0. 0. 60. 22. Las Juntas de Nahuelbuta (LJN). 4. 1. 0. 0. 66. 23. Río Bureo (RB). 8. 2. 0.536 ± 0.123. 0.535 ± 0.492. 60, 67. 56, 57 58-62. Geographic distributions of the 67 haplotypes of the mitochondrial control region found in R. arunco and measures of intrapopulational genetic variation by locality (number of haplotypes, haplotype diversity, and mean differences between sequence pairs (Π)). Figure 2 shows relationships between haplotypes as inferred by the median-joining method. aLocalities with fewer than four individuals. SD, standard deviation.. specifically of watersheds, in the genetic differentiation of that species, which was expected given that it is a strictly aquatic species. Unexpectedly, the results of our study differ from those of Sallaberry-Pincheira et al. (2011) who found, using sequences of the control region, a high level of phylogeographic structure of the colubrid P. chamissonis in a similar geographic range (29° to 38°S). This is somewhat counterintuitive, considering that P. chamissonis is a diurnal species which does not depend upon bodies of water for its reproduction or high environmental humidity for refuge, and thus could have a much-higher dispersion capacity than a freshwater fish or an amphibian. However, the pattern observed for P. chamissonis may have been due in part to the low number of individuals studied in some localities, which may have decreased the probability of finding common haplotypes among them. The low phylogeographic structure observed in R. arunco is a pattern which has been reported in few amphibian species in the world. Burns et al. (2007) studied 26 localities (n = 263) of Litoria aurea (Anura: Hylidae) located in the. coastal zone of southwestern Australia. Using mitochondrial markers (cytochrome oxidase subunit I and ND4), they found a no marked phylogeographic structure; they attributed this pattern to the greater dispersion capacity of individuals, with movements recorded more than 10 km from the reproductive ponds. Similarly, Makowsky et al. (2009) investigated the phylogeographic patterns of Gastrophryne carolinensis (Anura: Microhylidae) in 29 localities (n = 100) in the southwestern US. Surprisingly, an analysis of two parts of the genome (the mitochondrial 12S gene and amplified fragment length polymorphisms (AFLPs)) showed low genetic and phylogeographic structures, which is incongruent with respect to co-distributed species and studies of amphibians with similar distribution ranges. Those authors suggested that the populations had experienced strong bottlenecks with subsequent range expansions. Finally, Chen et al. (2012) studied six localities (n = 123) of the Siberian salamander Ranodon sibiricus (Caudata: Hynobiidae) from isolated geographic areas of central.
(7) Vásquez et al. Zoological Studies 2013, 52:35 http://www.zoologicalstudies.com/content/52/1/35. Page 7 of 11. Figure 2 Haplotype network of R. arunco sampled at 23 localities and geographic distributions of haplogroups and Geneland genetic groups. (A) Network of the 67 haplotypes (160 individuals) of R. arunco sampled at 23 localities. Each haplotype is represented by a circle, the area of which is proportional to its observed frequency (colors indicated in legend). The number of each haplotype (see Table 2) and the number of mutational steps between haplotypes are indicated. Small gray circles are haplotypes not found but inferred by the Network program. (B) Geographic distributions of haplogroups and the three genetic groups found by the Geneland analysis (I, II, and III, separated by dotted lines).. Asia. Using two genetic markers (D-loop and microsatellites), they reported genetic homogeneity among populations, suggesting that Pleistocene climatic changes may have facilitated gene flow or that the observed pattern may have been due to a low rate of evolution of the markers used. The low phylogeographic structure observed in R. arunco may be related to some biological characteristics of this species. Although R. arunco depends on bodies of water for its reproduction and places with high humidity for refuge during the day (Cei 1962), this anuran has rather terrestrial habitats, a characteristic which has been attributed to the majority of species of the family Bufonidae (Blair 1972; Van Bocxlaer et al. 2010). Bufonids have acquired a series of morphological, ecophysiological, and ethological traits to optimize water retention, which include a high water-storage capacity in the bladder and a. concentration of alveoli in the parotid glands, which produce a highly hydrophilic secretion that allows the retention of a large amount of water during the dry season (Van Bocxlaer et al. 2010). In addition, they are capable of using all kinds of bodies of water for oviposition, with large egg masses in chains and larvae with exotrophic Table 3 Results of Tajima's D and Fu's Fs tests for the four haplogroups of R arunco inferred by the median-joining method Haplogroup. Pi. Theta/site. Tajima's D (p value). Fu's Fs (p value). A. 0.00483. 0.00815. −1.331 (>0.10). −11.433 (0.001). B. 0.00431. 0.00397. 0.356 (>0.10). 0.402 (0.250). C. 0.00329. 0.00568. −1.415 (>0.10). −6.337 (0.001). D. 0.0041. 0.00595. −1.022 (>0.10). −4.736 (0.006). Pi, nucleotide diversity; Theta/site, theta per site..
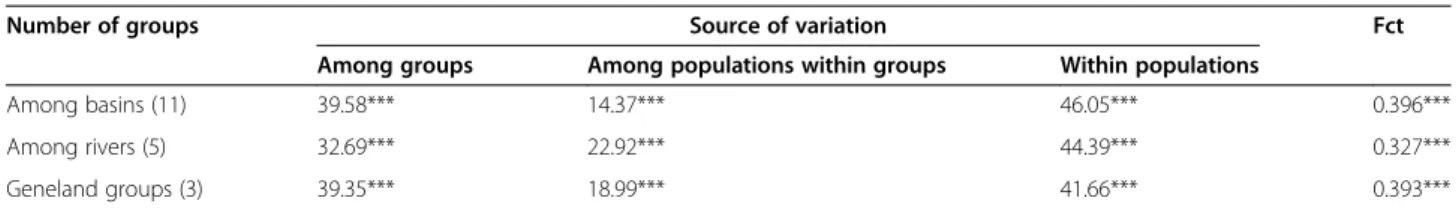
(8) Vásquez et al. Zoological Studies 2013, 52:35 http://www.zoologicalstudies.com/content/52/1/35. Page 8 of 11. Table 4 Percentages of variance for components of analyses of molecular variance performed with 23 localities of R arunco Number of groups. Source of variation. Fct. Among groups. Among populations within groups. Within populations. Among basins (11). 39.58***. 14.37***. 46.05***. 0.396***. Among rivers (5). 32.69***. 22.92***. 44.39***. 0.327***. Geneland groups (3). 39.35***. 18.99***. 41.66***. 0.393***. ***p ≤ 0.001.. feeding. As a consequence, they show some independence from the availability of constant bodies of water and high humidity of the air or substrates. Because of this, they have developed one of the most characteristic traits of the group, the occupation of a semi-terrestrial niche, which has direct relation with their capacity to disperse and colonize an enormous variety of habitats (Blair 1972; Van Bocxlaer et al. 2010). Smith and Green (2005) indicated that the mean movement of 53 species of anurans was 2 km, and that 5% showed movements of >10 km, among which were Anaxyrus fowleri (or Bufo fowleri) and Rhinella marina. Smith and Green (2006) studied the dispersion. capacity of the anuran A. fowleri in Ontario, Canada. They marked 2,816 individuals and found a maximum movement of 34 km for adults. Intrapopulational genetic variation of R. arunco was greater in localities north of 35°S, specifically in the Maipo River basin. Cytogenetic and molecular studies of the lizard L. monticola also showed a high level of genetic variation in this watershed, where the Maipo River would have acted as a geographic barrier, producing divergence between populations located on opposite banks (Lamborot and Eaton 1997; Torres-Pérez et al. 2007). This result also concurs with the results of Sallaberry-Pincheira et al. (2011) in the. Figure 3 Geneland analysis with posterior probability isoclines which indicate extensions of the genetic groups found (I, II, III; see Figure 2B). Black dots indicate locations of the 23 analyzed localities; thick black lines indicate the geographic border of Chile. Thinner black lines are isoclines of inclusion probability. Light color zones in each map indicate the groups of localities with greater probabilities of belonging to the same genetic unit..
(9) Vásquez et al. Zoological Studies 2013, 52:35 http://www.zoologicalstudies.com/content/52/1/35. populations of P. chamissonis of the Maipo River basin. The lowest values of haplotype diversity in R. arunco were found in localities in the extreme south of its range (haplotype D), which suggests an effect of glaciations on the genetic diversity of those populations, as postulated by Victoriano et al. (2008) for L. lemniscatus, whose distribution is also limited to the Mediterranean zone, but is wider than that of R. arunco. Also, the value of Fu's Fs indicated signs of demographic expansion for haplogroup D, which had the lowest values of haplotype diversity. However, this pattern being in part due to a sampling effect cannot be discounted, since in general, sample sizes were lower from localities of the extreme south than in those of the north. The possible effects of Pleistocene glaciations on the genetic variation of R. arunco could be evaluated by increasing the sampling effort in localities in the extreme south of its distribution. Another possible explanation for the pattern observed in this anuran may be the level of variation of the molecular marker utilized. Phylogeographic studies using the mitochondrial control region have been performed in species phylogenetically related to R. arunco and species which inhabit the same geographic zone, and diverse levels of phylogeographic structure were found. For example, Correa et al. (2010) studied populations of the anuran R. spinulosa, which is related to R. arunco (Méndez 2000, Pramuk et al. 2007), in the extreme northern Chile, in a geographic extension similar to that in this study (17° to 23°S). Those authors found a high level of phylogeographic structure, which was evidence of population expansion and secondary contact of lineages that were genetically well differentiated. Correa (2010) also found a low phylogeographic structure and high levels of intrapopulational genetic variation in R. atacamensis, the sister species of R. arunco (Méndez 2000; Pramuk et al. 2007). In that case, variation patterns found with mitochondrial sequences were concordant with variation of nuclear AFLP markers in the entire distribution range (25° to 32°S). As in the report of SallaberryPincheira et al. (2011) (see above discussion), those studies show that the control region is an adequate marker to detect phylogeographic structure in diverse organisms, when it exists. Finally, it has been empirically established that the majority of amphibians have a high degree of genetic and phylogeographic structure, which has been attributed to their low dispersion capacity and high philopatry, as a consequence of their physiology and behavior (Duellman and Trueb 1994). However, a recent review of dispersion and philopatry in amphibians (Smith and Green 2005) showed that in a high proportion (74%) of studies, these characteristics were a priori assumed, without being specifically tested, and they also concluded that amphibian dispersion is not uniformly limited, and that it is necessary to confirm dispersion with appropriate studies in terms of. Page 9 of 11. both methodology and extension of sampling. In the case of R. arunco, the adaptations attributed to bufonids may have played an important role in the capacity for individual dispersion and consequently in the low phylogeographic structure we found. Also, comparing our results to other species of vertebrates which inhabit the Mediterranean zone of Chile, there is incongruence in the phylogeographic patterns found. Thus, it is necessary to investigate some ecological aspects related to the dispersion capacity and philopatry of R. arunco and carry out phylogeographic studies with a larger number of species which inhabit the Mediterranean zone of Chile, in order to identify the common historical and climatic factors which have affected their diversification.. Conclusions The main conclusions of this study are as follows: (1) R. arunco has a low phylogeographic structure according to the variation observed in the mitochondrial control region; (2) the AMOVAs indicated that neither watersheds nor main rivers in the current distribution of R. arunco were important barriers for the expansion of this species; (3) the highest levels of intrapopulation genetic variation were concentrated in the central part of the distribution (33° to 34°S), which may indicate an effect of Pleistocene glaciations on the genetic diversity of the populations in the extreme south of its range; (4) the low phylogeographic structure observed in R. arunco is a rarely patterndocumented in amphibians which contrasts with the phylogeographic patterns found in other co-distributed vertebrate species. Competing interests The authors declare that they have no competing interests. Authors’ contributions DV participated in the field trips for sampling, obtained the sequences, carried out the analyses and wrote the manuscript. CC designed and coordinated the study, directed the field trips for sampling, supervised the analyses and wrote the manuscript. LP participated in the field trips for sampling, made the figures and reviewed the manuscript. REP and MAM made intellectual contributions, reviewed the manuscript and provided technical and financial support. All authors read and approved the final manuscript. Acknowledgements We thank Rodrigo Pavez, Sergio Araya, Gonzalo Collado, Gabriel Lobos, Jaime Zúñiga, Álvaro Zúñiga, Dusan Boric, Michel Sallaberry, and Pilar Calderón for their invaluable help in the field, and César Cuevas for providing some individuals from Manzanares. We also thank Carolina Gallardo and Álvaro Zúñiga for their help with the Geneland analyses. DV and CC thank Carla Olguín for her logistic help. This study was funded by postdoctoral project 3110040 (to CC) and Fondecyt project 1100558 (to EP and MAM). Received: 1 September 2012 Accepted: 14 May 2013 Published: 7 October 2013 References Amigo J, Ramírez C (1998) A bioclimatic classification of Chile: woodland communities in the temperate zone. Plant Ecol 136:9–26.
(10) Vásquez et al. Zoological Studies 2013, 52:35 http://www.zoologicalstudies.com/content/52/1/35. Armesto JJ, Arroyo MTK, Hinojosa LF (2007) The Mediterranean environment of central Chile. In: Veblen TT, Young KR, Orme AR (eds) The physical geography of South America. Oxford University Press, New York, pp 184–199 Bandelt HJ, Forster P, Röhl A (1999) Median-joining networks for inferring intraspecific phylogenies. Mol Biol Evol 16:37–48 Beebee TJC (1996) Ecology and conservation of amphibians. Chapman and Hall, London, p 214 Beheregaray LB (2008) Twenty years of phylogeography: the state of the field and the challenges for the Southern Hemisphere. Mol Ecol 17:3754–3774 Blair WF (1972) Summary. Evolution in the genus Bufo. In: Blair WF (ed) Evolution in the Genus Bufo. University of Texas Press, Austin, pp 329–343 Blaustein AR, Wake DB, Sousa WP (1994) Amphibian declines: judging stability, persistence, and susceptibility of populations to local and global extinctions. Conserv Biol 8(Suppl 1):60–71 Brieva LM, Formas JR (2001) Allozyme variation and geographic differentiation in the Chilean leptodactylid frog Batrachyla taeniata (Girard, 1854). Amphibia-Reptilia 22:413–420 Buckley LB, Jetz W (2007) Environmental and historical constraints on global patterns of amphibian richness. Proc R Soc Biol 274:1167–1173 Bull-Hereñu K, Martínez EA, Squeo F (2005) Structure and genetic diversity in Colliguaja odorifera Mol. (Euphorbiaceae), a shrub subjected to PleistoHolocenic natural perturbations in a Mediterranean South American region. J Biogeogr 32:1129–1138 Burns EL, Eldridge MDB, Crayn DM, Houlden BA (2007) Low phylogeographic structure in a widespread endangered Australian frog Litoria aurea (Anura: Hylidae). Conserv Genet 8:17–32 Cei JM (1962) Batracios de Chile. Ediciones Univ. de Chile, Santiago, Chile Chen SY, Zhang YJ, Wang XL, Sun JY, Xue Y, Zhang P et al (2012) Extremely low genetic diversity indicating the endangered status of Ranodon sibiricus (Amphibia: Caudata) and implications for phylogeography. PLoS ONE 7(Suppl 3):e33378 Clapperton CM (1990) Quaternary glaciations in the southern hemisphere: an overview. Quatern Sci Rev 9:299–304 Clapperton CM (1994) The quaternary glaciation of Chile: a review. Rev Chilena Hist Nat 67:369–383 Correa C (2010) Variación morfológica en adultos de Rhinella atacamensis (Anura, Bufonidae): evaluación de la importancia de factores próximos e históricos como agentes causales. PhD thesis, Univ. de Chile, Santiago, Chile Correa C, Lobos G, Pastenes L, Méndez MA (2008a) Invasive Pleurodema thaul (Anura, Leiuperidae) from Robinson Crusoe Island: molecular identification of its geographic origin and comments on the phylogeographic structure of this species in mainland Chile. Herpetol J 18:77–82 Correa C, Sallaberry M, Jara-Arancio P, Lobos G, Soto ER, Méndez MA (2008b) Amphibia, Anura, Bufonidae, Rhinella atacamensis: altitudinal distribution extension, new records and geographic distribution map. Check List 4:478–484 Correa C, Pastenes L, Veloso A, Sallaberry M, Méndez MA (2010) Phylogeography of Rhinella spinulosa (Anura: Bufonidae) in northern Chile. Amphibia-Reptilia 31:85–96 Cowling RM, Rundel PW, Lamont BB, Arroyo MTK, Arianoutsou M (1996) Plant diversity in Mediterranean-climate regions. Trends Ecol Evol 11:362–366 Duellman WE, Trueb L (1994) Biology of amphibians. John Hopkins University Press, Baltimore, MD Excoffier L, Lischer HEL (2010) Arlequin suite version 3.5: a new series of programs to perform population genetics analyses under Linux and Windows. Mol Ecol Resourc 10:564–567 Fu YX (1997) Statistical tests of neutrality of mutations against population growth, hitchhiking and background selection. Genetics 147:915–925 Goebel AM, Donnelly JM, Atz ME (1999) PCR primers and amplification methods for 12S ribosomal DNA, the control region, cytochrome oxidase I, and cytochrome b in bufonids and others frogs, and an overview of PCR primers which have amplified DNA in amphibians successfully. Mol Phylogen Evol 11:163–199 Guillot G, Estoup A, Mortier F, Cosson JF (2005a) A spatial statistical model for landscape genetics. Genetics 170:1261–1280 Guillot G, Mortier F, Estoup A (2005b) Geneland: a computer package for landscape genetics. Mol Ecol Notes 5:712–715 Hall TA (1999) BioEdit: a user-friendly biological sequence alignment editor and analysis program for Windows 95/98/NT, version 5.0.9, 2001. Nucleic Acids Symp Ser 41:95–99 Hewitt G (2000) The genetic legacy of the Quaternary ice ages. Nature 405:907–913 Ihaka R, Gentleman R (1996) R: a language for data analysis and graphics. J Comput Graphic Stat 5:299–314. Page 10 of 11. Jaeger JR, Riddle RB, Bradford DF (2005) Cryptic Neogene vicariance and Quaternary dispersal of the red-spotted toad (Bufo punctatus): insights on the evolution of North American warm desert biotas. Mol Ecol 14:3033–3048 Jowett T (1986) Preparation of nucleic acids. In: Roberts DB (ed) Drosophila: a practical approach. IRL Press, Oxford, UK, pp 275–286 Lamborot M, Eaton LC (1997) The Maipo River as a geographical barrier to Liolaemus monticola (Tropiduridae) in the mountain ranges of Central Chile. J Zool Systemat Evol Res 35:105–111 Larkin MA, Blackshields G, Brown NP, Chenna R, McGettigan PA, McWilliam H, Valentin F, Wallace IM, Wilm A, Lopez R, Thompson JD, Gibson TJ, Higgins DG (2007) Clustal W and Clustal X version 2.0. Bioinformatics 23:2947–2948 Librado P, Rozas J (2009) DnaSP v5: a software for comprehensive analysis of DNA polymorphism data. Bioinformatics 25:1451–1452 Luebert F, Pliscoff P (2006) Sinopsis bioclimática y vegetacional de Chile. Editorial Universitaria, Santiago, Chile, p 316 Makowsky R, Chesser J, Rissler LJ (2009) A striking lack of genetic diversity across the wide-ranging amphibian Gastrophryne carolinensis (Anura: Microhylidae). Genetica 135:169–183 Masta SE, Laurent NM, Routman EJ (2003) Population genetic structure of the toad Bufo woodhousii: an empirical assessment of the effects of haplotype extinction on nested cladistic analysis. Mol Ecol 12:1541–1554 McCulloch RD, Bentley MJ, Purves RS, Hulton NRJ, Sugden DE, Clapperton CM (2000) Climatic inferences from glacial and palaeoecological evidence at the last glacial termination, southern South America. J Quatern Sci 15(Suppl 4):409–417 Méndez MA (2000) Evolución del Canto de Liberación en las Especies Chilenas del Grupo spinulosus (Amphibia: Bufonidae). PhD thesis, Univ. de Chile, Santiago, Chile Méndez M, Soto E, Correa C, Veloso A, Vergara E, Sallaberry M, Iturra P (2004) Diferenciación morfológica y genética entre poblaciones chilenas de Bufo spinulosus (Anura: Bufonidae). Rev Chilena Hist Nat 77:559–567 Myers N, Mittermeier R, Fonseca G, Kent J (2000) Biodiversity hotspots for conservation priorities. Nature 403:853–858 Niemeyer H, Cereceda P (1984) Hidrografía de Chile. Colección de geografía de Chile. Tomo VIII, Instituto Geográfico Militar, Santiago, Chile Pramuk JB, Robertson T, Sites JW, Noonan BP (2007) Around the world in 10 million years: biogeography of the nearly cosmopolitan true toads (Anura: Bufonidae). Global Ecol Biogeogr 17:72–83 Rowe G, Beebee TJC, Burke T (1998) Phylogeography of the natterjack toad Bufo calamita in Britain: genetic differentiation of native and translocated populations. Mol Ecol 7:751–760 Sallaberry-Pincheira N, Garin CF, González-Acuña D, Sallaberry MA, Vianna JA (2011) Genetic divergence of Chilean long-tailed snake (Philodryas chamissonis) across latitudes: conservation threats for different lineages. Divers Distrib 17:152–162 Sauquet H, Weston PH, Anderson CL, Barker NP, Cantrill DJ, Mast AR, Savolainen V (2009) Contrasted patterns of hyperdiversification in Mediterranean hotspots. Proc Natl Acad Sci U S A 106:221–225 Sérsic AN, Cosacov A, Cocucci AA, Johnson LA, Pozner R, Avila LJ, Sites J Jr, Morando M (2011) Emerging phylogeographical patterns of plants and terrestrial vertebrates from Patagonia. Biol J Linn Soc 103:475–494 Smith MA, Green DM (2004) Phylogeography of Bufo fowleri at its northern range limit. Mol Ecol 13:3723–3733 Smith MA, Green DM (2005) Dispersal and the metapopulation paradigm in amphibian ecology and conservation: are all amphibian populations metapopulations? Ecography 28:110–128 Smith MA, Green DM (2006) Sex, isolation and fidelity: unbiased long-distance dispersal in a terrestrial amphibian. Ecography 29:649–658 Tajima F (1989) Statistical method for testing the neutral mutation hypothesis by DNA polymorphism. Genetics 123:585–595 Torres-Pérez F, Lamborot M, Boric-Bargetto D, Hernández CE, Ortiz JC, Palma RE (2007) Phylogeography of a mountain lizard species: a deep evolutionary divergence into the Liolaemus monticola complex (Sauria: Liolaemidae). J Zool Systemat Evol Res 45:72–81 Unmack PJ, Bennin A, Habit EM, Victoriano PF, Johnson JB (2009) Impact of ocean barriers, topography, and glaciation on phylogeography of the catfish Trichomycterus areolatus (Teleostei: Trichomycteridae) in Chile. Biol J Linn Soc 97:876–892 Van Bocxlaer I, Loader SP, Roelants K, Biju SD, Menegon M, Bossuyt F (2010) Gradual adaptation toward a range-expansion phenotype initiated the global radiation of toads. Science 372:679–682.
(11) Vásquez et al. Zoological Studies 2013, 52:35 http://www.zoologicalstudies.com/content/52/1/35. Page 11 of 11. Vences M, Wake DB (2007) Speciation, species boundaries and phylogeography of amphibians. In: Heatwole H, Tyler MJ (eds) Amphibian biology, vol 7. Surrey Beatty and Sons, Chipping Norton, pp 2613–2671 Victoriano P, Ortiz JC, Troncoso L, Galleguillos R (1995) Allozyme variation in populations of Pleurodema thaul (Lesson, 1826) (Anura: Leptodactylidae). Compar Biochem Physiol 112B(Suppl 3):487–492 Victoriano P, Ortiz JC, Benavides E, Adams BJ, Sites JW (2008) Comparative phylogeography of codistributed species of Chilean Liolaemus (Squamata: Tropiduridae) from the central-southern Andean range. Mol Ecol 17:2397–2416 Zeisset I, Beebee TJC (2008) Amphibian phylogeography: a model for understanding historical aspects of species distributions. Heredity 101:109–119 Zhang YJ, Stöck M, Zhang P, Wang XL, Zhou H, Qu LH (2008) Phylogeography of a widespread terrestrial vertebrate in a barely studied Palearctic region: green toads (Bufo viridis subgroup) indicate glacial refugia in eastern Central Asia. Genetica 134:353–365 doi:10.1186/1810-522X-52-35 Cite this article as: Vásquez et al.: Low phylogeographic structure of Rhinella arunco (Anura: Bufonidae), an endemic amphibian from the Chilean Mediterranean hotspot. Zoological Studies 2013 52:35.. Submit your manuscript to a journal and benefit from: 7 Convenient online submission 7 Rigorous peer review 7 Immediate publication on acceptance 7 Open access: articles freely available online 7 High visibility within the field 7 Retaining the copyright to your article. Submit your next manuscript at 7 springeropen.com.
(12)
Figure
Documento similar
In the preparation of this report, the Venice Commission has relied on the comments of its rapporteurs; its recently adopted Report on Respect for Democracy, Human Rights and the Rule
ABSTRACT Transformation of the Specialized Knowledge of Future Primary Teachers on Fraction Division
From the phenomenology associated with contexts (C.1), for the statement of task T 1.1 , the future teachers use their knowledge of situations of the personal
No obstante, como esta enfermedad afecta a cada persona de manera diferente, no todas las opciones de cuidado y tratamiento pueden ser apropiadas para cada individuo.. La forma
Our results here also indicate that the orders of integration are higher than 1 but smaller than 2 and thus, the standard approach of taking first differences does not lead to
Díaz Soto has raised the point about banning religious garb in the ―public space.‖ He states, ―for example, in most Spanish public Universities, there is a Catholic chapel
teriza por dos factores, que vienen a determinar la especial responsabilidad que incumbe al Tribunal de Justicia en esta materia: de un lado, la inexistencia, en el
In the “big picture” perspective of the recent years that we have described in Brazil, Spain, Portugal and Puerto Rico there are some similarities and important differences,
The objectives of this work were to design a microsatellite panel for biodiversity to study the genetic characterization and to analyze the diversity and intrapopulation structure of
