EEG and facial signal classification on real time using neural networks
111
0
0
Texto completo
(2) Resume The following thesis deals with a method for acquiring and classifying electrical signals originated at facial skin. There is also analyzed the already implemented system by EMOTIV Epoc headset that is used for analyzing Electroencephalographs in order to improve the system. A new method is programmed in order to allow people to write with just looking the wished letter in a modified. qwerty keyboard. Ali the system also enables communication with NI software and hardware, so it is possible to control devices trough the programmed system. The used method for the classiflcation system was Neural Networks and the whole 1>attems are presented at the attachments of this document.. Rafael Mendoza 2012. Page3.
(3) Contents The only way for being great is a dream ... do you have one? ............................................................. 2 Resume ................................................................................................................................................ 3 Figures lndex ....................................................................................................................................... 6 EEG and facial signals classification on Real-Time using Neural Networks......................................... 8 Chapter 1.............................................................................................................................................. 8 1.1. Motivation ........................................................................................................................... 8. 1.2. Background.......................................................................................................................... 8. 1.3. Framework ........................................................................................................................ 10. 1.3.1 Aiding people with disabilities ......................................................................................... 12 1.4. Problem statement ........................................................................................................... 13. 15 Objectives ................................................................................................................................ 13 1.6 Methodology ........................................................................................................................... 14 Chapter 2 ........................................................................................................................................... 15 EEG .................................................................................................................................................... 15. 2.1. Left and right hemispheres ............................................................................................... 16. 2.2 The cerebral cortex ................................................................................................................. 16. 2.3 Synapses .................................................................................................................................. 18 2.4 EPOC EMOTIV System ............................................................................................................. 21 2.5 Rough data from headset........................................................................................................ 22 2.5 EEG processing .................................................................................................................... 30 Evoked thought corresponding to left ....................................................................................... 37 Thought corresponding to Right ................................................................................................ 39 Chapter 3 ............................................................................................................................................ 42 Neural Networks and back-propagation training .............................................................................. 42 3. 1 Back-propagation Training ..................................................................................................... 42 4 Eye tracker ....................................................................................................................................... 49 4.1 Noise flltering ........................................................................................................................... 51 5 Wheelchair controller .................................................................................................................... 55 5.. Controlllng a virtual Scenario .................................................................................................... 61. 6.. Software structure .................................................................................................................... 62 6.1. Wheelchair and virtual scenario controllers ..................................................................... 65. Rafael Mendoza 2012. Page4.
(4) 6.2. Letters dassification .......................................................................................................... 67. EMOTIV Epoc code .................................................................................................................... 69 NI-OAQ code .............................................................................................................................. 71 6 Hardware control ........................................................................................................................... 71 6.1 NI-DAQ................................................................................................................................. 71. 6.2 NI-CompactRIO ........................................................................................................................ 73 7 Future Work ................................................................................................................................... 74. Condusions ....................................................................................................................................... 75 Bibliography •••••..••••...•.•.•• ,; ................................................................................................................ 77 Attachment 1: DAQ connection using C++ ......•.••.............•...•..........•.......................•..•......•....•...... 79 Attachment 2: Code for EPOC connection with C++ ..................................................................... 80 Attach111e11t 4: Lowpass filter........................................................................................................ 83 Attachment 5: Letters •....•......•.....•............•••.....•......•........•...•.••.•...•....••.•••..•.•..••...•.••••..••.••••••.•.... 83 EEG for thoughts ........................................................................................................................... 96 Possible Facial movements for n10re controls ............................................................................ 111. Rafael Mendoza 2012. PageS.
(5) Figures Index. Figure 1. a) Levels at head for EEG acquisition. b) Oipole created by two electrodes. (Suihko, 2004) . ............................................................................................................................................................ 17 Figure 2. Different kind of synaptic activity in the brain (carter, 2009) ••••••••••..••••..•••.•••.••..••.•.••...... 18 Figure 3. Cerebral division according to the induced sensations in the human being by the surrounding events (carter, 2009) ...••••••....•.••••.•.••..•..•.•.•..••....•.••.••.•....•••...........•.•....•....•..........•....... 20 Figure 4. Common fMRt associated with areas activated by touch and vision of touch (carter, 2009) . ................................................................................................................................................ 20 Figure 5. Electrodes placement: channel names based on the lntemational 10-20 locations (EPOC,. 2010). ················································································································································ 22 Figure 6. Raw incoming signaIs from EMOTIV system •..........•...•...•....•.........•...•..•..•••....•..•............•.. 23 Figure 7. Rough ECG for an induced thought (User 1)••.•••.•.•..••••...........•..•..•••••..•••.•••••••...••.••.•.•....... 24 Figure 8. Rough EEG for induced thought (User 2) ...••.••...••.•...••.•.•...•.•...•..•..•..•••..•.•••..•....••..•.••......•. 25 Figure 9. Fourier analysis for User's 1 EEG •••.•••••...•..•...•...•..........•.••......•..•.......•...•••••......••••••••..•....... 26 Figure 10. Fourier Analysis for AF3 electrode taken from User l ..................................................... 27 Figure 11. Fourier Analysis for F7 electrode taken from User l ....................................................... 27 Figure 12. Fourier Analysis for F3 electrode taken from User l ....................................................... 28 Figure 13. Fourier Analysis for FCS electrode taken from User 1..................................................... 28 Figure 14. Fourier Analysis for T7 electrode taken from User 1....................................................... 29 Figure 15. Fourier analysis for User's 1 ECG ...................................................................................... 29 Figure 16. Cognitiv Suite .......•.......•...•.•.•••..................•.........••...........•.......•.•......•..•.......••................... 30 Figure 17. Lowpass filter designed on matlab................................................................................... 31 Figure 18. Passband filter designed on Matlab................................................................................. 32 Figure 19. Structure for data analysis ............................................................................................... 33 Figure 20. Rough incoming signa Is from EEG .................................................................................... 36 Figure 21. Delta Waves, filters for incoming slgnals less than 4 Hz••.•••..••••.••.•••...•..•..••...•..•.••........•• 37 Figure 22. Theta Waves. Signals among 4 and 8 Hz.......................................................................... 37 Figure 23. Alfa Waves. Signals an10ng 8 and 13 Hz........................................................................... 38 Figure 24. Beta Waves. Signals among 13 and 30 Hz....................................................................... 38 Figure 25. Gamma waves. Signals among 30 and 100 Hz.................................................................. 39 Figure 26. Delta Waves. Lowpass filter for signa Is less than 4 Hz...................................................... 39 Figure 27. Theta Waves. Passband filterecl signal in range of 4 to 8 Hz........................................... 40 Figure 28. Alfa Waves. Passband filtered signal in range of 8 to 13 Hz............................................ 40 Figure 29. Beta Waves. Filter for 13 to 30 Hz. .................................................................................... 41 Figure 30. Gamma Waves. Filtered signats for signa Is among 30 to :LOO Hz..................................... 41 Figure 31. Nominal Response for the network................................................................................ 43 Figure 32. Representation for an Approximated Network............................................................... 44 Figure 33. Representation for variations on the Neural Network. ................................................... 45. Rafael Mendoza 2012. Page6.
(6) Figure 34. Neural Network training. Minimum Error. 0.005. Step: 0.0000000000000001. lterations: 500000 •.•...••...•..••...•..••.•.•.•....•..•.••.•.••.•••...••••.•.•..•.....•••.•....••.•....•.•..•••....•.•...•••.........•........ 48 Figure 35. Voltage source and how it gets delayed over the skull .•.......•.•.....•.............•.................... 50 Fisure 36. lncomins data for letter A ................................................................................................ 52 Fisure 37. Non-fittered sisflals for letter A••.••••••.••••••...•.•.•.••••••••••••••..•.•••.••••.••....••.•.........••..•••.....•.•.. 54 Figure 38. Applied filter .•••••.••••.•...••••••.•••.••••••••••••.••••••.••..••••••••.•.•.••.•..•.••••.••...••.••...•••••.•.................... 54 Figure 39. T8 Electrode signal with more resolution ...••••••.•••..•.....•.•..•.......•....•..••...........•.....•..•....... 55 Fisure 40. Dlagram for controlling the system .................................................................................. 56 Figure 41. Gyroscope signa Is•.•....•.•...••..••.••...•.•..•.....•...•••.......•..•...••.•...•..•••..•.•...•.....•..•..••.•.....••••.•...• 57 fisure 42. Tllht point fairly in front of the subject••••••••••••••••••••..•••••..•••••.•••••••••.••••••.•.••••..•••••......••.. 57 Figure 43. Head movement for speed and control direction ............................................................ 58 Figure 44. Possible spin axes. ............................................................................................................. 58 Figure 45. Rough input signa Is from Gyroscope•.••.•....•.••........•.•...............•..•••.....•.................•.....•... 59 Fisure 46. Trajectory for testing the headset response.................................................................... 60 Figure 47. Validation with different users......................................................................................... 61 Figure 48. Virtual Scenario for beins manipulated with head movements..................................... 62 Figure 49. Weight's initialization by using random function ........................••••••••...•..•......•.............. 63 Figure 50. Cycle for Neural Network training.................................................................................... 63 Figure 51. Flow dlagram for Obtaining weights................................................................................. 64 Figure 52. Backpropagation training GUI ........................................................................................... 65 Figure 53. Flow diagram for Gyroscope signals classification ............................................................ 66 Figure 54. Flow diagram for letters classification .............................................................................. 68 Figure 55. Modified qwerty keyboard. Qwerty order was preserved due it is commonly used...... 69 figure 56. EMOTIV Epoc code for data handling. .............................................................................. 70 Figure 57. DAQ program for being accessed with C++....................................................................... 71 Figure 58. Code for writing on FPGA code. Part 1.............................................................................. 73 Figure 59. Code for writing on CompactRIO. Part 2.......................................................................... 74. Rafael Mendoza 2012. Page7.
(7) EEG and facial signals classification on Real-Time using Neural Networks. Chapterl 1.1. Motivation. Since human interfaces began to be exploited in order to manipulate objects, it has been a challenge to control objects with the mind, further from only objects, the mind of other people. Nowadays, it is possible to identify the incoming electrical signals from brain. Although they are very noisy, a set of pattems can be identified by building them using different brain areas. By using electrodes, many headsets have been manufactured in order to offer mental control for devices like video games and hardware controls. However, it is stlll a challenge to have a quick system capable of being adapted to the majority of the users by training it only few minutes and having the less confusion from the signals. These systems can be applied to a countless amount of devices and software. In order to make an inquiry about how different methods for pattern recognition can be applied, this research will deal with pattems recognition assodated with stimulus induced over a human being classifying them on real time.. 1.2. Background. Although there have been studies reprding the EPOC EMOTIV system, these studies are focused on describing the basic functions of the EMOTIV EPOC. These fünctions are related since the filtering process until classification process. There is not any proposal about a new system or configuration on the system that could be able to improve any layer of the system (Hoffmann, 2010). Another worlc presented on the last year introduces variou:. applications for testing and performing demo applications. There is used a Support Vector Machine which is used for classification of the EEG patterns. There are also tests regarding the performance of the algorithm classification (Varol, 2010).. Rafael Mendoza 2012. Page8.
(8) Clearly the most advanced and best classificatory system is the eme implemented on the Toyota Mind Controlled Wheelchair. Announced on 2009, the Toyota wheelchair enhances the system fuses RIKEN's blind signal separation and space-time-frequency Filtering1 technology to allow rapid brain-wave analysis and display the results on a panel so quickly that drivers do not sense any delay. The new system has succeeded in having drivers correctly glve commands to their wheelchairs with an accuracy rate of 95%, one of the highest in thE! world (Abolfathi, 2009). Researches regarding gyroscopes include a hu1e amount of controllers for 3d games and entertainment devices (Dan lonescu, Sept.2011). A mixture of Real Time image processing was developed in order to manipulate video games but also gestures and facial may extend gamer's degrees of freedom, but for these systems, the core is based on hand gestures so they are not available for peopte with tetraplegia. The system allows reaching eKtended precision (Algrain, Nov.. 1991), so accurate movements might be developed by the user for controlli'II any device in a 30 world. Recently, more researches have been developed regarding A1>ples's devices that include a gyroscope for controlling video games. lt was also designed for aiding face recognizer algorithms (Scheuermann, 2011) in order to adjust angle deviations caused due user's hand-orientation in portable devices like iPod and iPhone. The gyroscopes and accelerometers may also being used as (Schindhelm, 2011) inertial systems for indoor positioning: knowin1 an initial position, ali subsequent positions can be calculated using various sensor data, which do not require any infrastructure and er11sure the user's prlvacy. By other hand, Brain Machine Interface researches have had many approaches in order to look for mental diseases and controllers for manipulating other devices like Lego Mindstorm robots. (Liarokapis, 2011). Mental diseases researches in many cases just get focused on reporting EEG for patients that present any brain's malfunction; indeed, there are researches that report the possible zones where there mlght be damage by applying supervised conditions. In order to record. 1. As a matter of fact there were used patented fl1tert111 rnethods by Toyota. 8/lnd slgnal separatlon (BSS} Is a technalogy that separates tite nolse campanents and U2ful slgnal companents from braln signals that con be used to control the wheelchalr. lt utllizes only an-llne-tw:onled EEG slgnals. ~ ftltering is a technolagy whlch mracts space and time pattems and frequency osdllatlon data from EEG electrodes to dlscriminate signljlcant /eatures and components whlch are able to rellably control the wheelchalr.. Rafael Mendoza 2012. Page9.
(9) EEG for limbs, subjects were instructed to walk on the treadmill at their comfortable speed while receiving real time visual feedback of their lower limbs (Alessandro Presacco, 2011) Dynamic data-driven brain-machine interfaces or DDDBMI, are systems that have great potential to advance the understanding of neural systems and improve the design of brain-inspired rehabilitative (Ming Zhao, 2008). DDDBMI were developed in order to face two critica! challenges: 1. The concurrent execution of many BMI models requires a tremendous amount of computing power and storage capacity. 2. Resources for effective brain-inspired motor control demand stringent timing requirement because of the need for low latency between brain signaling and sensory feedback. However, these systems need huge workstations that demand real time processing and infrastructure compared to research labs requiring space and huge investment. EMOTIV EPOC device allows acquiring fast EEG and is an inexpensive interface that is used for quick-training applications. Previous researches indicate that EPOC headset saaifice accuracy for price (G. Michael Poor, 2011). These reports also indicate that EMOTIV EPOC training is difficult for being trained.. As a matter of fact, projects that focus on people with any disability are really scarce. A large amount of researches get focused on special cases that explain mechanism developed for that specific case. lndeed, devices just like EMOTIV EPOC, have more applications for video games and controls for interaction between users and consoles than for aiding people.. 1.3. Framework. In the 20's, the psychiatrist Hans Berger published the first of twenty articles related to electrical activity in the brain and how it is possible to acquire an Electroencephalography. Since that time, this electrical. acquisition technique. has been. used. foir medica!. applications. (About. Encephalograms on Human Beings, 1999). An electroencephalography is defined as graphical representation of electrical activity in the brain between two different locations plotted on defined time. Comnion EEG (Electroencephalography) Rafael Mendoza 2012. Page 10.
(10) yields images that must be interpreted by medica! staff or by image analysis accomplished by computers. In order to reach a better medica! diagnosis, it is also necessary to implement an invasive method that requires inserting devices directly connectedl to brain tissue. Based on both analyses as the most reliable procedure, it is not always possible to implement invasive processes due they are really expensive and dangerous. Although EEG was focused on finding posslble brain damage, nowadays it is also used for real-time thought's classification. In order to reach this goal, portable hardware has been developed; the number of electrodes was reduced based on the main brain activity regions obtaining a reduced amount of incoming signals in the range of micro-Volts. These signals may be processed in real time and classified by using algorithms capable of differentiating the electrical signals ending the process with Boolean values representing an individual pattern of thoughts. On these devices, severa! training methodologies are applied for adjusting the classification algorithms. However, they are really inefficient and the training period is really long emptying on non-reliable systems for accurate applications. By means of incoming signal, noise is introduced preventing accuracy. Among the causes of noise, is the fact that EEG signals have a big resolution on time (great changes on short periods of time) preventing an appropriate signal processing. Another consideration implied on an EEG is the fact that the signals are not sensed by working with single neurons, which means that an average per brain area must be calculated. Although previous implications, EEG is the most efficient Brain-COmputer Interface (BCI) for sensing brain electrical activity. On recent research, IT companies have developed BCls including software and hardware drivers. Modutar EEG, EmotivEpoc and TeunisCIEEG are the most common devices for EEG acquisition on real time. In order to implement Real-Time classification algorithms, on this thesis will be implemented Artificial lntelligence classification algorithms; by using rough incoming signals from the EMOTIV EPOC system, the purposed system will be able to classify different kinds of thoughts and execute a pre-programmed action. EMOTIV EPOC's projects include a wide range of applications, since autonomous cars to braincontrollers cell phones. Autonomos Labs at Germany modified a gasolim,-driven car in order to be controlled with EMOTIV's gyroscope. The Car works with digital data, depending on the side where user spins the head the steering wheel will be rotated a fixed angle. Just in case of stopping or advandng the will be manipulated by moving the head up or down. There were used Artificial. Rafael Mendoza 2012. Page 11.
(11) lntelligence algorlthms in order to reach differentiation between inputs (Rojas, 2011). New researches use neural signals to control mobile phones (Choudhury, 2010), a brain-controlled address-book dialing app, which works on similar principies to a P300-speller: the phone flashes a sequence of photos of contacts from the address book and a P300 brain potential is elicited when the flashed photo matches the person whom the user wishes to dial. The goal is to best understand how firing neurons can drive mobile applications and what the current limitations in already mobile phones applications.. 1.3.1 Aiding people witb disabilities. Living with a disability sets in patient's common activities an inordinate cognitive and social challenge. The patient gets his life reduced in professional and social opportunities; therefore the performance of common activities is a big challenge. In developed countries, the quest for a job is a challenge that may result in constant failures. Michelle Howard, a patient with tetraplegia, was kicked off by a solicitor when he asked her: 'Can you tell me, Miss Howard, how you wou/d explain. to a client about your disability?' She replied: 'You were sitting behind a desk when I come in. Would I be doing any different?' (MacDonald, 1994) In underdeveloped countries just to think about jobs for subjects with tetraplegia is right now a dream. Even at home the subject with any. disability gets physically but also socially limited. In severa! cases for subjects with Tetraplegia, they dicl not bom this way, else they got this condition at mature ages so it is possible for the patient to work on intellectual activities. Small Office Home Office (SOHO) is a proposed solution for working at home. An amount of devices is adapted based on diagnosis realized by a therapist in order to control a hall mouse, a touch mouse anda trackball. The personalizatlon is based on h1Jw patient's skills are better with his hand, finger or a suggested extremity by the physiologist. However, on researches it has been concluded that digital controls work better for people with Tetraplegia than analog do (Yoshio Tanimoto, 2003). Techniques that involve invasive methods are now considered as an option (Sung-Phil Kim, 2011). In Sung-Phil research, a Point-and-Click Cursor is tested: a computer interface extracts discrete (click) and continuous (cursor velocity) signals from a target amount of neurons In human motor Rafael Mendoza 2012. Page 12.
(12) cortex. A multi-state probabilistic decoding algorithm that simult;aneously decodes neural spiking activity; the algorithm combines a linear classifier, which determiries whether the user is intending to click orto move the cursor. The results reflected that. "single implanted microelectrode array. might be useful for neural cursor control applications", however due the danger that implies an invasive method, it is not a reliable method for being implemented. In cases where the patient is not capable to afford the necessary adjustments this is notan option.. 1.4. Problem statement. Although the proposal of this research is that the developed system would be used for as many people as possible, the system is designed for people who have non-pathological damage developed at brain cortex. Due the brain is the most complex organ on the body and besjcjles the usage of low-pass filters, there are many posslble sources of noise, these sources of noist! may be electrode's placement, electrode's humectation and externa! noise from brain-mac:hine interface. Therefore the programmed algorithms must be robust. By working with the incoming signals from the EPOC Emotiv system and considering ali the rough dlfferent signals detected by the electrodes, it can be applied Neural Networks algorithms; this is dueto its high training speed and noise tolerance in comparison with the already implemented systems like wavelet maps, sin~sine diagram and support vector machine classification algorithms.. Considering previous works (Abolfathi, 2009), then! will be designed low-pass filter. according to the natural frequencies of the brain, which will reduc:e noise disturbance and time for training the system.. 1.5 Objectives Even though there are plenty researches regarding electrical activity in the brain, few investigations have been done regarding signals classification. In the researches and for public works, it is possible to identify linear methods for classifying mental out coming signals. However. Rafael Mendoza 2012. Page 13.
(13) it is the objective of this thesis applying non-linear techniques which may help to identify electrical patterns. Pattem rec:ognition at this research hardly depends on signal filtering and noise reduction, underway to reach a fast dassification, it is the objective in this research to implement, according to the brain area, an efficient filter. By using efficient filters, it will be possible to reach the main objective: integrate a fast-trainable system able to compute different patterns reaching the most efficiency as possible. The hypothesis that supports this thesis can be inferred since for some brain illnesses there exists sorne pattems and for people with no-disease these patterns might be detected with the EPOC EMOTIV headset by following the already classified areas for previous researches.. 1.6 Methodology Pattem recognition involved on signals generated by human beings, used in the encephalograms, deals with nerve conduction studies and most often used to detect epileptlc activity, but it is also a sensitive detector of encephalopathy and other types of brain dysfunction (Lee & Khoshbin, 2008). In many drcumstances there are used Evoked Potentials, that are thoughts influenced over the human belng in order to look for pattems. Specific procedure must be followed to reach better EEG slgnals. Common schedules include to avoid consuming any food or drinks containing caffelne for 8 to12 hours before the test and avold fasting the night before or day of the procedure, since low blood sugar may influence the results.. Worklng with braln incoming signals, it will be designed a graphics user interface that will allow plotting real time incoming signals as well as the classification results. This interface will be developed on C++ and LabVIEW. On a first stage, Neural Networks algorithms will be programmed in order to dassify the signals. Considering that not all the electroc:k."S are useful, heuristically it will be determined which slgnals may be avoided in order to improve signal analysis and classification.. Rafael Mendoza 2012. Page 14.
(14) Chapter2 EEG For the followlng thesis, there will be applied an Evoked potential which is a neurophysiological exploration that evaluates the function of the acoustic sensorial system, visual, somatosensory2 and its communication ways due induced answers caused for a l<nown and normalized stimulus. The Evoked potential was thought for setting a pattern that could be helpful for a further classification method which will help us to train with different patients the system. The Evoked potential indicates the modification of the electric potential induced by the nervous system in response to an externa! stimulus, especially sensorial (a sound, an image, etc...) but there may also be an interna! event such as a c<>snitive activity (attention, memory, etc.) and it might be recorded by using the Electroencephalography. Electroencephalography is the neurophysiologic measurement of the electrical activity of the brain by recording from electrodes placed on the scalp or, in special cases, on the cortex. The resulting traces are known as an electroencephalogram (EEG) and represent so-called brainwaves. lt is important to notlce that difference of potential is measured with respect to a reference electrode, although this reference electrode is commonly omitted. The EEG is tightly linked to cerebral metabolism. The action potential from a lonely neuron cannot be detected by measuring extracellular activity, due its amplitude is too small for being detected using only one EEG. lt has the capacity for being alive at least 0.3rns, on this period, it accumulates enough power synchronously with surroundlng cells in a range of 200 Hz. The release of neurotransmitters will. be triggered until potential difference reaches the axon limit (axon. terminal). There are two kinds of neurotransmitters: one causes an inflow of positive ions through the change of permeability on the post-synaptic neuron membrane. By this way the potential gap will be created; this case refers to the post-synaptic excitation potential (whenever it is positive). Post-synaptic potentials vary its amplitude from SO to 100 mV (on measurements realized on the scalp} and are the main source in an EEG.. 2. 1t is a sensory system composed of the receptors and processing centers to produce the sensory modalities. They include touch, temperature, proprioception (body positlon) and pain.. Rafael Mendoza 2012. Page 15.
(15) 2.1 Left and right hemispheres Since this research looks for repeatable-pattems generated by ,as much subjects as possible, it could be the first step to classify EEGs depending on the hemispheres at the brain. Structurally, the left and right cerebral hemispheres look broadly similar. Functionally, however, speech and language, stepwise reasoning and analysis, and certain communicating actions are. based mainly on the left side in most people.3 Although it is known that humans EEGs show these results, they may be affected by many circumstances: ingested fuod, prominent veins and stress disorders in the subject. Although hemispheres classification based on EEGs might be used as reference, brain signals pattems just work for identifying whether the EEG comes from a woman or from a man. Researches purpose the usage of wavelet transform analysis and artificial neural networks for classifying (Sternickel, 2002). However, until now there is nota 1Pattern ora convincing analyses that is able to set relíable results for being repeated wíth more than one subject, furthermore, conclusions just like detection o/ late potentials has not achieved convincing results because only. one wavelet has been used and the frequency bandwidth has not been optimally adjusted (Sternickel, 2002) can be read in conclusions at research articles.. 2.2 The cerebral cortex Due this research works wíth a non-invasive method it is necessary to explain how skull's width affects sensing any incoming signa! from brain's activity. Since signals are obtained from head, hair and sweat are common layers that interfere for obtaining strong and clean signals. The resistivity values of the different tissues of the head affect the lead field o-f electroencephalography. When the skull, including tissues that surround ít, are modeled like a concentric sphere, the different resistivity values have no effect on the lead fields of the magnetoencephalography . In order to investigate EEG detectors' ability to concentrate measurement sensitivity there must be introduced the term half sensitivity volume. This term is deflned based on electrode's detecting area; its sensitivity is highest just under it. Since for this thesis, the brain is a homogenously 3. carter Rita, The human brain. Rafael Mendoza 2012. Page 16.
(16) distributed source, throughout the brain the neural sources have the same probability to activate in an instant of time and in direction; if this assumption is true then most of the signal comes from the region where the sensitivity is the highest: just under the electrode. lt is possible to establish that sensitivity decreases as a function of the distance from the electrode but also the region where it comes is smaller so: The HSV is the volume o/ the source region in which the mognitude o/. the detector' sensitivity is more than o ho/f. Malmivuo, May,. o/. its moximum value in the source region (J.. 1997). Figure 1 shows two circles that surrounds a point X, this point. represents the main contact between the soft part at the EMOTIV EPOC headset that absorbs the electrolytic substance and the first metallic layer that connects with the wire that carries the incoming signal. For a practica! generalization, it is assumed that skull's width is distributed in measurements as shown in Figure 1.. scalp skull brain b). a). Figure 1. a) Levels at head for EEG acquisition. b) Dlpole aeated by two electrodes. (Suihko, 2004).. Great part of the required signal for being sensed by the electrodes comes from brain cortex and for its examination it is classified depending on the resolution at brain's cortex.. Type. Characteristic. Gross anatomy. Sulci and gyri.. Microscopic anatomy. The shapes and types of cells and their connections.. Neurological Function. When small areas are simulated to study the sensations or movements this produces.. Emotiv EPOC headset acquires the incoming signals by working at level of Neurologico/ Function but not just cerebrum signals, also voltages generated due muscles stretching and contracting.. Now, since HSV is a volume, it can be inferred where it is possible to obtain de cubic units. By. Rafael Mendoza 2012. Page 17.
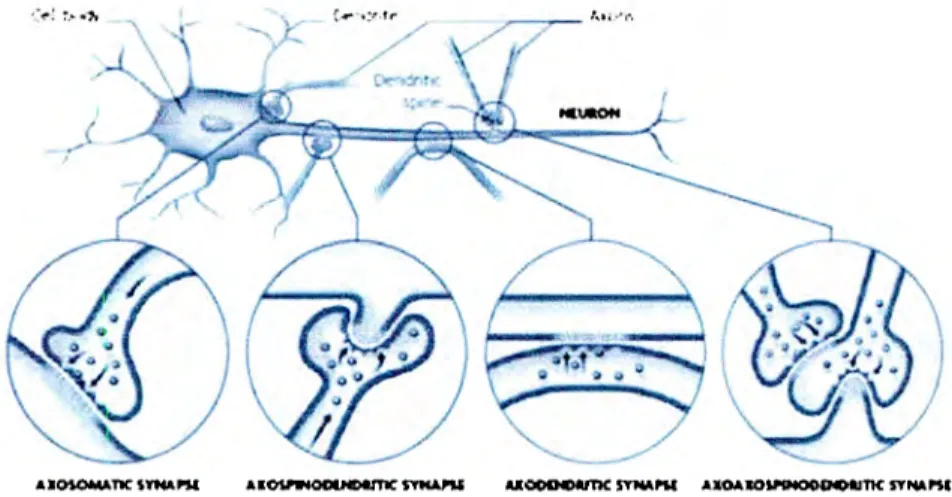
(17) considering the area of the electrode and the depth at skull's user it can be determined. However for this research this factor could not be calculated due there was not used an invasive method.. 2.3 Synapses Synapses are communication sites where neurons pass nerve impulses among themselves. The cells not usually in actual physical contact, but are separated by an incredibly thin gap, called the synaptic cleft. Microanatomically, synapses are divided into types according to the sites where the neurons almost touch. These sites include the soma, the dendrites, the axons and tiny narrow projections called dendritic spines found on certain kinds of dendritic spines found more than 50 percent of ali synapses in the brain; axodendritic synapses constitute about 30 percent. In bigger schematics (Figure 2) it is possible to appreciate. Figure 2. Different ldnd of synaptic activity in the brain (tarter, 2009).. Axosomatic synapse: one between the axon of one neuron and the body of another. Axospinodendritic synapse: an axon to the spine (a bulge) on a dendrite. Axodendritic synapse: axons which connect axon to dendrite. Axoaxospinodendritic synapse: when the synapses is among two axons and a small membranous protrusion from a neuron's dendrite.. Rafael Mendoza 2012. Page 18.
(18) The incoming brain signals have this source as the main responsible for electrical activity in the brain. However, the signals have not simple common pattems which may be classifled. In order to set an outline, the electrical shapes created in the brain were clas;sified according to lts frequency. domains:. Delta waves (6): from ½ to 4 Hz. Deep unconscious, intultion and lnslght. Havlng, the feature of deep sleep stage, this frequency band the 8 activity is associated wlth sorne certain specific morphologies, location and rhythmiclty has relation to different pathologies.. Theta waves (8): 4-8 Hz. Subconscious creativity, deep relaxation. They are enhanced during sleep and play an lmportant role In the braln electrical actlvity of infants and children. For the awake adults, hlgh 8 activlty is considered abnormal and lt is related with different brain disorders.. Alpha waves (a): 8-13 Hz. Mind is wandering and the subject is in a dreamy state, receptive and passive. They appear spontaneously in normal adults during wakefulness under relaxation and mental inactivlty conditions. They are best seen with eyes closed l!tnd most pronounced in occipital locations.. Beta waves (11): 13-30 Hz. Conscious thought externa! focus. They are best observed in central and frontal locations and have less amplitude than a waves. The" are enhanced upon expectancy states or tension. Usually they are subdivlded into lh and. P2. Gamma waves (Y): 30-100 Hz. Not quite defined, but linked to perception and alertness or anxiety. These waves are related to different response of the human being for example, EEG alpha activity reflects attention demands, and beta activity reflects emotion.tl and cognitlve processes.. On. different researches it has been possible to set brain areas that dt!termine specific reactions of the human being for specific stimulus as can be appreciated on Figure 3.. Rafael Mendoza 2012. Page 19.
(19)
(20) •. The ideal conditions for detecting an electrical signal:. •. Many neurons must be triggered at the same time.. •. These neurons must be aligned parallel so their action pottmtial must be added and not cancelled.. 2.4 EPOC EMOTIV System The EPOC EMOTIV system detects and classifies incoming signals by using encrypted algorithms. Since electrical detection, signals are codified and processed in real time. Although, process time is really efficient, signals classification isn't. The references for acquiring the signals are appreciated at Figure 5 and the placement was established by international :;tandards. In order to reach a better signal from each electrode, they must be wet with an electrolytic substance that improves electron's flow. EPOC SDK includes:. l. 14 Channels with a.. Common Mode Sense (active electrode) reference.. b.. Driven Right Leg (passive electrode) reference.. c.. P3/P4 Locations. 2. Neuro-signal acquisition.. 3. Processing wireless neuro-headset. 4.. Real-time display ofthe Emotiv headset data stream, including EEG, contact quality, FFT, gyro, wireless packet acquisition/loss display, marker events, headset battery level.. S. Among others (EPOC, 2010).. Rafael Mendoza 2012. Page 21.
(21) Figure s. Electrodes placement: channel names based on the lntematlonal 10-20 locations (EPOC, 2010).. Figure 6 shows a continuous fast EEG, according to the programed software, it displays 128 samples per second. The resolution is in micro Volts, in order to configure a pattern recognition algorithm, there will be extracted about 100 samples per signal to execute Real Time processing. As it can be appreciated the pattern recognition algorithm will have 14 entrances corresponding to each one of the electrodes. At this precise EEG, it can be appreciated how all the signals try to converge to zero, which indicates a state of no incoming signals receiving.. User's interface allows to the system to classify between different head signals:. l. Expressive Suite: facial movements or muscular stretching and contacting actions.. 2. Affective Suite: it detects user's emotions. 3. Cognitive Suite: it detects influenced thoughts regarding pushing, pulling, moving up and moving down a virtual cube.. 2.5 Rough data from headset EMOTIV Epoc offers different headsets that can be upgraded depending on final user's needs. For this research a Developer's edition was used. The main advantage for this edition is the access that can be reached to rough incoming signals from fourteen electrodes. Since fourteen signals come from head, noise sources may appear for different reasons so it is recommendable to use the headset in a calmed environment and user must be focused in the task that must perform.. Rafael Mendoza 2012. Page 22.
(22)
(23)
(24)
(25)
(26)
(27)
(28)
(29)
(30)
(31)
(32)
(33)
(34)
(35)
(36)
(37)
(38)
(39)
(40)
(41)
(42)
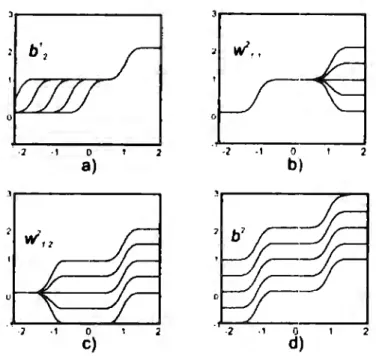
(43) second layer is proposed a linear (Eq. 3) function, although at final implementation it was used a sigmoidal (Eq. 4) functions that retains the possibility of values in a range from Oto S.. 1. f1(n). w,. = 1 + e-n. Eq. 3. f 2 (n). Eq.4. n, 1. ., . . l:-....... lb:. pe. 1. '. n1. w\., '.l:__,.. lb/ 1. In Figure 10 it may be appreciated the effects of parameters changes on the network response. The different curves correspond to the network response when one parameter at a time is varied over the ranges:. -1 S. wf1 S 1,-1 S wf.2 S 1,0 S b¾ S 20,-1 S b 2 S 1. In Figure ll(a) is shown the influence of network blases in the first hidden layer and can be used to locate the position on each step. By other hand Figure 11 (b) illustrates how the weights lnfluence at the slope of the steps and finally the constant bias ;are capable of manipulating the entire network response up or down on figure 11 (d).. Rafael Mendoza 2012. Page44.
(44) 3r---------..... . ·2. .,. O. -2. 2. .,. O. 2. b). a). ]r---------,. u ·1. .,. O. e). 2. Figure 33. Representatlon for varlatlons on the Neural Network.. The representation and data mapping for the shape is really flexible as more layers get involved at the hidden layer until the fact that it may be mapped almost any signal so almost any function could be approximated. Since this brief introduction for the structure, it is established that multilayer networks at the output will become the input for the following layer. This equation will. am+1=¡m+1(wm+ 1 am+bm+1) far. be represented by Eq. 4:. m=0,1, ... ,M-1. Eq.4. where Mis the number of layers in the network. The neurons in the first layer receive externa! inputs:. At the entrance for the Neural Network a 0 will. be the input and the outputs in the last layer will. be considered as:. a= a11 3.1.1 Performance index. The Least Means Squares (LMS) algorithm is an example of supervised training, where the learning rules are provided with a set of examples of proper network behavior.. Rafael Mendoza 2012. Page45.
(45) where Pq is an input to the network and. tq is the corresponding target output. The LMS algorithm. will adjust the weights and biases in the neural network in order to minimize the mean square error, where the error is the difference between the target output and the network output. The algorithm used for multilayer networks is a generalization of the LMS algorithm in both cases the mean square error is used as perfonnance index. As each input is applied to the network, the network output is compared to the target. The algorithm should adjust the network parameters in order to minimize the mean square error (Eq. 5).. F(x) = E[e 2 ] = E[(t - a) 2 ]. Eq. S. Where x is the vector of the network weights and biases. lf the network has multiple outputs this generalizes to:. F(x) The mean square error can. P(x). = E[eT e] = E[(t -. a)T (t - a)]. Eq. 6. be approximated by. = (t(k)- a(k)f (t(k)- a(k)) = eT(k)e(k). Eq. 7. At this case the expectation of the squared error has been replaced by the squared error at iteration k. The steepest descent algorithm for the approximate mean square error is. wlj(k + 1). m 8F = W¡,j(k)-oc awm,. Eq. 8. i,J. bj(k + 1) where. 8P = b1m (k)-oc Bbf,. Eq. 9. a Is the learning rate.. For the multilayer network the error is not an explicit function of the weights in the hidden layers,. it is more complicated to compute the weights. Because the error Is an indirect function of the weights in the hidden layers, the chain rule will be used to calculate the derivatives. lf we have a function / that is an explicit function only of the variable w. The chain rule is then:. Rafael Mendoza 2012. Page46.
(46) i-. df (n(w)). df (n). dn(w). ---=--x-dw dn dw. ......,a.......,,e,¡,~OUdl!Jde~. Blbifoteca. Eq.10. Given the following function:. f(n) = en and n = 2w,so that f(n(w)) = e 2 w Then. df (n(w)) df (n) d n(w) --dw-- = _d_n_ x -dw- = (en)(2) The concept to find the derivatives as it was shown in Eq. 8:. aP 8P iJnj --=--x-iJwlj iJnf' iJwlj. Eq.11. Eq.12. The second term In each of these equations can be easily computed, since the net input to layer m is an explicit function of the weights and bias in that layer: sm-1. _ , wm am-1 + bm nm t - L t,J 'i t. Eq.13. J=1. For this case. anr. anr iJb['1 = 1. m-1. --=a1. iJw~ ,,). For this case m St. aP = iJn!'l 1. The sensitivity of P to changes in the ith element of the net input at each layer. lt can be simplified to:. Eq.14. Eq.15 Rafael Mendoza 2012. Page47.
(47)
(48) in a position while working with the system, therefore no distancE! conditions should vary in order to preserve training conditions. This sltuation could be uncomfo1table for some users and really difficult for being reached.. Regarding classification, if there is set coordinate axes with origin at central point in the keyboard and classification data are keyboard letters dispersed In the four quadrants; it is possible to say that classification between data in dtfferent quadrants is easier than data in the same quadrant. Therefore, although there is aeated a separation between each letter, it will always be easier for the Artificial Neural Networtc to rec:osnize, as less as possible letters, that are in different quadrants.. 4 Eye tracker Once an eye movement has been generated between two already known points, voltage perturbatlons get delayed over the skull. Not only voltage perturbations by the skin are the main source for these sisnals, there are also voltages generated at cerebral cortex which are really tenuous. The intensity of this klnd of sources depends on which area is activated and are related with the activity that the person is developing in that moment, however, it was observed that skin perturbations may reach bigger amplitudes so cerebral cortex signals will be detected but overlaid by eye's voltage propagation over the skull.. Rafael Mendoza 2012. Page49.
(49) temporal tascia frontal beUy ol 0 ,0CCipitofrontalis muscle. auncularis anterior muscie. i\~==-,"".-. epicranial aponeurosis. occ,pital belly ot occipi otrontalls musde. .. ' ·. ~. . · ··. .. .. procerus muscle. · . ·. ·. ortJicularis ocul1 muscle. trapezius muscle. Source of signals Vectors ind~ how ~s mwement origina~ a vohage signal that gets dispened on the slwll. f"igure 35. Voltage source and how it gets delayed over the skull.. By setting the analogy that facial muscles are like elastic layers stretched in a mesh over the cranium, facial bones, the openings they form and the cartilage, fat and other tissues of the head. They may act in single movements or together, for this thesis both will be analyzed, indeed, for each electrode it is possible to sense more than one muscle in movement. Figure 35 shows how it is possible to generate a signal that will be propagated through the skull and being classified in different parts of the head. Of course ali the signals or voltage differences must have a ground ora reference (Figure 35) which will be set at the back part ofthe ears where is the most protruding region of bone close to this region.. MUSCLE Frontalls. ORIGIN Galea Aponeurotica. Orbicularis oculi. Frontal and Maxillary bone. Orbicularis orls. Fibers of other mouth muscles Pectoralis and deltoid fascia. Platysma. INSERTION Skin of eyebrows and nose Skin of eyelid. Muscles and skin at angle of the mouth Lower border of the mandible, mouth skin and muscle. ACTION Raise eyebrows, wrinkles forehead skin Blinking, squinting, forceful closing of eyelids Closes and protrudes lips Depresses mandible, draws angle of mouth downward, tightens skin of the neck. Table 6. Signals's SOIH'ce.. Rafael Mendoza 2012. PageSO.
(50) Since Table 3 indicates which muscles is moved at certain gesticulation it is possible to know where will occur a bigger perturbation. So it was proposed for this thesis an eye tracker that is able to indicate where the person is looking at. By using a modified qwerty keyboard and by placing a set-point which will be the reference from it will be possible to track where the person looked at and by using National lnstruments devices it is possible to use the keyboard to write without touching it. For setting how the pattems must be repeated the following conditions must be found on each set in arder to find the patterns. 1. A minimum distance must be set by the user but there must be considered the facts that:. a.. As far (distance between the set point and the final target) as the letter is, the eye movement will be greater and for the generated signal this means bigger amplitude so it will be easier for the tracker to identify the signa l.. b. The distance between the orbicularis oculi muscle and the modified keyboard must be comfortable for the person and should not be greater than 50 cm. This is because the spin of the eye when looking for a target is not enough to generate a voltage difference.. 4.1 Noise filtering The incoming data from fourteen electrodes is represented on Figure 36. The signal is obtained at 128 samples per second per channel. The signals where taken when the subject was looking for letter A, from sample 118 to sample 143 it can be appreciated a significant perturbation in the sampled signal and that perturbation its repeated from input 352-377 and from 685-710.. Rafael Mendoza 2012. Page 51.
(51)
(52)
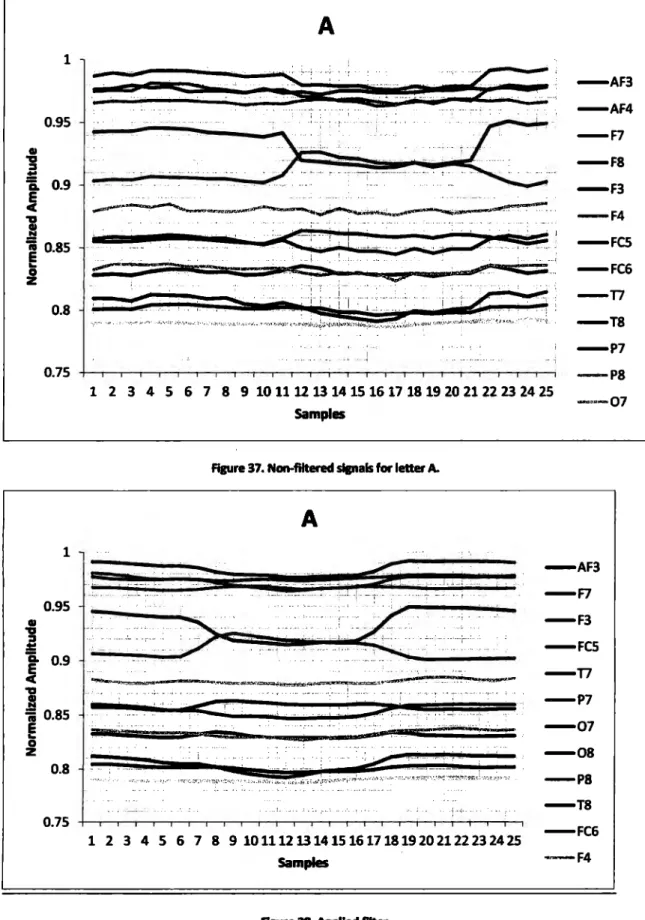
(53) A 1. .--::-:-------=---'.. . . .,.,"'- ·. -. -AF3. --•-·····--·-····. 0.95 11. 1.!::. 'a. 0.9. 1. KlU1. . :1. ,---. '. ..... •. •. ,. .... •. '. ..........~.... --r_-----=>---=-. 110.85 -=••-.........,_. .;,,,r¡¡¡¡·<•c:::::t:7; .. 1. -AF4 -F7. -FS -F3 -F4. .'.._i ______ ,_,.~~ .. -FCS ... ---l. <>. ==·. 0.8. -FC6 -T7 -TS -P7. 0.75. -PS. 123456789WUUUMB~Da~wnnBN~ Samples. -·-07. Figure 37. Non-filtered slpals for letter A.. A 1. ;. -AF3 -F7. 0.95. -F3. 11. 1'a. 1-a J. lz. -FC5. 0.9 - - - ,_u. <. 0.85. ~~w=~=--~~~,...,..-:-,~;:---. :::>t~. 1. -T7 -P7. -01. o. -os 0.8. -PS -TS. 0.75 123456789WUUUMB~Da~WllllBN~ Samples. -FC6 -F4. Figure 38. AppHed fllter. Rafael Mendoza 2012. Page 54.
(54) ---------------. A 0.865. cu. 0.86. "ti ~. :t:. 1i. ~. "ti. cu. 0.855. .!:!. ¡¡ E. . 0. z. 0.85. 0.845. +~~~~. '. -~~----,---,-----,---r--r-¡-----¡-. ,. ,. ,-T-----,------,. 1 2 3 4 5 6 7 8 9 10 1112 13 14151617 1819 20 2122 23 24 25. Samples. Figure 39. T8 Electrode slgnal with more resolutlon.. lt is a remarkable fact that TS is placed at the posterior part of the head and the source for all the signals is at approximately 180º at the semi-sphere drawn by the skull. The perception of this signal aids to the neural network so it may have more basis for differentiate the whole letters.. 5 Wheelchair controller The wheelchair that was used in order to mount controllers was a commercial Quickie wheelchair (David Gregory Monnard, 2009). The wheelchair on its system includes drivers for controlling motor's direction and speed by PWM signals. The transmission supports heavy loads and there will not be controlled the wheelchair's speed.. Rafael Mendoza 2012. Page 55.
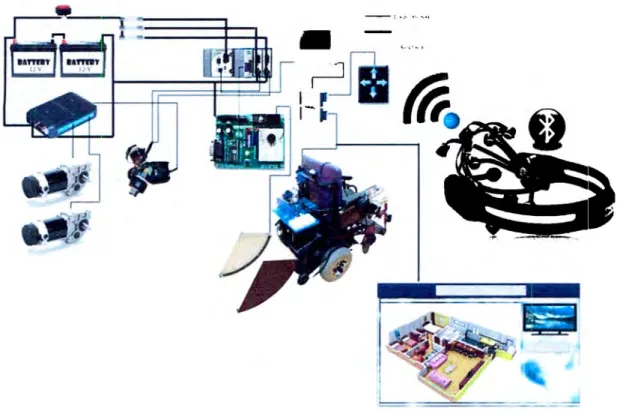
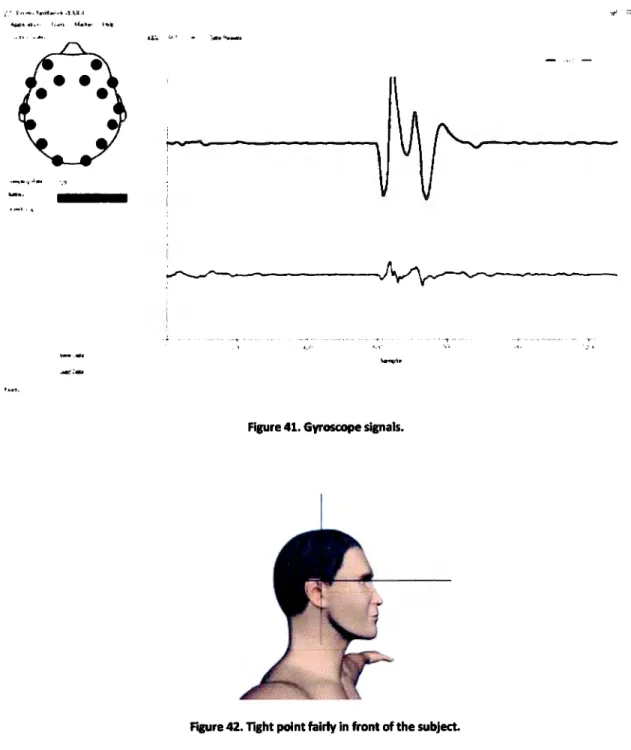
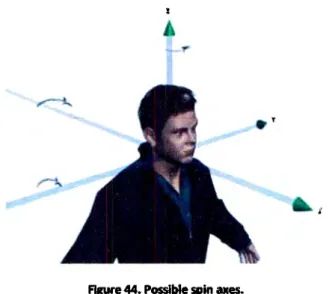
(55) l. ,... _ _ _ _ __. " -·- ------. Figure 40. Oiagram for controlling the system. A gyroscope is a device for measuring orientation, based on the principies of conservation of angular momentum. In this case the electronic gyroscope indicates disturbances regarding the spin of the head.. As previously mentioned, the headset includes a gyroscope system that enables two channels for data deliverance. Both channels may be altered at the same time by executing a spin over z axis (Figure 44) and independently over x and y axis.. Rafael Mendoza 2012. Page 56.
(56) .·_~ t·,··"""-•11,u.,; ..-., -1.\:tJ lroj,pl. . . H,. !,....,.¡. t.4.a,h,,. 1-.. ...... ,. .l. .. ........ .,. .... ,_.,,,. ,. ,:•. Figure 41. Gyroscope signals.. Figure 42. Tight point falrly in front of the subject.. By using this zero point configuration, there can be applied a neural network depending on the direction and position of the subject the wheelchair or any system can be manipulated depending on the inclination:. Rafael Mendoza 2012. Page 57.
(57) Figure 43. Head movement for speed and control direction.. In the case of the direction, it is just necessary to turn the head in such direction. Thinking about control of directions, it is possible to configure a quite speed-direction control. lt can be programmed by using the svroscope which is included in the EPOC system. lt can be achieved by centering at the beginning of the navigation, a tight point, which will be placed just in front of the subject (Figure 42). For this case the gyroscope will only indicate the spin over three axes:. Figure 44. Posslble spin axes.. In the case of these movementes on x and generated over theses axes, the signals can be identified dependig on the first valley originated in the signal. The amplitud will depend on the speed of change for ali three degrees of freedom. The svroscope is enabled for sensing movements generated by the head in any direction, however the perturbations gets reflected in two channels as it is was already explained. The amplitud on. Rafael Mendoza 2012. Page 58.
(58) each channel depends on the acceleration on that axis, it is remarkable to mention that it does not matter the amount of angle spinned by the head. By this means, if there is a slow spin for 30º the signal will not suffer any alteration. The required information for establishing the different patterns is really simple due the data for being recognized is binary, indeed it is really difficult to justify the use of a Neural Networks. For both channels the analysis is done apart, there were trained two different networks and both channels must differentiate just bewtween two patems that are exatly the opposite. However, the hidden layer was trained by only using ten perceptrons, so the matrix multiplication will lmply less time per analysis. The main reason is due the possible noise introduced by the user whenever there is a natural or non-direction-control movement that the user introduces so the clasification trigger will not be fired. Figure 40 show continuous signals that do not show high frequencies rates, so it ispossible to work without signal filtering.. Figure 45. Roulh Input slgnals from Gyroscope.. For the trajectory shown in Figure 46 it was completed in 1 minute and 33 seconds. The headset was used by a person who has not ever used the system. His training included indications about. how the head should be tossed for about 1 minute. Due wheelchair's motors the trajectory was set in a semi-circle pattern in order to help the wheelchair to late less time in spins to left direction.. Rafael Mendoza 2012. Page 59.
(59) Figure 46. Trajectary for testing the headset response.. As a remarkable fact, 3 more different subjects tested the system with the same training and they were able for controlling the system in different terrains and with different slopes in the terrain.. The system is suitable for being driven by a person that is not seat at wheelchair, so it is possible to have control of the wheelchair at the distance allowed by the Bluetooth connection (about five meters if the headset is not interfered by any obstacle). More tests were perfonned in order to set the behavior of the wheelchair inside buildings and outside them; they can be watched in the CD attached to this document.. Rafael Mendoza 2012. Page 60.
(60) Figure 47. VaUdation wlth dlfferent users.. Performance developed for each one of these users can be visualized on the videos attached to this document.. 5. Controlling a virtual Scenario Thinking about more controllers for people with any disability, it was programmed a virtual scenario that in further applications was thought for being linked to preprogramed actions that manipulate real devices. The scenario was designed on LabVIEW and actions may be preprogrammed depending on user's needs. lt contains two images displays and two text indicators. The user may select which room must go, so a path planning algorithm must be designed in order to drive the wheelchair from one place to another. Once the user reaches that room, it is possible to control devices that use digital controls {ON/OFF) in order to turn them on or off. The software was thought for being controlled as easy as possible; in order to activate the system the user only needs to assent with the head so the different rooms will be highlighted and on the text display will be available different devices that might be activated. AII the devices will be. Rafael Mendoza 2012. Page 61.
(61) displayed in sequence and will change on intervals of two seconds so the users just needs to assent in order to select that action.. , Figure 48. Virtual Scenario for being manipulated with head movements.. 6. Software structure AII the programs that linked the headset with the computer were realized on Visual Studio 2010 Premium by using dll's and header files from EMOTIV Epoc and National lnstruments. At Neural Network training LabVIEW Code was used. For Wheelchair's controller, signals were trained by one user and outputs (Weights) just remained constants for all users.. Rafael Mendoza 2012. Page 62.
(62) a.-,_..,..__¡;;_, .,..i...,...,..._ ..... ___ ,._ ~..,.-...:,_._ .. .._...._.._,._..,._,.,F.,_.._._:: ....... .._ ... ~~-_!:'·• f.. ... --.::C-.-f. .. ,.,.,.,._,...,_, _.-._,. -.o.l.-,.,.b_,. ..,...,,..,.C,.tifi,.,..._t..,.__ Q. .,,..mi-. .. o'.,_ :·,,__ .. D-;·,1 g···. e. w. er·· [¡¡. 'Ji,. l. -. El. I. --. ... '.. J J. ""c.,. [¡¡. ij2. ~. l ...1 11111111. J. l. DH. ~u. .. ------- ... - ..., · - ___ .., ... - - · • · -;¡• -----. .... --.. ..,_. _______ ,,...,.._ - ...... ._..._:e:.;-. ~. ---:;r·wc:- a-""' .. ---- 1,..._:,j.. _ .. __ .,.. ___. -e-- -.. -«----·-~e:¿;-~ -::-,---. ¡; -. Figure 49. Weight's initialization by using random function.. In order to obtain weights so they are capable to rebuild head movements, since both channels are trained apart, the initial part of the trainer receives a 25 x 2 matrix per channel. Channel 1 is for left and right. Channel 2 is for up and down. In both cases just two cases must be recognized; this is the reason for the 2 rows and the 25 columns come from how many samples need to be used for rebuilding the pattern signal. Since algorithm will approximate the answer by using Means Square Error on each iteration, there will be a comparison with a target minimum error and training will stop until this minimum is reached or until limit for iterations is reached. The sigmoidal function is used as evaluation function for each perceptron.. r=. IJ. .. -. L! ja ,~ • H. o-. "'. ¡___ .. - - - - ·-·.:.-..-----·-·---------·--··--7-----. ·-·-------·. Figure SO. Cyde for Neural Network training.. Finally the trained weights are tested and the answer is graphed. In order to recognize whether for each channel is one direction or the other, a target pattern is associated with each movement. Due there are just two possibilities per channel, O and 1 represent one direction each one and restricted by sigmoidal function, the possible obtained values will be between O and 1. A trigger value was set in order to reach classification for each direction and for each channel.. Rafael Mendoza 2012. Page 63.
(63) Define Minimum Error and Maximum lterations. lnitialize random 1/.'eights. Evaluate in sigmoidal function : P=W1xlnputs. Evaluate in sigmoidal function Out=W2xP. Obtain Error. E=Target-Out and RMS. Stop program. Figure 51. Flaw dlagram for Obtalnlng welghts.. Figure 45 indicates the algorithms in order to obtain final weights for pattern recognition. lt is the final stage reaching as mínimum error as possible. Notice that number of iterations and mínimum RMS is possible to be configured. Rafael Mendoza 2012. Page64.
(64) Figure 52. Backpropagation training GUI.. For graphical representation on final stage, pattern signal and test inputs with corresponding Weights are tested.. 6.1. Wheelchair and virtual scenario controllers. The following code was configured in C++ and the structure is as following:. Rafael Mendoza 2012. Page 65.
(65) I.Jbraries load inclucing SDK for. EMOTIV EPOC a~ NI tiarÓN¡¡re.. Yes. Stop program. Figure 53. Flow diagram for Gyroscope signals dassification.. At first stage and for performed tests, it was determined that analog signal was possible to be rebuilt in 25 samples from 125 analog data. Data can be obtained in approximately 1 second; it depends on more tasks developed by the processor. Data is normalized on each channel but no filter is applied since high frequencies cannot be continuously executed due it is annoying and tiring for the user. Once completed, FIFO stack is updated with fNe new samples. Vertical movements are associated with advance and stopping the wheelchair. Vertical movements are associated with advancing and stopping the wheelchair; horizontal movements for left and right.. Rafael Mendoza 2012. Page 66.
(66) At evaluation stage, input data is multiplied by weights, multiplications occur per channel so confusion between different channels is avoided. Finally, per channel, is obtained a value between. O and 1, unless answer is 0.5 ±0.2 there will not be executed any action otherwise NI-DAQ will be activated. lf virtual Scenario is wished for being controlled, it is just necessary to run LabVIEW scenario and Classifier.exe files. Once activated, virtual scenario is configured for automatically pass by each available room at main menu and typing in a text field the actual room. Once selected by user, a smaller menu will automatically display possible commands that might be activated in the room.. 6.2. Letters classification. As previously mentioned facial movements and movements generated by eye's movements are. greater than ECGs signals. Depending on speed and amount of movement, variations in fourteen channels are capable for being sensed. In the case of eye's movements the amount of spin and the acceleration will affect the detected signa! so it is possible to determine where the person is looking at. lndeed, what is possible to classify is the movement that eye's movement produces when it is moved from a tight point to a target letter. Although it is common to think that just frontal electrodes will be used, T7 and TS also reflect oscillations at eye's spin, justas previously shown. The usage of the whole set of electrodes aids the Artificial Neural Networks system in order to create redundancy in the outputs so a letter can be detected. Normalization values were taken from previous tests performed with different users, highest pikes that did not represent noise that were repeatable patterns. There also was considered a security margin for the normalization value, it was established for each channel. Since analog signa! is able for being rebuilt in 25 samples from 125 obtained, only these samples are filtered by using a lowpass Butterworth filter of second order.. Rafael Mendoza 2012. Page 67.
(67) Stw 'Prcy¡mt. Figure 54. Flow diagram for letters c681asslflcatlon.. Once filter has been applied, data is stacked per channel and finally gathered in a 350 vector that will be the input for being evaluated by multiplying the weights corresponding to each hidden layer. Finally a binary number is delivered; the number will represent one letter. The amount of bits will depend on how many letters has just been trained in order to indicate which letter was detected. By comparing a trigger value for each bit with the delivered response, Ni-Daq channels are activated.. Rafael Mendoza 2012. Page 68.
(68) By other hand, qwerty keyboard was modified so Artificial Neural Networks may reach a better response since elements for each letter are far from the element of another letter. The keyword was separated so bigger amplitude might be reached and the user is proposed to be approximately 35 cm far from the tight point in height and approximately 10 cm far from tight point to lower part of the frontal bone.. .. a. .. -. 1 1 11. Figure 55. Modlfied qwerty keyboard. Qwerty order was preservecl due lt Is commonly used.. Although redundancy might be set from using more electrodes in different parts of the body, an action must be executed by using determined part of the body, so in people with tetraplegia this action must be avoided.. EMOTIV Epoc code. EmoStateDLL.h, edk.h and edkErrorCode.h are the imported libraries for working with the headset. Variables are initialized, by creating an Event with EE_EmoEngineEventCreate() method, a variable that will handle the communication with the headset and the computer is set. Other variables are initialized so they will be used as flags in the program. Electrodes to be read are indicated in a target list, so when EmoEngine accesses the physical headset, it just reads these targets. The main functions ask for a file in order to save data acquired in the session. lf no error connection is detected, then and object of type DataHandle (is an array)is created in order to save incoming data from headset. The initiation of this variable is until now because it must be previously ensured that connection was reached. In order to ensure Real Time, deliverance of samples was set to 1 second. Function EE_EngineGetNextEvent(eEvent) receives the previously created object that will set communication between Bluetooth port for incoming data handling.. Rafael Mendoza 2012. Page 69.
(69) While there is not any pressed key, and if no error occurs and deliverance has been completed, for cycle is executed and depending on the amount of received data, there will be read the amount of signals marked at channel list. For analysis, this data will be the delivered inputs for the Neural Networks.. Figure 56. EMOTIV Epoc code for data handling.. Rafael Mendoza 2012. Page 70.
(70) t-DAOcode. Nidaqmx header includes different methods that allow the user to configure hardware: duzit, data, connections between references for the sensed phenomenon, frequencies for readinf! and writing data, error checking, etc. Jnce Error handler and data for being written is initialized, by using class Task Handle, each port can be accessed. This is executed by calling a constant arrav that is linked to a letter. this arrav wi 11 be received by Task Handle and writing the final port with the command DAQm»lri teDigitaLL ine. Followin~ to this function time must be waited and finally error method is executed, if any is detected, error code is shown on Command prompt and program is terminated.. kriporM1eadei ,files. Figure 57. DAQ program for being accessecl wlth C++.. 6 Hardware control 6.1 NI-DAQ In order to execute hardware manipulation, C++ code was programmed on Visual Studio. This program is focused on manipulating digital output for NI hardware, in this case digital NI-DAQ channels will be manipulated according to the classified signar.. Rafael Mendoza 2012. Page 71.
Figure


+7


Documento similar
The k Nearest Neighbors (kNN) [32] algorithm is recognized as one of the top ten most influential algorithms in data mining because of its effectiveness on classification and
This section presents the research performed on the topic of ordinal classification with respect to the four main lines of work: hybridization of training algorithms and ba-
If we start from a basically homogeneous data set that is not rotationally aligned, then the classification will group images according to their relative orientation (examples 1 and
We propose two separate deep learning algorithms to filter network traffic flows: Latent Layer Classification on a Variational Autoencoder (LLC-VAE), and Loss Based Detection on
The first method is based on color and texture features extraction, followed by a selection of the most effective features, and classification with a hybrid of artificial
however, little research has focused on the comparison of dif- ferent point classification algorithms. Therefore, the research objectives of this paper are: 1) to evaluate the
To prove this we will introduce a square function operator and we will show that it is bounded from the space of finite real measures on R d to L 1,∞ (µ), by using Calder´
In addition, we have contributed both to the theoretical part, by proposing novel reactive and proactive defences to time series analysis and classification algorithms respectively,
