Full PDF
12
0
0
Texto completo
(2) of overexploitation (Carta Pesquera Nacional 2006). This has led on one hand to the implementation of different management programs to protect the conch (INP-SAGARPA 2008) and on the other hand, to the development of its aquaculture (Berg 1976, Brownell 1977, Brownell & Stevely 1981, Rathier 1987, Glazer et al. 1997, Davis 2000, Moreno de la Torre & Aldana-Aranda 2007). The inlet of Xel-Ha is a natural marine protected area, which has been used since 1995 as a park for ecotourism. The main attraction is the observation of marine fauna in its natural environment; hence the removal of any flora or fauna is prohibited. Xel-Ha is considered a sanctuary for the conservation of the queen conch in the Mexican Riviera Maya, hosting an important number of juvenile conch (Peel et al. 2010). Sound management of a resource such as S. gigas, as well as its rehabilitation, protection and the development of aquaculture require biological and ecological knowledge of the species, including growth rate, density and population structure. In this study we determined the rate of growth of juvenile S. gigas by direct methods in a natural protected area. Data was obtained through capture-markrecapture methods, allowing the natural foraging behavior, resource selection and dispersal of the animals. MATERIAL AND METHODS Study Site: Xel-Ha is located on the east coast of the Yucatan Peninsula (20°19’15’’20°18’50’’N and 87°21’41’’-87°21’15’’W). The main oceanic current is the Caribbean Current (Organismo de Cuenca Península de Yucatán Dirección Técnica 2008). The area is characterized by medium wave energy and input of fresh water by underground rivers due to karstic conditions in the Peninsula (Organismo de Cuenca Península de Yucatán Dirección Técnica 2008). Xel-Ha is a creek that consists of a mix of fresh groundwater with seawater. The Inlet is connected to the Caribbean Sea by a 100 m wide channel and has a total surface of 14 Ha with a center area and three appendices: 128. Bocana, North Arm and South Arm. Depth ranges from 1.75-4.0m (Organismo de Cuenca Península de Yucatán Dirección Técnica 2008). The climate in the region is warm and subhumid, with rains during summer and winter. The average annual temperature is 26°C. Average annual rainfall is 1 079mm (Organismo de Cuenca Península de Yucatán Dirección Técnica 2008). The sampling site “Cueva” is located in the south-arm of the Inlet and includes a small bay surrounded by mangroves (Rhizophora mangle). Persistent upwelling of cold freshwater from underground caves, maintains a permanent thermo-and halocline (1.25m). The site has a depth 1.5-3.5m. The bottom is composed of fine mud and sand formed of fragments of calcareous algae, mixed with rocks and dense isolated patches of macroalgae (Padina sp., Halimeda sp. Penicillus sp. Amphiroa sp. Acanthophora sp., Caulerpa sp., Dictyota sp.), decaying mangrove leaves and inverted jellyfish (Cassiopea sp.) may be found. Population Parameters: Between April 2009 and January 2011, nine surveys were conducted at the site of Cueva in the Inlet of Xel-Ha sampling a total area 6 000m². Three samplings were conducted during 2009, five in 2010 and one in January 2011. All organisms were collected in free-dive, by three divers during 3 hours. We used mark-recapture method, marking all individuals with a plastic Dymo® tag, bearing a consecutive number, which was fixed to the spire of the conch with a plastic cable binder. In order to evaluate the size distribution and growth rate, shell length (SL) was determined for each individual, as well as lip thickness, using a precision vernier caliper (1mm). With the abundance data of recaptured and unmarked individuals we estimated population size using Schnabel’s method (Schnabel 1938): Nt = Σ (Ct Mt)/ Σ Rt. Relative density of conch in Cueva was derived from population size. To determine the growth rate of conch per day, we only used. Rev. Biol. Trop. (Int. J. Trop. Biol. ISSN-0034-7744) Vol. 60 (Suppl. 1): 127-137, March 2012.
(3) the measurements of individuals which were recaptured for the first time after being marked in the previous sample (n=706). Environmental parameters: Parameters for dissolved oxygen (O2), water temperature (°C), salinity, total nitrogen (N total), total phosphates (P total), nitrate (NO3-) and nitrite (NO2-), measured at the study site between February 2009 and September 2010 were provided as a courtesy of Xel-Ha Park and were used to aid interpretation of growth rates over time. Data was obtained through the laboratory LAB-ACAMA (Laboratorio de Análisis de Calidad de Agua y Medio Ambiente S.A. de C.V) applying the procedures specified by the Mexican Normative for Water quality NMXAA-26-SCFI-2001 for sampling and analysis. Statistical Analysis: Using the program Infostat/S, we calculated the mean daily growth and standard deviation per size class (<100mm, 100-149mm, 150-199mm and ≥200mm) and the average growth per day in each class over time. Growth data was subjected to analysis of variance (ANOVA) to detect significant differences in growth rate over time and between classes, with a confidence level of 95%, followed by Tuckey’s honestly significant difference test. (Saville 1990). Population structure was determined using histograms, with 10mm intervals for size classes from 45-245mm. We calculated the percentage of individuals with flaring lip per size class. A correlation analysis using Pearson coefficient (Pearson 1896) between average growth rates from each sample and corresponding density was executed. RESULTS An average of 52.83%, of a total of 1418 individuals tagged, was recaptured in each sample. The recapture success was lowest in October 2009 with 19.93% and highest in November 2010 with 74.74% (Table 1). Using the method of Schnabel, population size was estimated for each month as well as the relative density of conch in the Cueva. The relative average density was estimated at 0.1694 ± 0.0996ind. m-2, while the highest density was estimated for September 2010 with 0.3074 conches per square meter (Table 1). Conches with SL less than 100mm were the scarcest in Cueva representing less than 5%, except in October 2009 and February 2010, when 11.32% and 42.81% were captured, respectively. Relative abundance was highest for the class of conch between 150. TABLE 1 Abundance, estimated abundance using Schnabel Method and density of S. gigas in Xel-há (Cueva) Sample Apr. 09 Jun. 09 Oct. 09 Feb. 10 May. 10 Jul. 10 Sep. 10 Nov. 10 Jan. 11 1. 2. 3. 4. 5. 6.. Ct 127 106 306 406 382 566 545 479 265. Rt 0 68 61 193 195 305 319 358 265. %Rt 64.15 19.93 47.54 51.05 53.89 58.89 74.74. Ut 127 38 245 213 187 261 226 121 0. Mt 0 127 165 410 623 810 1071 1297 1418. Nt. Density (ind. m-2). 198 496 716 906 1128 1844 1422 1422. 0.0330 0.0826 0.1193 0.1510 0.1879 0.3074 0.2370 0.2369. Ct= Number of S. gigas caught in each sampling. Rt= Number of recaptures in each sample. % Rt= Percentage of recapture per sample. Ut= Number of untagged conch in each sample. Mt= Total of marked animals at time. Nt= Estimated population size using the Schnabel method.. Rev. Biol. Trop. (Int. J. Trop. Biol. ISSN-0034-7744) Vol. 60 (Suppl. 1): 127-137, March 2012. 129.
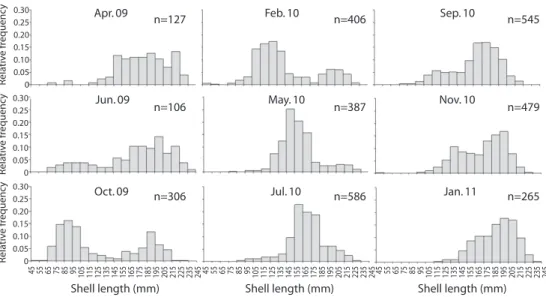
(4) Jan. 10. Nov. 10. Jul. 10. Sep. 10. May. 10. Oct. 09. Feb. 10. Apr. 09. ≥200 mm lip ≥200 mm no lip 150 to 199 mm 100 to 149 mm <100 mm Jun. 09. 100 90 80 70 60 % 50 40 30 20 10 0. Fig. 1. Distribution of relative size class frequencies of queen conch S. gigas, sampled at Xel-ha, Mexico, showing the relative abundance (%) of animals which were <100mm, between 100mm and 149mm, between 150 and 199mm, ≥200mm without lip and ≥200mm with lip.. 0.30 0.25 0.20 0.15 0.10 0.05 0 0.30 0.25 0.20 0.15 0.10 0.05 0 0.30 0.25 0.20 0.15 0.10 0.05 0. Apr. 09. Jun. 09. Oct. 09. n=127. n=106. n=306. Feb. 10. May. 10. Jul. 10. n=406. n=387. n=586. Sep. 10. Nov. 10. Jan. 11. n=545. n=479. n=265. 45 55 65 75 85 95 105 115 125 135 145 155 165 175 185 195 205 215 225 235 245 45 55 65 75 85 95 105 115 125 135 145 155 165 175 185 195 205 215 225 235 245 45 55 65 75 85 95 105 115 125 135 145 155 165 175 185 195 205 215 225 235 245. Relative frequency Relative frequency Relative frequency. and 199mm, which made up an average of 51.18% ± 19.57% of the population. Conch between 100 and 149mm represented on average 22.13% ± 18.69% of the population. Their abundance was highest in February 2010 with 66.50%. Organisms with length ≥ 200mm contributed on average 19.73% ± 11.80% to the population. This class had the least variation in abundance compared with other classes.. 48.01% ± 12.90% of the organisms ≥200mm showed a formed lip (Fig. 1). In April 2009, 94% of the conchs were ≥145mm (Fig. 2). The size classes with highest frequency of abundance in that month were the animals with SL between 215mm and 225mm, and the animals between 185mm and 195mm, making up 26% of the population. In June 2009 a significant increase in organisms <145mm was observed, representing 24% of the organisms sampled. Throughout October 2009 and February 2010 abundance of individuals <145mm increased dramatically, recording 63.42% and 67.73%. Modal class in October was 85-95mm (16.34%) and 125-135mm (17.24%) in February. In May the number of conch <145mm captured decreased again, with 22.5% and the modal class were juveniles between 145mm and 155mm, which represented 25.65% of the population. Modal class shifted in July to the class of 155-165mm (22.79%) and the abundance of conch <145mm continued to decline, reaching 9.35%. In September of the same year, we could detect the emergence of new recruits, with 21.65% of conch <145mm and modal class was 185195mm (16.88%). Recruits kept emerging. Shell length (mm). Shell length (mm). Shell length (mm). Fig. 2. Histograms showing relative frequency of abundance per size class, modal progression and recruitment patterns of queen conch S.gigas sampled at Xel-Ha, Mexico, between April 2004 and January 2011.. 130. Rev. Biol. Trop. (Int. J. Trop. Biol. ISSN-0034-7744) Vol. 60 (Suppl. 1): 127-137, March 2012.
(5) p <0.0001), 100mm to 149mm (F 7, 305 = 36.98, p <0.0001) and 150mm to 199mm (F 7, 267 = 9.14; p <0.0001). There were no significant differences in the class of animals ≥ 200mm (F 6, 35 = 1.46; p = 0.2262). The highest growth rate was observed in May 2010, while the lowest growth was observed in October 2009 and November 2010 (Fig. 4 and Table 2). No significant association was detected between growth rate and the relative density of conch (R=0.17; p = 0.69). Xel-Ha Park occasionally carries out surveys to monitor water quality. The results corresponding to the area of Cueva are shown in Figure 5. 0.40. Growth (mm day-1). throughout November, with 20.05% of the animals <145mm and modal class shifted to 195205mm (16.7%). In January 2011 no conchs smaller than 115mm were found and 97.37% of the sampled population had a size ≥145mm and the class with highest frequency was 195205mm (17.74%). For the growth rate analysis the population was divided into 4 size classes (Fig. 3). Growth was highest in animals of 100-149mm (n=306) with an average growth of 0.27 ± 0.1mm day-1. The animals of this size class showed at the same time the greatest variation in growth rates, with values between 0.01 and 0.63mm day-1. The growth rate had normal distribution (Shapiro-Wilks p=0.0856) and the median coincided with the mean. In juvenile conch smaller than 100mm (n=96) we calculated a growth rate of 0.24 ± 0.05mm day-1. Growth rate decreased to 0.18 ± 0.08mm day-1 in the class of 150 - 199mm (n=268) and was lowest with 0.08 ± 0.07mm day-1 in conch with a size ≥ 200mm (n=36) (Fig. 3). The growth rate showed significant differences between size classes (ANOVA F 3, 705 = 80.08, p <0.0001), but was similar between the classes <100mm and 100-149mm (Tuckey, p< 0.05). The growth showed significant differences over time in classes of <100mm (F 5, 95 = 8.01,. 0.30 0.20 0.10 0. <100 mm. 100-149 mm 150-199 mm. >200 mm. Size Class Fig. 3. Mean growth rate (mm day-1) and its standard deviation (Bars) of queen conch S.gigas with Shell length <100mm, between 100mm and 149mm, between 150 and 199mm, and ≥200mm, sampled at Xel-Ha, Mexico.. 0.40 0.36. Growth (mm day -1). 0.32 0.28 0.24 0.20 0.16 0.12 0.08 0.04 0. Jun. 09. Oct. 09. <100 mm. Feb. 10. May. 10. >200 mm. Jul. 10. Sep. 10. 100 to 149 mm. Nov. 10. Jan. 11. 150 to 199 mm. Fig. 4. Average growth rate (mm day-1) over time in pink queen conch S.gigas with a shell length of <100mm, 100mm to 149mm, 150mm to 199mm and ≥ 200mm, at Cueva (Xel-Ha, Mexico).. Rev. Biol. Trop. (Int. J. Trop. Biol. ISSN-0034-7744) Vol. 60 (Suppl. 1): 127-137, March 2012. 131.
(6) TABLE 2 Average growth (mm day-¹) of queen conch S.gigas with a shell length of <100mm, 100mm to 149mm, 150mm to 199mm and ≥ 200mm, over time, at Xel-Ha, Mexico Size Class / Growth <100(mm) 100 to 149(mm) 150 to 199(mm) ≥200mm. Jun. 09 0.21 0.18 0.2 0.06. Oct. 09 0.26 0.12 0.13 –. Feb. 10 0.23 0.23 0.16 0.1. May 10 0.35 0.35 0.35 0.07. Sep. 10 0.17 0.24 0.15 0.09. Nov. 10 0.2 0.28 0.18 0.1. Jan. 11 – 0.33 0.25 0.15. 28.5. 6. 28. Temperature ºC. 5. O2 mg l-1. Jul. 10 – 0.24 0.19 0.02. 4 3 2. 27.5 27 26.5 26 25.5 25. 1. 24. 0 0.8. 23.5 2.5 2. 0.6. N total mg l-1. P total mg l-1. 0.7. 0.5 0.4 0.3 0.2. 1 0.5. 0.1 0. 0 1.6. 0.025. 1.4. 0.02. NO3- mg l-1. NO2- mg l-1. 1.5. 0.015 0.01. 1.2 1 0.8 0.6 0.4. 0.005. 0.2 0. 0 Feb. 09. Apr. 09. Dec. 09. Mar. 10. Jul. 10. Sep. 10. Feb. 09. Apr. 09. Dec. 09. Mar. 10. Jul. 10. Sep. 10. Fig. 5. Water quality parameters, showing surface temperature, dissolved oxygen at the surface, total nitrogen (N total), Nitrate (NO), Nitrite (NO) and total phosphate (total P) at Xel-Ha’s Cueva. Data was provided by courtesy of the administration of Xel-Ha Park.. DISCUSSION In the present work conch larger than 210mm were present in all samples and a total of 268 observations could be made, representing 8.42% of the population. Aldana-Aranda et al. (2005) reported the absence of animals 132. larger than 210mm at Cueva in the majority of the samples taken in a study conducted between 2001 and 2002. Xel-Ha initiated the Monitoring Program, as well as the actions for conservation and rehabilitation of the queen conch in October 2001. The conch population of Xel-Ha has grown in size and more large and. Rev. Biol. Trop. (Int. J. Trop. Biol. ISSN-0034-7744) Vol. 60 (Suppl. 1): 127-137, March 2012.
(7) juvenile conch could be found than in previous studies, suggesting that the park of Xel-Ha is providing effective protection for the species. Apparent recruitment was detected throughout most of the year, but was highest from June 2009 to May 2010 and September 2010 to November 2010. Aldana-Aranda et al. (2003) documented recruitment throughout most of the year and high recruitment during October 2001. In a subsequent study Aldana-Aranda et al. (2005) documented higher recruitment in October 2002, February 2002 and February 2003, consistent with recruitment peaks observed in this study, in February and October. In the present study population structure was: <100mm = 7.0%; 100-149mm = 22.1%; 150-199mm = 51.2%; ≥200mm = 19.7%. Aldana-Aranda et al. (2005) reported 4.2% of the population <100mm, 23.8% in the class of 100-150mm, 51.2% conch 150-200mm and 23.4% of the population >200mm in the period from November 2001 to August 2003, applying the same methodology. It can be noted that relative proportion of adults and juveniles has remained similar in comparison with previous studies, despite the increase in numbers of. individuals, indicating the population is in an equilibrium state. In the present study, the population was small initially; however, we observed substantial recruitment of juveniles from October 2009 onwards, reaching a maximum density of 0.3074 conches per square meter in September 2010. Aldana-Aranda et al. (2005) estimated a population size of 632.15 ± 49.40 individuals in the period from 2001 to 2003, using Schnabel’s method. Peel et al. (2010) reported average catches of 82.09 conches per sample in the period from January 2004 to January 2008 at the sampling site Cueva. The observed population growth was attributed to increased recruitment of juveniles. The Density at Xel-Ha’s Cueva is high, compared to other areas in the Caribbean (Table 3). The densities documented at Cueva were higher than densities reported for Alacranes Reef, where conch fishery was banned in 1988 (Pérez-Pérez & Aldana-Aranda 1998, Ríos-Lara et al. 1998, Pérez-Pérez & AldanaAranda 2000, Pérez-Pérez & Aldana-Aranda 2003), ranging from 0.0047 to 0.018 conch m-2. They were also higher than the densities reported for the two most important commercial. TABLE 3 Average densities of S. gigas in the Caribbean Author, Year Ríos-Lara et al. 1998 Pérez-Pérez & Aldana-Aranda 1998 Pérez-Pérez & Aldana-Aranda 2000 Pérez-Pérez & Aldana-Aranda 2003 De Jesús-Navarrete et al. 1992 De Jesús-Navarrete & Oliva-Riviera 1997 INP-SAGARPA 2008 INP-SAGARPA 2008 Berg & Glazer 1991 Friedlander et al. 1994 Stoner & Ray 1993 Stoner & Schwarte 1994 Stoner 1996 Stoner 1996 Stoner & Ray 1996 Posada et al. 1999. Location Alacranes Reef, Yucatán, México Alacranes Reef, Yucatán, México Alacranes Reef, Yucatán, México Alacranes Reef, Yucatán, México Punta Gavilán, Quintana Roo, México Punta Gavilán, Quintana Roo, México Banco Chinchorro, Quintana Roo, México Banco Cozumel, Quintana Roo, México Florida Keys, Florida, USA Virgin Islands, USA Exuma Cays, Bahamas Lee Stocking Island, Bahamas Exuma Cays (unfished zones), Bahamas Exuma Cays (fished zones), Bahamas Exuma Park,Exuma Cays, Bahamas Jaragua National Park, Dominian Republic. Rev. Biol. Trop. (Int. J. Trop. Biol. ISSN-0034-7744) Vol. 60 (Suppl. 1): 127-137, March 2012. Density (ind. m-2) 0.0047 0.0072 0.0084 0.018 0.003 0.0052 ± 0.0023 0.0211 ± 0.035 0.0079 ± 0.01653 0.000109-0.000298 0.00171 0.2 0.0018-0.0088 0.0034-0.0147 0.00022-0.0088 0.027 0.0004-0.01142. 133.
(8) queen conch fishery grounds in Quintana Roo, Banco Chinchorro (0.0211 ± 0.035ind m-2) and Banco Cozumel (0.0079 ± 0.01653ind m-2). In Punta Gavilán, a coastal area without commercial fishing, densities range from 0.003 to 0.0052ind. m-2 (De Jesús-Navarrete et al. 1992, De Jesús-Navarrete & Oliva-Riviera 1997). Berg & Glazer (1994) reported in the Florida Keys, USA, densities between 0.000109ind. m-2 and 0.000298ind. m-2, where a permanent fishing ban has been implemented since 1985 and sanctuaries with surveillance have been created due to the rapid depletion of stocks of Queen Conch. The density at Xel-Ha’s Cueva is similar to the relatively natural populations in the Exuma Cays (Table 4) (Stoner & Ray 1993, Stoner 1996) and can be compared to the highdensity aggregation nursery grounds (Stoner & Ray 1993, Stoner & Lally 1994) in terms of population structure and density. The growth rate of juvenile conch in Cueva was high in comparison with those mentioned by other studies (Table 4). De Jesús-Navarrete (2001) obtained an average increase of 3.21mm month-1 (~0.1052mm day-1) in Punta Gavilán and 2.30mm month-1 (~0.075mm day-1) in Banco Chinchorro, maintaining conch in enclosures at density of 0.4ind. m-2. In other areas of the Caribbean similar increases were observed (Randall 1964, Alcolado 1976, Brownell 1977, Ray & Stoner 1994). Growth rates measured during this study were comparable to other studies conducted under natural conditions using mark-recapture methods. Gibson et al.. (1983) determined a rate of 7.2mm month-1 (~0.236mm day-1) in Belize, while in Venezuela an increase of 15mm month-1 (~0.492mm day-1) was measured (Weil & Laughlin 1984) and in Punta Gavilán, juveniles grew an average of 10mm month-1 (~0,327mm day-1) (De JesúsNavarrete & Oliva-Rivera 1997). The growth rate of juvenile queen conch at Xel-Ha’s Cueva was comparable to the growth measured by Moreno de la Torre & Aldana-Aranda (2007) under experimental conditions, using artificial diets, who obtained an increase of 0.160.23mm day-1. However, the conch used in their study had an initial size inferior to 40mm and were smaller than the organisms in the present study. Growth rates declined in the 150-199mm size class and tended towards null in conch ≥200mm (Fig. 3). Conches grow in shell length only until maturation. At this time the flared shell-lip is formed. Subsequent shell growth occurs as a progressive thickening of the shelllip (Appeldoorn 1988). Most conch reach sexual maturation when the shell lip is thicker than 5mm (Appeldorn 1988, Aldana-Aranda & Frenkiel 2007). Shell morphology and maximum size can vary considerably (Alcolado 1976, Appeldoorn 1994) and may not represent a good indicator for maturity (Aldana-Aranda & Frenkiel 2007). The maximum SL observed at Xel-Ha in our study was 239mm and less than the half of the organisms in the ≥200mm class had developed a flaring lip. It may be deduced that more than half of the conch. TABLE 4 Comparative Table of mean growth rates of S. gigas Author, Year. Location. Method. Growth rate (mm month-1). Growth rate (mm day -1). Randall 1964. Virgin Islands, USA. Enclosure. 4.16. ~0.136. Alcolado1976. Cuba. Enclosure, different environments. 3.3. ~0.108. Brownell 1977. Florida Keys, USA. Enclosure. 4.5. ~0,147. Gibson et al. 1983. Belize. Mark-Recapture. 7.2. ~0.236. Weil & Laughlin 1984. Venezuela. Mark-Recapture. 15. ~0.492. Ray & Stoner 1994. Exuma Cays, Bahamas. Enclosure. –. 0.058-0.139. De Jesús-Navarrete & Oliva-Rivera 1997. Punta Gavilán, México. Mark-Recapture. 10. ~0,327. De Jesús-Navarrete 2001. Banco Chinchorro, México. Enclosure, different environments. 3.21. ~0.1052. De Jesús-Navarrete 2002. Punta Gavilán, México. Enclosure, different environments. 2.30. ~0.075. Moreno de la Torre & Aldana-Aranda 2005. México. Laboratory conditions, artificial diet. –. 0.16-0.23. 134. Rev. Biol. Trop. (Int. J. Trop. Biol. ISSN-0034-7744) Vol. 60 (Suppl. 1): 127-137, March 2012.
(9) ≥200mm are still immature and may represent some considerable growth. Growth rate of the queen conch showed large individual variations, especially in animals of the class of 100-149mm. Alcolado (1976) showed that growth may vary according to environmental variability between sites; however, the study area of the Cueva is a relatively small area, making it more likely that all organisms have been exposed to the same conditions. Ray & Stoner (1994) suggested that juvenile conch are vulnerable to predation and may choose lower quality habitat in terms of resources, compromising maximum ingestion and growth, by aggregating or sheltering in dense vegetation, to reduce the risk of predation and increase survival probabilities. The high growth rate of juvenile conch in Xel-Ha and the large variations in individuals likely reflects the natural conditions of foraging and aggregation. We could detect significant variation in the rate of growth over time (Fig. 4). There was an increase in nutrients important for production of biomass (P, N and NO) in the sample of March 2010, for which it is likely that the increase in growth rate during May 2010 might be the result of higher primary productivity. We conclude that the direct method is useful for the assessment of growth in juvenile S. gigas and that growth in natural conditions is higher than in enclosures and aquaculture systems. This information may be applied to fishery management as well as to rehabilitation programs and aquaculture. ACKNOWLEDGMENTS We gratefully acknowledge financial support by CONACYT through Grant Conacyt SEP 24210 Connectivity of the Conch in the Caribbean, CONACYT student scholarship (374674/243375) and CINVESTAV-IPN. Also we thank Xel-Ha Park’s administration, Elizabeth Lugo Monjarras and Ricardo Saenz Morales for providing unlimited access and logistic support during our field work. We thank Xel-Ha staff Enrique May, Teresa Rivas, Angel Chavarria and Mario Hoil for their field support.. RESUMEN La Ensenada de Xel-Ha es usada como parque para ecoturismo y representa un santuario para la conservación del caracol rosado. El incremento en la presión de la pesca ha llevado a la inclusión de esta especie en CITES. Mucho del conocimiento acerca del crecimiento del caracol rosado ha sido generado a través de la acuicultura, encierros oceánicos o usando estimaciones derivadas de las dinámicas poblacionales. En este estudio estimamos la tasa de crecimiento de Strombus gigas juvenil en un área natural protegida, por métodos directos durante el período de abril 2009 a enero 2011. Los datos fueron obtenidos por muestras de captura-marca-recaptura. Un total de 1 418 individuos fueron marcados y el crecimiento de 714 caracoles fue analizado. La talla de la población y la densidad relativa fue estimada usando el método de Schnabel. La densidad promedio relativa fue estimada en 0.1694±0.0996ind. m-2, mientras que la densidad más alta fue estimada para septiembre 2010 con 0.3074ind. m-2 . La tasa de crecimiento más alta (0.27±0.10mm día-1) fue detectada en juveniles con una talla inicial entre 100-149mm, seguida por juveniles <100mm, con un incremento de 0.24±0.05mm día-1. La tasa de crecimiento disminuyó para individuos con una talla inicial entre 150-199mm (0.18±0.09mm día-1) y para organismos >200mm (0.08 ± 0.07mm día-1). La variabilidad en la tasas de crecimiento fue alta en individuos entre 100-149mm y mostró diferencias estacionales; con la tasa de crecimiento más alta en mayo 2010. El reclutamiento de juveniles más alto se dio en octubre 2009 y en febrero 2010. La población de Xel-Ha ha crecido en tamaño y se pudo encontrar más adultos y juveniles que en estudios anteriores, lo que demuestra que el Parque de Xel-Há está funcionando como un santuario para la conservación del caracol rosado del Caribe en la Riviera Maya de México. La tasa de crecimiento de juveniles en Xel-Ha es alta y presenta grandes variaciones en los individuos, lo cual refleja las condiciones naturales de la alimentación y la agregación. Las diferencias estacionales en las tasas de crecimiento pueden estar asociadas con la calidad del agua y la disponibilidad de nutrimentos para la producción primaria. Concluimos que el método directo es útil parar monitorear el crecimiento en juveniles de S. gigas y que el crecimiento en condiciones naturales es mayor que en sistemas de acuicultura. Esta información puede ser aplicada al manejo de pesquerías así como también en programas de rehabilitación y acuicultura. Palabras clave: Strombus gigas, Área Marina Protegida, densidad poblacional, crecimiento, marcaje-recaptura, reclutamiento. REFERENCES Alcolado, P.M. 1976. Crecimiento, variaciones morfológicas de la concha y algunos datos biológicos del. Rev. Biol. Trop. (Int. J. Trop. Biol. ISSN-0034-7744) Vol. 60 (Suppl. 1): 127-137, March 2012. 135.
(10) cobo Strombus gigas L. (Mollusca, Mesogastrópoda). Acad. Cien. Cuba Ser. Oceanol. 34: 36. Aldana-Aranda, D. & L. Frenkiel. 2007. Lip thickness of Strombus gigas (Mollusca:Gastropoda) versus maturity: A management measure. Proc. Gulf Carib. Fish. Inst.58: 431-442. Aldana-Aranda, D., M. Sánchez-Crespo, V. Patiño-Suárez, A. George-Zamora, A.E. Carillo & S. Pérez. 2003. Abundancia, frecuencia de tallas y distribución espacial del caracol rosa Strombus gigas en el parque XelHa, México. P 33-37. In D. Aldana-Aranda. (ed.). El caracol Strombus gigas: Conocimiento Integral para su Manejo Sustentable en el Caribe. CYTED, Merida, Yucatán, México. Aldana-Aranda, D., M. Sánchez-Crespo, P. ReynagaAlvarez, V. Patiño-Suárez, A. George-Zamora & E.R. Baqueiro-Cárdenas. 2005. Crecimiento y temporada reproductiva del caracol rosa Strombus gigas en el parque Xel-Há, México. Proc. Gulf Carib. Fish. Inst.56: 741-754. Appeldoorn, R.S. 1988. Age determination, growth, mortality and age of first reproduction in adult queen conch, Strombus gigas L., off Puerto Rico. Fish. Res. 6: 363-378. Appeldorn, R.S. 1994. Queen conch management and research: status, needs and priorities. p. 301-319. In Appeldorn, R. S. & B. Rodriguez, (eds.). Strombus gigas Queen Conch Biology, Fisheries and Mariculture. Fundación Científica Los Roques, Caracas, Venezuela. Baquiero-Cardenas, E.R. 1997. The molluscan fisheries of Mexico, p. 39-49. In MacKenzie, C.L Jr., V.G. Burrell, A. Rosenfield & W.L. Hobart (eds.) NOAA Tech. Rep. NMFS 129: The History, Present Condition and Future of the Molluscan Fisheries of North and Central America and Europe. U.S. Dept. of Commerce. Berg, C.J. 1976. Growth of queen conch, Strombus gigas, with a discussion of the particularity of its mariculture. Mar. Biol. 34: 1-36. Berg, C.J. & R.A.Glazer. 1994. Current research on queen conch (Strombus gigas) in Florida Waters. Proc. Gulf Carib. Fish. Inst.40: 303-306. Brownell, W.N., C.J. Berg, Jr., & K.C. Haines. 1977. Fisheries and aquaculture of the queen conch, Strombus gigas, in the Caribbean. FAO Fish. Rep. 200: 59-69. Brownell, W.N. & J.M. Stevely. 1981. The biology, fisheries, and management of the queen conch, Strombus gigas. Mar. Fish. Rev., U.S. Dept. Comm. 43:1- 12.. 136. Chakalall, B. & K.L. Cochrane. 1997. The queen conch fishery in the Caribbean – An approach to responsible fisheries management. Proc. Gulf Carib. Fish. Inst. 49:531-554. Davis, M. 2000. Queen conch (Strombus gigas) culture techniques for research stock enhancement and growout markets, p 127-159. In Fingerman, M. & R. Nagabhushanam (eds.). Recent advances in marine biotechnology Vol.4: Aquaculture Part A Seaweeds and Invertebrates. Science Publishers, Inc., New Hampshire, USA. De Jesús-Navarrete, A., E. González, J. Oliva, A. Pelayo & G. Medina. 1992. Advances over some ecological aspects of queen conch Strombus gigas, L. in the southern Quintana Roo, Mexico. Proc. Gulf Carib. Fish. Inst.45: 18-24. De Jesús-Navarrete, A. & J.J.Oliva-Riviera. 1997. Density, growth, and recruitment of the queen conch Strombus gigas L. (Gastropoda: Strombidae) in Quintana Roo, Mexico. Rev. Biol. Trop. 45: 797-801. De Jesús-Navarrete, A. 2001. Crecimiento del caracol Strombus gigas (Gastropoda: Strombidae) en cuatro ambientes de Quintana Roo, México. Rev. Biol. Trop., 49: 85-91. Friedlander, A., R.S. Appeldoorn & J. Beets. 1994. Spatial and temporal variations in stock abundance of queen conch, Strombus gigas, in the U.S. Virgin Islands, p. 51-60 In R.S. Appeldoorn & B. Rodriguez (eds.). Queen Conch Biology, Fisheries and Mariculture, Fundacion Cientifica Los Roques, Caracas, Venezuela. Gibson, J, S. Strasdine & K. Gonzales. 1983. The status of the conch industry of Belize. Proc. Gulf Carib. Fish. Inst. 35: 99-107. Glazer, R.A. & R. Jones. 1997. Temporal factors influencing survival of queen conch outplants. Final Report. U.S. Fish and Wildlife Service Project: 1-58 INP-SAGARPA. 2008. Dictamen Técnico: Estimación de biomasa explotable de Strombus gigas en los bancos abiertos a la pesca en Quintana Roo, México: Banco Chinchorro y Banco de Cozumel. Temporada de Captura 2008-2009. Moreno de la Torre, R. & D. Aldana-Aranda. 2007. Crecimiento y eficiencia alimenticia del caracol rosado Strombus gigas (Linnaeus, 1758) juvenil alimentado con nueve alimentos balanceados conteniendo diferentes niveles de proteína y energía. Proc. Gulf Carib. Fish. Inst.58: 463-467. Rev. Biol. Trop. (Int. J. Trop. Biol. ISSN-0034-7744) Vol. 60 (Suppl. 1): 127-137, March 2012.
(11) Pearson, K. 1986. Mathematical Contributions to the Theory of Evolution.--On a Form of Spurious Correlation Which May Arise When Indices Are Used in the Measurement of Organs . Proc. R. Soc. Lond. 60:489-498. Peel, J.R., R. Saenz, E. May, J. Montero & D. AldanaAranda. 2010. Importance of a Marine Protected Area in the Mexican Caribbean on the Conservation of the Endangered Species of Queen Conch, Strombus gigas. GCFI Book of Abstract 63: 39. Pérez-Pérez, M. & D. Aldana Aranda. 1998. Análisis preliminar de la densidad del caracol rosado (Strombus gigas) en el arrecife Alacranes Yucatán, México. Proc. Gulf Carib. Fish. Inst.50: 49- 65. Pérez-Pérez, M. & D. Aldana-Aranda. 2000. Distribución, abundancia, densidad y morfometría de Strombus gigas (Mesogastropoda:Strombidae) en el Arrecife Alacranes Yucatán, México. Rev. Biol. Trop. 48: 51-57. Pérez-Pérez, M. & D. Aldana-Aranda. 2003. Actividad de Strombus gigas (Mesogastropoda: Strombidae) en diferentes hábitats del arrecife Alacranes, Yucatán. Rev.Biol. Trop. 51: 119-126. Posada, J.M., R.I. Mateo & M. Nemth. 1999. Occurrence, abundance and length frequency distribution of queen conch, Strombus gigas (Gasteropoda) in shallow waters of the Jaragua National Park, Dominican Republic. Carib. J.of Sci. 35: 70-82. Randall, J.E. 1964. Contribution to the biology of the queen conch Strombus gigas. Bull. Mar. Sci. Gulf Carib. 14:246-295. Rathier, I. 1987. Etat d’avancement des recherches sur l’élevage du lambi Strombus gigas in Martinique. Proc. Gulf Carib. Fish. Inst 38: 336-344. Ray, M. & A.W. Stoner. 1994. Experimental analysis of growth and survivorship in a marine gastropod aggregation: Balancing growth with safety in numbers. Mar. Ecol. Prog. Ser 105: 47-59. Ríos-Lara, G.V., K. Cervera-Cervera, J.C. Espinoza-Méndez, M. Pérez-Pérez, C. Zetina-Moguel, & F. Chable Ek. 1998. Estimación de las Densidades de langosta espinosa (Panulirus argus) y caracol rosa (Strombus gigas) en el área central del Arrecife Alacranes, Yucatán, México. Proc. Gulf Carib. Fish. Inst.50:104-127. Saville, D.J. 1990. Multiple Comparison Procedures: The Practical Solution. Am. Stat. 44:174-180. Schnabel, Z. E. 1938. The estimation of the total fish population of a lake. Amer. Math. Month. 45:348-352. Stoner, A.W. & K.C. Schwarte. 1994. Queen conch, Strombus gigas, reproductive stocks in the central Bahamas: distribution and probable sources. Fish. Bull., U.S. 92:171-179. Stoner, A.W. 1996. Status of queen conch research in the Caribbean. Proceedings International Queen Conch Conference Strombus gigas: 23-39. Stoner, A.W. & M. Ray. 1993. Aggregation dynamics in juvenile queen conch (Strombus gigas): population structure, mortality, growth and migration. Mar Biol. 116:571-582. Stoner, A.W. & M. Ray. 1996. Queen conch (Strombus gigas) in fished and unfished locations of the Bahamas: effects of a marine fishery reserve on adults, juveniles, and larval production. Fish. Bull. 94:551-565. Weil, M. & G. Laughlin. 1984. Biology, population dynamics, and reproduction of the queen conch, Strombus gigas Linné., in the Archipielago de los Roques National Park. J. Shellfish Res. 4:45-62.. Rev. Biol. Trop. (Int. J. Trop. Biol. ISSN-0034-7744) Vol. 60 (Suppl. 1): 127-137, March 2012. 137.
(12)
(13)
Figure

Documento similar
In the “big picture” perspective of the recent years that we have described in Brazil, Spain, Portugal and Puerto Rico there are some similarities and important differences,
A shorter body also decreases metabolic costs (Shine 1994), which is favorable in seasonal climatic conditions (How and Shine 1999) because seasonal precipitation may cause
MD simulations in this and previous work has allowed us to propose a relation between the nature of the interactions at the interface and the observed properties of nanofluids:
The Dwellers in the Garden of Allah 109... The Dwellers in the Garden of Allah
In the preparation of this report, the Venice Commission has relied on the comments of its rapporteurs; its recently adopted Report on Respect for Democracy, Human Rights and the Rule
This doctoral thesis provides a health overview for the Palestinian population in regard to factors relating to quality of life and the prevalence of depression in patients
Location of Barranca del Río Santiago (Santiago River Canyon) study area and adjoining protected natural areas by jurisdiction ………. Variables distribution in BRS-SA and
In the previous sections we have shown how astronomical alignments and solar hierophanies – with a common interest in the solstices − were substantiated in the
