Marine ornamental trade in Puerto Rico: rapid population assessment of primary target species
24
0
0
Texto completo
(2) approaches for subsequent application. The Phase I fishery characterization is reviewed by LeGore and Hardin (2002) and Hardin and LeGore (2005). The primary objective of the Phase II population assessments reported here is to enable a rapid and practical first-order estimate of fishery impacts on wild populations of exploited species, as an important component of developing rational marine ornamental fishery management policy in Puerto Rico. This is accomplished by determining minimum extant populations of primary target species and comparing them to known levels of exploitation and export. MATERIALS AND METHODS Assessing impacts of this fishery using classical environmental impact methods comparing impacted areas to control areas is not readily feasible. Identification of “impacted” areas is very difficult, because ornamental fishing is widespread and occurs in a large variety of habitats. Furthermore, reefs and other coastal areas have been subjected to a broad variety of anthropogenic and natural stressors, including sedimentation associated with deforestation and dredging; turbidity and nutrient enrichment effects from domestic and industrial discharge of sewage and other organic materials; over fishing; regional mass mortalities of uncertain etiology; coral bleaching effects; and mechanical destruction caused by boat anchors, hurricanes, and ship groundings (García-Sais et al. 2003). Isolating impacts caused by the marine ornamental fishery from this variety of stressors is not possible given realistic consideration of funding and research resource availability. This fishery exploits more than 100 fish species and more than 100 invertebrate species collected from seagrass meadows, tidal flats, mangrove prop root zones, hard bottom rubble zones mixed with relic reef structures and rock, and on the sides and frontal areas of growing reefs. The majority of marine ornamental collection in Puerto Rico does not occur over growing reefs, chiefly because of 66. the difficulties posed to the deployment and use of fragile barrier nets over structurally complex surfaces. In addition, most collectors in Puerto Rico have made a collaborative decision to not collect on growing reefs to avoid potential conflict with recreational dive tour operators. Nevertheless, the variety of habitat and the geographic areas involved are daunting, and do not lend themselves readily to definitive quantitative estimation of impacts caused by this fishery. A different approach is required to make a first order estimate of this fishery’s impacts. While all areas used by ornamental collectors are not known, the numbers of each species being exported from Puerto Rico are known (Matos-Caraballo 2000; Ojeda-Serrano et al. 2001; LeGore and Hardin 2002; LeGore et al. 2005). A first-order estimate of the total populations of each species will make it possible to understand what portion of each population is being harvested, thereby clarifying the overall impact of this extractive fishery. This approach requires the quantitative assessment of numerous habitat types to yield estimates of the average density of each species in each major habitat type, estimating the amount of each habitat type in relevant regions of Puerto Rican waters, and calculating the total possible population from these data. Habitat data provided by NOAA (2002) were accessed using GIS to calculate population estimates from data gathered by the surveys described in this report. Study Venue: Field surveys were conducted over the two-week period of May 10-24, 2005. Separate teams sampled finfish and invertebrate species in three geographic areas: the Rincón region in NW Puerto Rico; the Boqueron region in the western quadrant of SW Puerto Rico; and the La Parguera region in the southern quadrant of SW Puerto Rico. This regional scheme is depicted in Figure 1, and an overview of sampling locations is provided in Figure 2. Ornamental finfish species were sampled primarily in the Rincón and La Parguera regions, while invertebrate species. Rev. Biol. Trop. (Int. J. Trop. Biol. ISSN-0034-7744) Vol. 56 (Suppl. 1): 65-88, May 2008.
(3) Atlantic Ocean. San Juan. Aquadilla Rincon Region. Mayaguez. Boqueron Region La Parguera Region. Ponce. Arroyo. Caribbean Sea. Fig. 1. Sampling regions in western and southwestern Puerto Rico.. Fig. 2. Sampling stations, with fish sampling stations indicated in blue, and invertebrate stations in red. The 3 southeast-most red stations were outliers excluded from results.. were sampled in the Boqueron and La Parguera regions, coinciding with the primary collecting regions of these fisheries. Finfish Field Surveys: Based upon preliminary evaluations of sampling approaches. (LeGore et al. 2004), finfish surveys were made using 10m x 3m Swimming Belt Transects (SBT) oriented by a line temporarily installed on the bottom. Water depth can be an important determinant of species abundance within habitat types, but the resources available for. Rev. Biol. Trop. (Int. J. Trop. Biol. ISSN-0034-7744) Vol. 56 (Suppl. 1): 65-88, May 2008. 67.
(4) the Phase II assessment precluded stratified sampling replicated by depth in a meaningful manner. These variations were important to recognize, however, as species counts would ultimately be related to two-dimensional habitat area surveys provided by NOAA (2002). To account for depth-related variation in species abundance within habitats, therefore, the SBT transects were sited across ranges of depths wherever possible. Total counts for a given species were then aggregated across all depths in a given habitat type. It was known from previous personal observations and fisher communications that the species of interest occur with a very patchy distribution, i.e. they are not homogenously distributed even within habitat types. This patchiness was compensated for by employing. a large number of transects across habitat profiles including depth profiles ranging from 1.5 to 28m, reef structure along fore-, back- and crest-reef sections of linear reef, and along reef and sand channels for spur and groove formations. Habitat variability was therefore integrated into the density statistics to render them relevant to pre-existing two-dimensional habitat maps (NOAA 2002). The target proxy finfish species list was refined from LeGore et al. (2004) based upon realistic consideration that meaningful species counts could be obtained using belt transects. The final species list (Table 1) consists of 16 species: the 10 species most commonly harvested and 6 species of presumed vulnerability or stakeholder concerns. Locations of finfish survey stations are depicted on navigation. TABLE 1 Final target fish species list. Common name. Scientific name. Anticipated habitat 1. Royal Grama. Grama loreto. Hardbottom. Blue Chromis. Chromis cyanea. Hardbottom. Bluehead Wrasse. Thalassoma bifasciatum. Hardbottom. Blackbar Soldier. Myripristis jacobus. Hardbottom. Blue Tang. Acanthurus coeruleus. Hardbottom. Neon Wrasse. Halichoeres garnoti Juv.. Hardbottom. Rock Beauty. Holacanthus tricolor. Hardbottom. Yellowhead Jawfish. Opistognathus aurifrons. Reef rubble. Redlip Blenny. Ophioblennius atlanticus. Colonized bedrock, colonized pavement with & without sand channels. French Angelfish. Pomacanthus paru. Coral reef and colonized hardbottom. Gray Angelfish. Pomacanthus acuatus. Coral reef & reef rubble, colonized bedrock & hardbottom, colonized pavement with & without sand channels. Spanish Hogfish. Bodianus rufus. As above. Yellowtail Hamlet. Hypoplectrus chlorurus. As above. Yellowtail Damsel. Microspathodon chrysurus. As above. Beaugregory. Stegastes leucostictus. Sand, submerged vegetation, coral reef & reef rubble, colonized and uncolonized hardbottom. Sharpnose Puffer. Canthigaster rostrata. Coral reef. 1. 68. NOAA (2002).. Rev. Biol. Trop. (Int. J. Trop. Biol. ISSN-0034-7744) Vol. 56 (Suppl. 1): 65-88, May 2008.
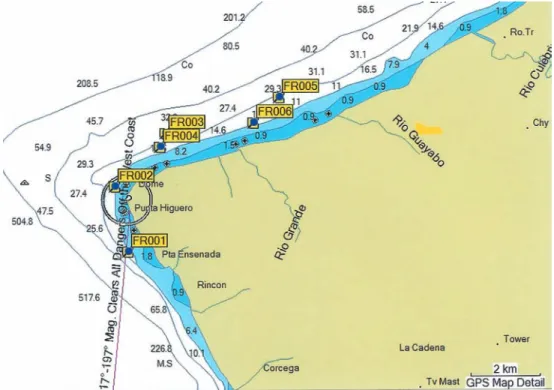
(5) charts, with the Rincon area in Figures 3 and 4, and the Parguera area in Figure 5. General habitat descriptions are provided in Table 2, but some differences were noted during field surveys between the habitat types observed by the Phase II Finfish Survey Team and the habitat types indicated by the NOAA database. These differences were considered relevant to study objectives only in the case of the reef types “spur & groove” and “linear.” Some habitats were indicated as “linear” in the NOAA database, but were observed to be spur & groove formation when visited during this survey. The finfish team concluded that “spur & groove” is significantly under-represented in the NOAA database, with only 63 hectares identified as “spur & groove” island wide, even though it is the characteristic structure of the shelf-edge along the southwestern coastline (Jorge R. García-Sais, personal communication). To compensate for this observation, the “spur & groove” and “linear” reef habitat categories and associated fish count data were aggregated for purposes of this evaluation.. Invertebrate Field Surveys: Protocols and procedures for the Phase II Invertebrate surveys also were adapted from LeGore et al. (2004). Because the invertebrate ornamental fishery in Puerto Rico is diverse, with >100 species being captured and exported, comprehensive study of these species was beyond resources available, and a list of 20 representative or surrogate target species was developed (Table 3). This list was developed beginning with the 50 species most frequently exported on the basis of numbers shipped (LeGore and Hardin 2002, LeGore et al. 2005), and subsequently culling species presenting significant survey issues. Some candidate species were eliminated on the basis that they are highly cryptic such that they are difficult to discern in their habitat, they are typically nocturnally active rendering daylight surveys ineffective (e.g. the “Blue Filter Starfish,” Astropecten sp.), or they typically inhabit depths or habitats not scheduled for survey. Other species were eliminated on the basis that their taxonomy is unclear.. Fig. 3. Fish sampling stations in the Rincon area.. Rev. Biol. Trop. (Int. J. Trop. Biol. ISSN-0034-7744) Vol. 56 (Suppl. 1): 65-88, May 2008. 69.
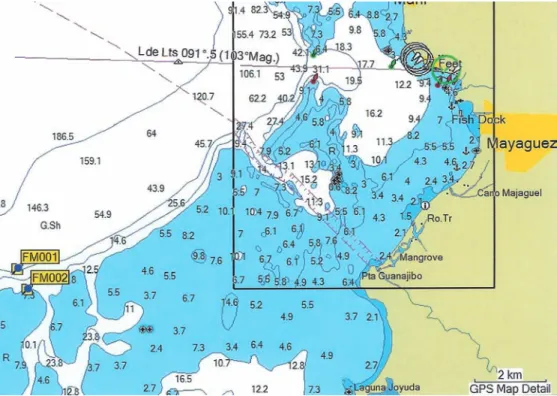
(6) Fig. 4. Fish sampling stations in the Mayaguez area, which was included in the Rincon Region for analysis.. Fig. 5. Fish sampling stations in the Parguera area.. 70. Rev. Biol. Trop. (Int. J. Trop. Biol. ISSN-0034-7744) Vol. 56 (Suppl. 1): 65-88, May 2008.
(7) TABLE 2 Habitat types at fish survey stations. Station ID. Name. NOAA habitat. Observed habitat. La Parguera Region FP-1. Shelf-Edge (Guanica). Linear reef. Spur & groove. FP-2. Turrumote Fore-Reef. Linear reef. Linear reef/fore-reef. FP-3. Media Luna Back-Reef. Linear reef. Linear reef/back-reef. FP-4. Turrumote Back-Reef. Linear reef. Linear reef/back-reef. FP-5. Shelf-Edge (Boya Vieja). Linear reef. Spur & groove. FP-6. Media Luna Fore-Reef. Linear reef. Linear reef/fore-reef. FP-7. South Turrumote Patch Reef. Patch reef (Individual). Patch reef (individual). FP-8. La Gata Patch Reef. Patch reef (Individual). Patch reef (individual). FP-9. El Palo. Colonized pavement with sand channels. Colonized pavement with sand pools. FP-10. Margarita. Colonized pavement. Colonized pavement. Rincón Region FM-1. Tourmaline Reef 30m. Linear reef/spur & groove. Linear reef/spur & groove. FM-2. Tourmaline Reef 10m. Linear reef/spur & groove. Linear reef/spur & groove. FR-1. Tres Palmas. Colonized pavement with sand channels. Linear reef. FR-2. Lighthouse-Domes. Colonized pavement with sand channels. Colonized pavement with sand pools. FR-3. Tambu. Colonized pavement with sand channels. Colonized pavement with rubble pools. FR-4. Porkfish Cave. Scattered coral rock/ unconsolidated sediments. Scattered coral rock/ unconsolidated sediments. FR-5. Aguada. Colonized pavement with sand channels. Colonized pavement with sand channels. FR-6. Second River Mouth. Scattered coral rock/ unconsolidated sediments. Scattered coral rock/ unconsolidated sediments. Among the species listed are two plant species (Shaving Brush, Fan Halimeda) traded as marine ornamentals as part of the “invertebrate” fishery. They are macro algae, and are included here because their typical habitats coincide with habitats scheduled for study. The invertebrate fishery in Puerto Rico is somewhat unstructured in that the market names used for several species are taxonomically unclear, and in some cases overlapping. That is, the same common or marketing name. may be used for more than one species, or conversely, a single species may be marketed under more than one name, depending on the vagaries of the marketplace. In particularly difficult cases of taxonomic uncertainty, taxa were eliminated from the surrogate target list. Examples of species culled for habitat considerations include the fiddler crab (Uca sp.), which is an intertidal organism that would require a specific and targeted survey for this single species, which was beyond available. Rev. Biol. Trop. (Int. J. Trop. Biol. ISSN-0034-7744) Vol. 56 (Suppl. 1): 65-88, May 2008. 71.
(8) TABLE 3 Final invertebrate target species list. Common name. Scientific name. Anticipated habitat 1. Blue Legged Hermit Crab. Clibanarius tricolor. Rock rubble. Pink Tip Anemone. Condylactis gigantean. Seagrass. Feather Duster. Bispira variegata. Seagrass. Curly Cue Anemone. Bartholomea annulata. Seagrass. Flame Scallop. Ctenoides scabra. Under rocks. Sea Mat. Zoanthus pulchellus. Seagrass, mangrove fringe. Sea Cucumber. Astichopus sp.. Ubiquitous. Emerald Crab. Mithraculus sculptus. Under rocks. Red Thorn Starfish. Echinaster echinophorus. Mangrove edge, low light. Sunray Anemone. Actinostella flosculifera. Grass, near mangroves. Pincushion Urchin. Lytechinus variegatus. Seagrass & under rocks. Carpet Anemone. Stichodactyle sp.. Seagrass. Bahamas Starfish. Oreaster reticulatus. Seagrass. Shaving Brush. Penicillus capitatus. Seagrass 2. Brittle Starfish. Ophiocoma spp. (?). Harlequin Serpent Star. Ophioderma appressum. Under rocks. Long Spine Urchin. Diadema antillarum. Sand, coral heads, rocks. Corky Sea Fingers. Briareum asbestinum. Seagrass. Fan Halimeda. Udotea flabellum. Seagrass. Red Rock Urchin. Echinometra sp.. Under rocks & mangrove fringe. 1 2. William McMillan, fisher (personal communication). Plus Red Serpent Starfish (Opdioderma rubicundum); see text.. resources for this effort. Similarly, the Sally Lite Foot Crab (Percnon gibbesi) was deleted because it is highly elusive and therefore difficult to efficiently characterize. The Star Snail (Astraetuber sp.) was deleted based upon survey experience -- its camouflage renders it very difficult to see, particularly during a rapid survey in which speed and efficiency are paramount. Counts of the Red Serpent Starfish (Opdioderma rubicundum) were combined with Brittle Stars (Ophiocoma sp.) because they are difficult to differentiate in the field, especially among smaller specimens, and these species are generally not discriminated in the ornamental marketplace. 72. Under rocks. Several protocols were used in these surveys including Swimming Belt Transects (SBT), Swimming Area Searches (SAS), and Quadrat procedures involving surface counts and digging quadrats, depending upon species sought. SBTs were only 1.5m wide, in contrast to finfish SBTs that were 3m wide; and they involved two divers swimming side by side following a line-marked transect, each counting all visible target organisms within 0.75m of their respective sides of the line. This narrow area was required to facilitate careful inspection in search of small target species. A wider area required the diver to swim side to side to. Rev. Biol. Trop. (Int. J. Trop. Biol. ISSN-0034-7744) Vol. 56 (Suppl. 1): 65-88, May 2008.
(9) enable searching straight down among seagrass and other sight line obstructions, which was both inefficient and led to double counting when the diver occasionally lost his bearings relative to the transect line, particularly in areas with significant water currents. When the survey station configuration allowed, a structured transect pattern was used, in which a square 50m on a side was plotted with random orientation relative to shorelines, yielding four 50 m transects. The midpoints of opposing sides of the square were then connected, yielding two additional 50m transects. This formal pattern was used when possible to avoid prejudicial siting and to encourage randomness across depths and microhabitat types. Both considerations were deemed critical, as survey counts would ultimately be related to two-dimensional habitat maps without differentiation of depth or microhabitats. The transects, therefore, were required to be positioned in such manner as to integrate across these variables, yielding a usable “average” count per unit of habitat type. When survey stations were not amenable to this pattern, transects of variable length were established in near-random directions, but with the non-random intent of crossing depth contours to account for this variable to the degree possible. Transect length varied depending upon configuration limitations of the site being surveyed, and subsequent species density calculations accounted for this variable. SASs were utilized when time availability was an issue or when site microhabitats appeared unusually variable to the extent that doubt existed concerning whether representative transects could be established within reasonable time. These surveys were conducted by a diver swimming a back and forth pattern to thoroughly cover a measured area while counting all target species encountered. While not as accurate as Belt Transects, these surveys were nevertheless deemed adequate for providing conservative population information suitable for developing management policy based upon minimum – or “at least as many as” – population estimates.. Quadrat samples were collected at numerous shallow sites. They varied from 0.25 m2 to 1.0 m2 in size, depending upon local conditions. Also, several were limited to surface counts of organisms visible with minimal disturbance of the habitat surface, generally limited to lifting and subsequent careful replacement of small rocks and debris. In other cases, the surface within the quadrat was dug to a depth possible by hand, generally to a depth of <10cm, with all captured organisms being placed into a bucket for later identification and counting. Some species were more effectively counted using surface counts, most notably Blue Legged Hermit Crabs, Emerald Crabs, and Red Rock Urchins. Other species were better collected by digging in the quadrat, such as small Sea Cucumbers, Pincushion Urchins, Brittle Starfish, and Harlequin Serpent Starfish. All invertebrate area counts, regardless of which method was used, were computed as Number/m2, which was subsequently converted to Number/ha (hectare). For the mangrove fringe surveys, all organisms encountered within one foot (0.3 m) outside of the outermost mangrove prop root were counted. All organisms were counted landward of this point to the extent field personnel were able to penetrate the root system to discern individual specimens, and species counts were recorded as number/linear meter of shoreline. Two observations were required to survey mangrove fringe habitats: one underwater using a dive mask, and one above water to count organisms on shore or on prop roots at and above the waterline. When practical, these observations were made concurrently by two separate observers to avoid duplicate counts. In lower energy habitats of many mainland mangrove areas, however, soft and deep sediments made dual observer counts impossible, so a single individual made the counts alone. Because examination of a consistent depth into the mangrove root system was not possible, mangrove shoreline counts were computed as Number/Linear m, which was converted to Number/km by multiplying by 1.000. Microhabitat and associated community variability was particularly pronounced within. Rev. Biol. Trop. (Int. J. Trop. Biol. ISSN-0034-7744) Vol. 56 (Suppl. 1): 65-88, May 2008. 73.
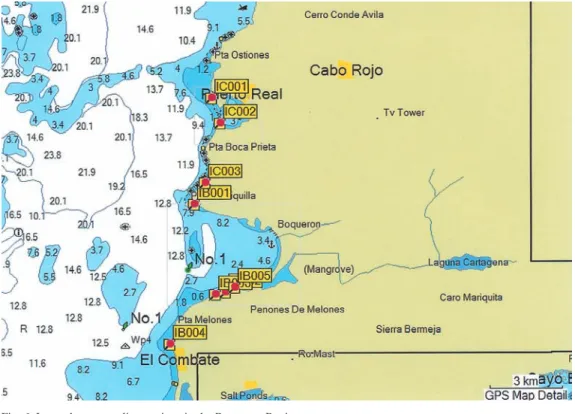
(10) mangrove fringe areas around offshore islands. In these areas, the high-energy seaward environment is markedly different than the lowerenergy landward side, and the alternate ends of the islands generally supported different communities because of differences in solar exposure and prevailing water currents, and perhaps as well by prevailing wind and turbulence patterns. Gradations occurred among all these habitats, further complicating definition of the habitat type. In response, surveys of offshore island mangrove fringe communities were conducted around the entire island in each case. Species counts were then averaged to provide mean species counts per linear meter of shoreline in order to integrate results across all the habitat variations. A distinction that had to be made from the NOAA (2002) database was between “mainland” mangrove shore and “offshore island” mangrove shore, because the offshore areas are higher energy shorelines providing quite different habitats and supporting very different biological communities than the lower energy, silty habitats of mainland mangrove shores. For purposes of these analyses (only!), mangrove shores were designated “offshore mangroves” if they occurred >100 m offshore of the mainland, and were designated “mainland mangroves” if they occurred <100 m from the mainland shore. Although arbitrary, this appeared to be a reasonable estimated break point based upon field observations. Central to purposes of this assessment is the assignment of species densities to habitat types consistent with habitat categories provided by NOAA (2002). A category determined during surveys to be exceedingly important to the invertebrate component of this fishery, however, is the shallow tidal flat, which is not explicitly identified as a habitat type in the NOAA database. These flats consist of the shallow subtidal areas less than about 1-2ft (0.3-0.6m) deep at low tide. Many are associated with offshore mangrove islands, but others exist as shoals in their own right. In general, observations indicated that most of the offshore mangrove islands have 74. associated flats with areas equal to about 0.5 to 2.0 times the area of the island. In addition, the shoals unassociated with islands sometimes cover extensive areas, providing substantial areas of shallow flats. Resource limitations precluded a comprehensive definitive survey of these flats and their total area, so for purposes of this study, the area of “shallow flats” is arbitrarily estimated as equal to the area of the emergent offshore mangrove islands, an area that is obtainable from the NOAA database. This estimate is considered very conservatively low, but for purposes of estimating minimum species populations for conservative “Precautionary Principle” fisheries management purposes (Fox 1999, Griego 2004), it is considered preferable to err on the side of conservatism than otherwise. In addition to the offshore shallow flats, a mainland shallow flat of comparable productivity was located on the south side of Boqueron Bay, from Station IB-5 southward to Station IB-4, a distance of approximately 4km. This flat area is an average of approximately 10m wide, and the area of interest is therefore about 10m x 4,000m = 40,000m2, or 4ha in size. This area was therefore added to the estimate of shallow flats area in the Boquerón Region. Invertebrate surveys were conducted in two broad areas of Puerto Rico, identified as the “Boquerón” and “La Parguera” regions, which correspond to the areas of primary historical importance for invertebrate collectors active in the current export fishery. Samples were also collected in other regions, including outside the mouth of Guanica Bay, and around mangrove islands offshore of Salinas. Samples from the latter two areas proved of little value, however, and are not considered further here. Locations of the invertebrate survey stations are depicted on navigational charts in Figures 6-8, with Figure 6 indicating Boqueron Region stations and Figure 7 and 8 showing Parguera Region stations. Data Handling: A core objective of this effort was to develop density estimates for the species of interest in primary habitat types, and. Rev. Biol. Trop. (Int. J. Trop. Biol. ISSN-0034-7744) Vol. 56 (Suppl. 1): 65-88, May 2008.
(11) Fig. 6. Invertebrate sampling stations in the Boqueron Region.. Fig. 7. Invertebrate sampling stations in the La Parguera area.. Rev. Biol. Trop. (Int. J. Trop. Biol. ISSN-0034-7744) Vol. 56 (Suppl. 1): 65-88, May 2008. 75.
(12) Fig. 8. Invertebrate sampling stations in the Bahia Montalva area, within the Parguera Region.. to subsequently use these density estimates to calculate population estimates as a benchmark against which to compare harvest rates. Densities/m2 were multiplied by 10,000 to provide densities per hectare (ha). The total area in hectares for reach habitat type was estimated by querying the NOAA Benthic Habitat Survey database (NOAA 2002). The total population was then estimated by simply multiplying the density/ha by the number of hectares of habitat. All extrapolations were internal to each region, in that only species density estimates from the La Parguera Region were used to extrapolate that region’s estimated populations, and only species density estimates from the Rincón Region were used to extrapolate the Rincón Region’s estimated populations, and so on. These conservative population estimates were then compared to known capture and export figures to estimate the magnitude 76. of impact the fishery has on wild stocks of exploited species. This information will provide input to the Phase III development of marine ornamental fishery management policy. RESULTS Finfish Assessment Results: Mean species densities per hectare for each habitat type for the La Parguera and Rincón Regions are presented in Tables 4 and 5, respectively. As expected, considerable variability occurred around the mean density of most species within habitat types. Coefficients of Variation (= 100 x Standard Deviation/Mean Value of Set) are >200% for the less common species such as the French Angel, but are still >100% even for most of the more common fish such as the Royal Gramma and Blue Chromis. This high degree of variability among transects. Rev. Biol. Trop. (Int. J. Trop. Biol. ISSN-0034-7744) Vol. 56 (Suppl. 1): 65-88, May 2008.
(13) TABLE 4 Mean fish densities per hectare (/ha) by habitat type in the La Parguera Region. Common name. Number of SBTs 1. Linear reef + spur & groove. Patch reef. Colonized pavement. Col. pavement + sand channels. Scattered rock & coral. 54. 21. 12. 12. 0. Royal Gramma. 1.171. 278. 0. 0. NS 2. Blue Chromis. 4.860. 1.292. 0. 0. NS. Bluehead Wrasse. 6.190. 2.713. 1.028. 3.694. NS. Red Lip Blenny. 17. 19. 0. 0. NS. Blackbar Soldier. 352. 236. 0. 250. NS. Blue Tang. 341. 171. 83. 0. NS. Neon Wrasse. 302. 56. 194. 28. NS. Rock Beauty. 6. 14. 0. 0. NS. Yellowhead Jawfish. 0. 0. 56. 0. NS. French Angel. 9. 19. 0. 0. NS. Gray Angel. 32. 51. 0. 0. NS. Spanish Hogfish. 31. 14. 0. 0. NS. Beaugregory. 295. 144. 28. 111. NS. Sharpnose Puffer. 147. 106. 167. 0. NS. Yellowtail Hamlet. 73. 111. 0. 0. NS. Yellowtail Damsel. 225. 292. 0. 694. NS. 1 2. SBT = 10 m x 3 m Swimming Belt Transect. NS = Not Sampled.. reflects the anticipated patchy distribution characteristic of hardbottom finfish species in general, and the target species of this assessment in particular. The mean fish densities per hectare provided in Tables 4 and 5 were multiplied by the estimated habitat area (ha) to prepare firstorder estimates of species populations in each of the surveyed habitat types in each of the two study regions. Results of these calculations are presented for the La Parguera and Rincón Regions in Tables 6 and 7, respectively. Some differences between the two regions are readily apparent. No Gray Angelfish were counted, for example, in the Rincón Region,. despite the inclusion of 18 SBTs in Linear Reef + Spur & Groove habitat, which was noted as Grey Angelfish habitat in the La Parguera Region. A second habitat for Gray Angels in La Parguera, however, was patch reef habitat, which was not sampled in the Rincón Region. Conversely, the estimated population of Rock Beauty was relatively low in La Parguera, at 14,294 compared to 66,720 in the Rincón Region, despite Rincón’s smaller size. Interestingly, a primary Rock Beauty habitat in the Rincón Region was Colonized Pavement with Sand Channels, but similar habitat in the La Parguera Region yielded no counts of this species.. Rev. Biol. Trop. (Int. J. Trop. Biol. ISSN-0034-7744) Vol. 56 (Suppl. 1): 65-88, May 2008. 77.
(14) TABLE 5 Mean fish densities per hectare (/ha) by habitat type in the Rincón Region. Common name. Number of SBTs 1. Royal Gramma. Linear reef + spur & groove. Patch reef. Colonized pavement. 0. 0. 42. 22. NS 2. NS. 294. 736. 18. 1.463. Col. pavement + sand channels. Scattered rock & coral. Blue Chromis. 3.556. NS. NS. 2.905. 128. Bluehead Wrasse. 2.315. NS. NS. 3.127. 8.001. Red Lip Blenny. 0. NS. NS. 0. 426. Blackbar Soldier. 704. NS. NS. 206. 218. Blue Tang. 111. NS. NS. 51. 94. Neon Wrasse. 759. NS. NS. 502. 141. Rock Beauty. 19. NS. NS. 30. 81. Yellowhead Jawfish. 0. NS. NS. 653. 0. French Angel. 0. NS. NS. 9. 37. Gray Angel. 0. NS. NS. 0. 0. 74. NS. NS. 32. 56. Beaugregory. 889. NS. NS. 257. 74. Sharpnose Puffer. 222. NS. NS. 100. 114. Yellowtail Hamlet. 37. NS. NS. 9. 0. Yellowtail Damsel. 0. NS. NS. 9. 0. Spanish Hogfish. 1 2. SBT = 10 m x 3 m Swimming Belt Transect. NS = Not Sampled.. In La Parguera, the primary habitat in which Red Lip Blennies were found was in Linear Reef + Spur & Groove, but this species was not found in similar habitat in the Rincón Region. In this region, however, the primary habitat for Red Lip Blennies was Scattered Rock & Coral, in which zero counts were found in the La Parguera Region. Similarly, a primary habitat for French Angels in the Rincón Region was Colonized Pavement with Sand Channels, but no French Angels were found in similar habitat in the La Parguera Region. These clear differences emphasize the need to use internally-generated species density estimates for extrapolating each region’s population estimates. 78. Invertebrate Assessment Results: Mean invertebrate densities by habitat type in the La Parguera and Boquerón Regions are presented in Tables 8 and 9, respectively. Minimum population estimates are provided in Tables 10 and 11. Note from Table 9 that most species were not sampled on the Boquerón mainland flat, imposing yet another level of conservatism to population estimates. DISCUSSION Finfish: Comparisons of aggregated regional population estimates against annualized harvest data derived from 1998-2000 export records are provided in Table 12. The. Rev. Biol. Trop. (Int. J. Trop. Biol. ISSN-0034-7744) Vol. 56 (Suppl. 1): 65-88, May 2008.
(15) TABLE 6 Fish population estimates by habitat type in the La Parguera Region. Common name. Area of Habitat (ha.) in the Region. Linear reef + spur & groove. Patch reef. Colonized pavement. Col. pavement + sand channels. Scattered rock & coral. Total population estimate. 1.603. 334. 3.488. 4.490. 1.238. Royal Gramma. 1.877.113. 92.852. 0. 0. NS 1. 1.969.965. Blue Chromis. 7.790.580. 431.528. 0. 0. NS. 8.222.108. Bluehead Wrasse. 9.922.570. 906.142. 3.585.664. 16.586.060. NS. 31.000.436. Red Lip Blenny. 27.251. 6.346. 0. 0. NS. 33.597. Blackbar Soldier. 564.256. 78.824. 0. 1.122.500. NS. 1.765.580. Blue Tang. 546.623. 57.114. 289.504. 0. NS. 893.241. Neon Wrasse. 484.106. 18.704. 676.672. 125.720. NS. 1.305.202. Rock Beauty. 9.618. 4.676. 0. 0. NS. 14.294. Yellowhead Jawfish. 0. 0. 195.328. 0. NS. 195.328. French Angel. 14.427. 6.346. 0. 0. NS. 20.773. Gray Angel. 51.296. 17.034. 0. 0. NS. 68.330. Spanish Hogfish. 49.693. 4.676. 0. 0. NS. 54.369. Beaugregory. 472.885. 48.096. 97.664. 498.390. NS. 1.117.035. Sharpnose Puffer. 235.641. 35.404. 582.496. 0. NS. 853.541. Yellowtail Hamlet. 117.019. 37.074. 0. 0. NS. 154.093. Yellowtail Damsel. 360.675. 97.528. 0. 3.116.060. NS. 3.574.263. 1. NS = Not Sampled.. average annual export figures prior to regulation of this fishery represent very small percentages of the estimated populations. Exports of only two species represented more than 1% of the estimated species populations, namely the Rock Beauty (1.56%) and the French Angel (1.16%). It should be noted that these statistics represent very conservatively low estimates of species populations. Rather than representing total populations, they may be more accurately regarded as minimum population estimates, i.e. there are at least as many as the population estimates indicate. Only 5 of 13 hardbottom habitat types recorded in the La Parguera and. Rincón study areas were included in the survey, although the remaining habitat types likely host some undetermined numbers of the same species. In addition, the 12,387 hectares of the five surveyed habitat types recorded by NOAA (2002) in the two study areas only account for 6.5% the island-wide total (189,512 hectares) for these same habitat types. Another area of conservatism lies within the survey itself. For several species, significant numbers were found on Scattered Rock & Coral Habitat in the Rincón Region, but for logistical reasons this habitat was not surveyed in the La Parguera Region, resulting in estimates of zero population in this habitat. Rev. Biol. Trop. (Int. J. Trop. Biol. ISSN-0034-7744) Vol. 56 (Suppl. 1): 65-88, May 2008. 79.
(16) TABLE 7 Fish population estimates by habitat type in the Rincón Region. Common name. Area of habitat (ha.) in the Region. Linear reef + spur & groove. Patch reef. Colonized pavement. 135. 38. Royal Gramma. 197.505. NS 1. Blue Chromis. 480.060. NS. Bluehead Wrasse. 312.525. NS. NS. Red Lip Blenny Blackbar Soldier Blue Tang. 89. Col. pavement + sand channels. Scattered rock & coral. Total population estimate. 1.234. 335. NS. 362.796. 246.560. 806.861. NS. 3.584.770. 42.880. 4.107.710. 3.858.718. 2.680.335. 6.851.578. 0. NS. NS. 0. 142.710. 142.710. 95.040. NS. NS. 254.204. 73.030. 422.274. 14.985. NS. NS. 62.934. 31.490. 109.409. Neon Wrasse. 102.465. NS. NS. 619.468. 47.235. 769.168. Rock Beauty. 2.565. NS. NS. 37.020. 27.135. 66.720. Yellowhead Jawfish. 0. NS. NS. 805.802. 0. 805.802. French Angel. 0. NS. NS. 11.106. 12.395. 23.501. Gray Angel. 0. NS. NS. 0. 0. 0. Spanish Hogfish. 9.990. NS. NS. 39.488. 18.760. 68.238. 120.015. NS. NS. 317.138. 24.790. 461.943. Sharpnose Puffer. 29.970. NS. NS. 123.400. 38.190. 191.560. Yellowtail Hamlet. 4.995. NS. NS. 11.106. 0. 16.101. Yellowtail Damsel. 0. NS. NS. 11.106. 0. 11.106. Beaugregory. 1. NS = Not Sampled.. within the La Parguera Region. Conversely, these same species were commonly found in Patch Reef habitat of the La Parguera Region, but Patch Reef was not surveyed in the Rincón Region, resulting in estimates of zero population in Patch Reef habitat in the Rincón Region. This artificial insertion of zeros into the database likely results in significant underestimates of population numbers for these species, which include Royal Gramma, Red Lip Blenny, Rock Beauty, French Angel, and Spanish Hogfish. This is consistent with management by Precautionary Principle, however, which provides that conservative impact estimates should be employed in cases where com80. plete data are not available, i.e. it is preferable to overestimate than to under estimate impacts when developing fishery management policy. It is also important to recognize that this survey represents only a “snapshot” in time. Annual reproduction and recruitment dynamics, species behavior, and environmental considerations may place more or fewer fish in these areas at other times of the year or over multi-year periods than may be indicated by a one-time survey. Finally, this survey provided data on only 16 species from a total of 101 captured in the 1998-2000 period in which export records were kept. The species selected for this survey, however, represent the most frequently. Rev. Biol. Trop. (Int. J. Trop. Biol. ISSN-0034-7744) Vol. 56 (Suppl. 1): 65-88, May 2008.
(17) TABLE 8 Mean invertebrate densities by habitat type in the La Parguera Region. Common name. Number of organisms/ha Seagrass. Number of organisms/linear km. Shallow flats. Offshore island mangrove fringe. 0. 716.571. 136. 0. Pink Tip Anemone. 172. 0. 4. 8. Feather Duster. 870. 0. 11. 64. Curly Cue Anemone. 856. 0. 151. 60. Blue Legged Hermit Crab. Flame Scallop. Mainland mangrove fringe. 2. 0. 0. 5. N/A 1. N/A. N/A. N/A. Sea Cucumber. 723. 53.333. 33. 137. Emerald Crab. 41. 34.667. 0. 0. Red Thorn Starfish. 29. 0. 0. 0. 0. 0. 127. 27. Sea Mat. Sunray Anemone Pincushion Urchin. 1.379. 4.444. 69. 4. Carpet Anemone. 322. 0. 278. 7. Bahamas Starfish. 28. 0. 0. 0. Shaving Brush. 25.139. 0. 1. 521. Brittle Starfish. 35. 93.333. 0. 0. Harlequin Serpent Star. 0. 148.889. 0. 0. Long Spine Urchin. 3. 0. 14. 0. Corky Sea Fingers. 518. 0. 0. 0. 1.158. 0. 152. 178. 98. 212.571. 242. 0. Fan Halimeda Red Rock Urchin 1. N/A = Not Applicable.. exported fish such as the Royal Gramma and Yellowhead Jawfish, as well as the species less frequently exported by virtue of their smaller populations, such as the French and Gray Angelfish. Invertebrate Species: Comparisons of aggregated population estimates against annualized harvest data are provided in Table 13. The average annual export figures generally represent very small percentages of the very conservatively estimated populations. determined in this survey. Export of only three species represented more than 1% of the population estimates, namely the Pink Tip Anemone, the Flame Scallop, and the Sunray Anemone. Results concerning the Pink Tip Anemone and the Flame Scallop are somewhat misleading, however, because in both cases primary habitat was not sampled, and their population estimates are certainly low resulting in overstated harvest rates. In the case of the Flame Scallop, its primary habitat was not sampled at all during this. Rev. Biol. Trop. (Int. J. Trop. Biol. ISSN-0034-7744) Vol. 56 (Suppl. 1): 65-88, May 2008. 81.
(18) TABLE 9 Mean invertebrate densities by habitat type in the Boquerón Region Number of Organisms/ha Common Name. Blue Legged Hermit Crab. Seagrass 255. Number of Organisms/Linear Km. Shallow flats. Offshore island mangrove fringe. Mainland mangrove fringe. 666.667. 0. 0. 6. NS 1. 0. 0. 47. NS. 0. 20. Curly Cue Anemone. 6. NS. 0. 0. Flame Scallop. 0. NS. 0. 0. Sea Mat. 2. Pink Tip Anemone Feather Duster. N/A. N/A. 0. 0. Sea Cucumber. 11. NS. 20. 0. Emerald Crab. 2. NS. 0. 0. Red Thorn Starfish. 0. NS. 0. 0. Sunray Anemone. 0. NS. 0. 0. Pincushion Urchin. 4. NS. 0. 0. Carpet Anemone. 0. NS. 0. 0. Bahamas Starfish. 27. NS. 0. 0. Shaving Brush. 55.108. NS. 0. 0. Brittle Starfish. 11. NS. 0. 0. 0. NS. 0. 0. Harlequin Serpent Star Long Spine Urchin. 4. NS. 0. 0. Corky Sea Fingers. 3.950. NS. 0. 0. 29.231. NS. 20. 220. 256. NS. 0. 0. Fan Halimeda Red Rock Urchin 1 2. NS = Not Sampled. N/A = Not Applicable.. Phase II suvey. Dukeman et al. (2005) reported collecting Flame Scallops in rock and coral rubble at 0.5-7.0m depths, where they attach to the hard substrate with their byssal threads. William McMillan (fisher, personal communication) reports that the primary collecting ground for this species is fringing reef front and hard rock boating channel edges at depths of 2.5-25m, with the prime collecting depth being about 6m. All of the Flame Scallops counted in this survey were therefore incidental to the primary population, because only seagrass, shallow flats and mangrove fringe habitat were 82. surveyed. In all cases, Flame Scallops were only noted attached to opportunistic pieces of hard substrate, such as rock or large pieces of debris occasionally found in the seagrass and mangrove fringe habitats. It is also likely that most Flame Scallops occurring in seagrass beds were overlooked, as they tend to attach to the undersides of rocks and debris, which were not examined while swimming over them during belt transects and swimming area searches. All such counts were surface counts only. The 10.8% of the population represented by the fishery harvest in Table 13, therefore, refers. Rev. Biol. Trop. (Int. J. Trop. Biol. ISSN-0034-7744) Vol. 56 (Suppl. 1): 65-88, May 2008.
(19) TABLE 10 Invertebrate population estimates by habitat types in the La Parguera Region. Common name. Seagrass. Shallow flats. Offshore island mangrove fringe. Mainland mangrove fringe. Amount of Habitat. 5.968 ha. 664 ha. 91.065 km. 95.533 km. 0. 475.803.144. 12.390. 0. 475.815.534. Pink Tip Anemone. 1.026.496. 0. 364. 764. 1.027.624. Feather Duster. 5.192.160. 0. 1.002. 6.112. 5.199.274. Curly Cue Anemone. 5.108.608. 0. 13.756. 5.730. 5.128.094. 11.936. 0. 0. 478. 12.414. 1. N/A. N/A. N/A. N/A. Blue Legged Hermit Crab. Flame Scallop Sea Mat. N/A. Total estimate. Sea Cucumber. 4.314.864. 35.413.112. 3.006. 13.084. 39.744.066. Emerald Crab. 244.688. 23.018.888. 0. 0. 23.263.576. Red Thorn Starfish. 173.072. 0. 0. 0. 173.072. 0. 0. 11.570. 2.579. 14.149. Pincushion Urchin. 8.229.872. 2.950.816. 6.286. 382. 11.187.356. Carpet Anemone. 1.921.696. 0. 25.326. 669. 1.947.691. Bahamas Starfish. 167.104. 0. 0. 0. 167.104. Shaving Brush. 150.029.552. 0. 91. 49.756. 150.079.399. Brittle Starfish. 208.880. 61.973.112. 0. 0. 62.181.992. 0. 98.862.296. 0. 0. 98.862.296. Long Spine Urchin. 17.904. 0. 1.275. 0. 19.179. Corky Sea Fingers. 3.091.424. 0. 0. 0. 3.091.424. Fan Halimeda. 6.910.944. 0. 13.847. 16.999. 6.941.790. 584.864. 141.147.144. 22.046. 0. 141.754.054. Sunray Anemone. Harlequin Serpent Star. Red Rock Urchin 1. N/A = Not Applicable.. only to this incidental population, which is in addition to the Flame Scallop’s presumably main populations located elsewhere. Similar considerations relate to populations of the Pink Tip Anemone (Condylactis gigantea), because a primary habitat for this species is the fringing reef (Kaplan 1982, 1988) or forereef (Stoletzki and Schierwater 2005), which were not surveyed in this effort. Therefore, the 1.64% harvest rate indicated in Table 13 only considers a small part of the. overall population of this species. A comprehensive survey of this species would undoubtedly result in a lower harvest percentage. This logic may not apply to results concerning the Sunray Anemone (Actinostella flosculifera, also sometimes referred to as the Collared Sand Anemone), however, because in this case the species’ primary habitat was sampled. The annual harvest rate of 4.24% of the regional population may be more representative than is true of the Pink Tip Anemone and the Flame Scallop.. Rev. Biol. Trop. (Int. J. Trop. Biol. ISSN-0034-7744) Vol. 56 (Suppl. 1): 65-88, May 2008. 83.
(20) TABLE 11 Invertebrate population estimates by habitat types in the Boquerón Region. Common name. Seagrass. Shallow flats. Offshore island mangrove fringe. Mainland mangrove fringe. Amount of Habitat. 6.633 ha. 228 ha. 15.153 km. 40.673 km. Blue Legged Hermit Crab. 1.691.415. 152.000.076. 0. 0. 153.691.491. 39.798. NS 1. 0. 0. 39.798. 311.751. NS. 0. 814. 312.565. Pink Tip Anemone Feather Duster Curly Cue Anemone. Total estimate. 39.798. NS. 0. 0. 39.798. Flame Scallop. 0. NS. 0. 0. 0. Sea Mat. 2. N/A. N/A. N/A. N/A. N/A. Sea Cucumber. 72.963. NS. 304. 0. 73.267. Emerald Crab. 13.266. NS. 0. 0. 13.266. Red Thorn Starfish. 0. NS. 0. 0. 0. Sunray Anemone. 0. NS. 0. 0. 0. 26.532. NS. 0. 0. 26.532. Carpet Anemone. 0. NS. 0. 0. 0. Bahamas Starfish. 179.091. NS. 0. 0. 179.091. Shaving Brush. 365.531.364. NS. 0. 0. 365.531.364. Brittle Starfish. 72.963. NS. 0. 0. 72.963. 0. NS. 0. 0. 0. Pincushion Urchin. Harlequin Serpent Star Long Spine Urchin. 26.532. NS. 0. 0. 26.532. Corky Sea Fingers. 26.200.350. NS. 0. 0. 26.200.350. 193.889.223. NS. 304. 8.954. 193.889.223. 1.698.048. NS. 0. 0. 1.698.048. Fan Halimeda Red Rock Urchin 1 2. NS = Not Sampled. N/A = Not Applicable.. Despite the small harvest rate of 0.38% indicated in Table 13 for the Red Thorn Starfish (Echinaster echinophorus), this species was also probably undercounted. The Red Thorn Star tends to be active nocturnally, and is generally not found in high numbers during daylight hours, when it is said to move into the sheltered interior, and darker, parts of mangrove islands (William McMillan, fisher, personal communication). 84. Because of its importance as a keystone species in coral reef communities, and the effects caused by its catastrophic mass mortality in the early 1980s (Knowlton 2001), the Long Spine Sea Urchin, Diadema antillarum, is worthy of explicit discussion. Table 13 indicates that the annualized harvest of 200 of these urchins represents 0.44% of the regional population. This is, however, overstated in much the same manner as for Flame Scallops. Rev. Biol. Trop. (Int. J. Trop. Biol. ISSN-0034-7744) Vol. 56 (Suppl. 1): 65-88, May 2008.
(21) TABLE 12 Aggregated population estimates vs. fish harvest across La Parguera - Rincón Regions. Common name. La Parguera Population est.. Royal Gramma. 1.969.965. Blue Chromis Bluehead Wrasse Red Lip Blenny Blackbar Soldier Blue Tang Neon Wrasse Rock Beauty. Rincón Population est.. Aggregate Pop. est.. Harvest per annum1. Per cent harvested 2. 806.861. 2.776.826. 15.024. 0.54%. 8.222.108. 4.107.710. 12.329.818. 1.419. 0.01%. 31.000.436. 6.851.578. 37.852.014. 844. <0.01%. 33.597. 142.710. 176.307. 1.366. 0.78%. 1.765.580. 422.274. 2.187.854. 344. 0.02%. 893.241. 109.409. 1.002.650. 868. 0.09%. 1.305.202. 769.168. 2.074.370. 500. 0.02%. 14.294. 66.720. 81.014. 1.263. 1.56%. 195.328. 805.802. 1.001.130. 3.388. 0.34%. French Angel. 20.773. 23.501. 44.274. 513. 1.16%. Gray Angel. 68.330. 0. 68.330. 87. 0.13%. Spanish Hogfish. 54.369. 68.238. 122.607. 716. 0.58%. 1.117.035. 461.943. 1.578.978. 56. <0.01%. Sharpnose Puffer. 853.541. 191.560. 1.045.101. 160. 0.02%. Yellowtail Hamlet. 154.093. 16.101. 170.194. 4. <0.01%. Yellowtail Damsel. 3.574.263. 11.106. 3.585.369. 454. 0.01%. Yellowhead Jawfish. Beaugregory. 1 2. Annualized over 30-month period 1998-2000 (LeGore & Hardin 2002, LeGore et al. 2005). Conservative estimates, see text.. and Pink Tip Anemones, because urchins on fringing and other reefs were not counted during the Phase II invertebrate assessment. This species was observed in these habitats, however, sometimes in very significant numbers, and it is apparent that the harvest rate of 0.44% indicated in Table 13 is overstated, and that the actual rate is significantly lower. Nevertheless, the particular importance of this species and the fact that its populations may still be in postmortality recovery phase, may warrant specific attention. Another species that must be explicitly considered is the Corky Sea Finger (Briareum asbestinum), despite the fact that <0.01% of the regional population is exploited by the current fishery. This species is a gorgonian soft coral,. and the Coral Conservation Act of 1999 explicitly prohibits the taking of any hard or soft coral of any species. Regulation of the fishery for this species, therefore, currently appears to fall outside the purview of fishery management per se, as it is regulated as a component of a specifically protected taxonomic category. It is notable that all specimens of the Bahamas Starfish (Oreaster reticulatus) seen in the Phase II surveys were large adult specimens occurring on shallow grass flats. These specimens are not collected, however, for the marine ornamental fishery, because they are too large to display in most home aquaria. Collected specimens are virtually all 2-4 inches (5-10cm) across from leg tip to leg tip, and are generally found at depths of approximately 8-10m at. Rev. Biol. Trop. (Int. J. Trop. Biol. ISSN-0034-7744) Vol. 56 (Suppl. 1): 65-88, May 2008. 85.
(22) TABLE 13 Aggregated population estimates vs. invertebrate harvest in La Parguera - Boquerón Regions. Common Name. La Parguera Population est.. Boquerón Population est.. Aggregate Pop. est.. Blue Legged Hermit Crab. 475.815.534. 153.691.491. 629.507.025. 18.936. <0.01%. 1.027.624. 39.798. 1.067.422. 17.518. 1.64%. Feather Duster. 5.199.274. 312.565. 5.511.839. 1.550. 0.03%. Curly Cue Anemone. 5.128.094. 39.798. 5.167.892. 1.300. 0.03%. 12.414. 0. 12.414. 1.341. 10.80%. Pink Tip Anemone. Flame Scallop Sea Mat. Harvest per annum1. Per cent harvested 2. N/A. N/A. N/A. 1.594. N/A. Sea Cucumber. 39.744.066. 73.267. 39.817.333. 1.200. <0.01%. Emerald Crab. 23.263.576. 13.266. 23.276.842. 3.155. 0.01%. 173.072. 0. 173.072. 650. 0.38% 2. 14.149. 0. 14.149. 600. 4.24%. Red Thorn Starfish Sunray Anemone Pincushion Urchin. 11.187.356. 26.532. 11.213.888. 600. 0.01%. Carpet Anemone. 1.947.691. 0. 1.947.691. 554. 0.03%. Bahamas Starfish. 167.104. 179.091. 346.195. 300. 0.09%. Shaving Brush. 150.079.399. 365.531.364. 515.610.763. 240. <0.01%. Brittle Starfish. 62.181.992. 72.963. 62.254.955. 4.162. 0.01%. Harlequin Serpent Star. 98.862.296. 0. 98.862.296. 424. <0.01%. Long Spine Urchin. 19.179. 26.532. 45.711. 200. 0.44%. Corky Sea Fingers. 3.091.424. 26.200.350. 29.291.774. 190. <0.01%. Fan Halimeda. 6.941.790. 193.889.223. 200.831.013. 150. <0.01%. 141.754.054. 1.698.048. 143.452.102. 150. <0.01%. Red Rock Urchin 1 2. Annualized from 2002 data (LeGore and Hardin 2002). Conservative estimates, see text.. the transition zone between seagrass and sand habitats (William McMillan, fisher, personal communication). It would appear that the larger brood stock observed during these surveys is not at risk from the ornamental fishery, although impacts by recreational or domestic ornamental collectors may be another matter. One target list species that has not been discussed is the “Sea Mat,” Zoanthus pulchellus, which is a colonial anemone exhibiting carpet-like growth on suitable substrate. It consists of closely packed, or a dense mat, of anemone-like polyps (Meinkoth 1995), and 86. was frequently seen to cover extensive areas. This growth pattern does not lend itself to efficient counting of individual polyps, and because they are a colonial species, defining the term “individual” is problematic in itself. This species is sold in the Puerto Rican ornamental trade not by individual polyps, but as pieces of the “mat,” typically measuring 10-15cm square. The number 1,594 harvested (Table 13) refers to this number of mat pieces. If we assume each piece measures 15cm on a side, then this number represents the harvest of approximately 36m2 of sea mat annually.. Rev. Biol. Trop. (Int. J. Trop. Biol. ISSN-0034-7744) Vol. 56 (Suppl. 1): 65-88, May 2008.
(23) Sea Mat does not occur on all shallow flats in the studied regions, but when it occurs, it is plentiful. One flat on which Sea Mat formed an almost continuous growth over at least 50% of the flat area, located adjacent to Survey Station IP-001, measured >17,000m2. This conservatively represents >8,500m2 of Sea Mat, which dwarfs the 36m2 harvested each year. Other shallow flats in addition to this one were noted to also support significant Sea Mat colonies. These observations indicated that the Sea Mat resource is not jeopardized by the current level of export harvest. Finally, populations of a few species are underestimated because shorthand was sometimes used to record them when their numbers were “Too Numerous To Count,” in which cases the acronym “TNTC” was recorded. When computations were made, the lowest number in the TNTC range was used. For example, if a density for hypothetical species X of >10 organisms/m2 were considered TNTC, then for all subsequent calculations the number 10 would be used, even if in many cases that species actually occurred at higher densities. For Phase II, the following designated densities were used for the TNTC determination: • • • •. Halimeda spp. TNTC = >15/m2 Corky Sea Fingers TNTC = >5/m2 Blue Legged Hermit Crabs TNTC in Quadrat Samples = >100/0.25 m2 Blue Legged Hermit Crabs TNTC while swimming transects = >10/m2. In summary, impacts imposed by the current level of export marine ornamental fisheries in Puerto Rico are low, providing marine resource managers with an excellent opportunity to conceive, develop and implement rational fishery management policy in advance of anticipated growth of this extractive industry. ACKNOWLEDGMENTS The authors thank Craig Lilyestrom of the Puerto Rico DNER, who initiated the. three-phased policy-development program; Jason Gregory of Greystone Consultants who contributed GIS analyses; and Jackie Headrick, also of Greystone, who tabulated and integrated the extensive finfish database. Special thanks go to marine ornamental fishers, Gary Rogers and William McMillan, who provided invaluable background information concerning fishery practices and behavior of target species. Richard Appeldoorn of UPR’s Caribbean Coral Reef Institute managed the contracting process, while Lillian Ramírez Cesaní served as the CCRI Program Manager and Nereida Santiago Morales of the UPR Contracts Office managed contract provisions. All of these contributions were essential to the successful conduct of this effort, and all are appreciated.. Resumen Los esfuerzos recientes para regular la exportación de pesquería ornamental marina en Puerto Rico han tenido que enfrentarse a serios retos relacionados con las lagunas en la información en relación con la naturaleza y el tamaño de las pesquerías, y su impacto. De igual manera, se presenta como un obstáculo las deficiencias en la comunicación entre los administradores de los recursos y los pescadores. Por tanto, los reguladores iniciaron un programa de tres fases, para (1) determinar el número de pescadores, y caracterizar sus métodos y sus exportaciones; (2) estudiar las poblaciones de las especies explotadas; y (3) desarrollar y proponer un manejo apropiado de las pesquerías para aplicar subsiguientemente. Esta presentación resume la recién finalizada segunda fase de este programa, diseñada para generar estimados de las poblaciones de las especies explotadas. El presente estudio evalúa poblaciones silvestres de >20 especies de peces y >20 especies de invertebrados, seleccionadas por la pesquería de exportación para desarrollar los estimados de población mínima y compararlos con las estadísticas de cosecha anual. El conteo de especies en el campo, en distintos tipos de hábitats, estaba correlacionado con los mapas de hábitats de la NOAA, con el fin de generar estimados conservadores de las poblaciones de especies, creando “por lo menos X” totales de población como fueran necesarias para aplicar el Principio Precautorio al desarrollo de políticas de manejo de las pesquerías. Los impactos de las pesquerías ya existentes se encontró que eran bajos; sin embargo, el aumento estable y dramático de la demanda mundial de ornamentales marinos va a continuar ejerciendo una presión económica en el crecimiento de las pesquerías. Por lo tanto, es urgente que se. Rev. Biol. Trop. (Int. J. Trop. Biol. ISSN-0034-7744) Vol. 56 (Suppl. 1): 65-88, May 2008. 87.
(24) tomen decisiones en cuanto al manejo racional de las pesquerías antes de inicio de un crecimiento descontrolado. Palabras clave: pesquerías, ornamentales marinos, manejo de pesquerías, Puerto Rico, Caribe.. Matos-Caraballo, D. 2000. Data entry and analysis of the exportation of marine fishes aquarium trade in Puerto Rico. DNER Fish. Res. Lab. Final Rep. to Carib. Mar. Fish. Mgmnt. Comm. and NOAA. 7 p.. REFERENCES Fox, W.W., Jr. 1999. The role of science in applying the precautionary approach to the MagnusonStevens Fishery Conservation and Management Act. Proceedings, 5th NMFS NSAW. NOAA Tech. Memo NMFS-F/SPO-40. García-Sais, J.R., R. Castro, C. Goenaga, E. Hernández & J. Morelock. 2003. Puerto Rican coral reefs: research synthesis, present threats and management perspectives, p. 111-130 In J. Cortés (ed.).Latin American Coral Reefs. Elsevier Publishers. Hardin, M.P. & R.S. LeGore. 2005. Development of management policy for the export fishery for marine ornamental fish and invertebrates in Puerto Rico. Rev. Biol. Trop. 53 (Suppl. 1): 139-144. Kaplan, E.H. 1982. The Peterson Field Guide Series: Coral Reefs. Houghton Mifflin, Boston, USA. 289 p. Kaplan, E.H. 1988. The Peterson Field Guide Series: A Field Guide to Southeastern and Caribbean Seashores: Cape Hatteras to the Gulf Coast, Florida, and the Caribbean. Houghton Mifflin, Boston, USA. 425 p. Knowlton, N. 2001. Sea urchin recovery from mass mortality: new hope for Caribbean coral reefs? Proc. Nat. Acad. Sci. USA 98: 4822-4824. LeGore, R.S. & M. P. Hardin. 2002. A description of the export fishery for marine ornamental fish and invertebrates in Puerto Rico. Tech. Rep. to Puerto Rico Coral Reef Advisory Committee. Mote Marine Lab. Tech. Rep. 865-M. 41 p. + app. LeGore, R.S., M.P. Hardin, J.R. García-Sais & J.R. Brice. 2004. Protocol development for marine ornamental stock assessment in Puerto Rico. Rep. to U.S. Natl. Ocean. Atmosph. Admin. (NOAA), Natl. Marine Fish. Service, Office Habitat Conserv.; Delivery Order DG133F-03-SE-0950. LeGore Env. Assoc. Tech. Rep. No. 03-105A. 51 p.. 88. LeGore, R.S., M.P. Hardin & D. Ter-Ghazaryan. 2005. Organization and operation of the marine ornamental fish and invertebrate export fishery in Puerto Rico. Rev. Biol. Trop. 53 (Suppl. 1): 145-153.. Meinkoth, N.A. 1995. National Audubon Society Field Guide to North American Seashore Creatures. Alfred A. Knopf, New York, USA. 813 p. Ojeda-Serrano, E., A. Aguilar-Perera & D. MatosCaraballo. 2001. Current status of the wild marine ornamental fish trade in Puerto Rico, In Proceed. 2nd Conf. on Marine Ornamentals; collection, culture, and conservation, Nov. 26-Dec. 1, Lake Buena Vista, Florida, USA. Stoletzki, N. and B. Schierwater. 2005. Genetic and color morph differentiation in the Caribbean sea anemone Condylactis gigantea. Mar. Biol. 147: 747-754. Wood, E. 2001. Collection of coral reef fish for aquaria: global trade, conservation issues and management strategies. Mar. Conserv. Soc. UK. 80 p.. INTERNET REFERENCES Dukeman, A.K., N.J. Blake & W.S. Arnold. 2005. The reproductive cycle of the flame scallop, Ctenoides scaber, from the lower Florida Keys and its relationship with environmental conditions. J. Shellfish Res. Aug, 2005. See: http://www.findarticles.com/p/ articles/mi_m0QPU/is_2_24/ai_n15380342 Griego, H. 2004. Ocean policy in the 21st century: evaluating the U.S. Commission on Ocean Policy and the Pew Oceans Commission. See: http://72.14.203.104/ search?q=cache:5ZDFAKi4jr4J:www.akmarine.org/ pressroom/USCOP-Pew%25209-23-04.pdf+Precaut ionary+Principal+NOAA&hl=en&gl=us&ct=clnk& cd=1 NOAA. 2002. Benthic habitats of Puerto Rico and the U.S. Virgin Islands. U.S. Natl. Ocean. Atmosph. Admin. (NOAA), NCCOS Biogeog. Prog. Silver Springs, MD USA. (Also see on-line: http://biogeo.nos.noaa. gov/products/benthic/.. Rev. Biol. Trop. (Int. J. Trop. Biol. ISSN-0034-7744) Vol. 56 (Suppl. 1): 65-88, May 2008.
(25)
Figure

+2

Documento similar
The expansionary monetary policy measures have had a negative impact on net interest margins both via the reduction in interest rates and –less powerfully- the flattening of the
The incidence and prevalence of these diseases are increasingly globally, and although more research is needed to elucidate its role in pathologies such as atrial
In the “big picture” perspective of the recent years that we have described in Brazil, Spain, Portugal and Puerto Rico there are some similarities and important differences,
In this study, we analyzed the relationship between sex ratio, size distribution, mortality, and slope aspect of a population of Bursera fagaroides (Burseraceae) growing in a region
of common healthcare services (polypharmacy, visits to the primary care physician or medical specialist, and hospitalization) in the older population in Spain.. This information is
In recent years, photometric redshift galaxy surveys have arisen as powerful probes of the Large Scale Structure (LSS) of the Universe and dark energy.. The Dark Energy Survey (DES)
aspect of the three habitat types (drove road, adjacent matrix and distant 142 .. matrix) were similar in
The clo- sure is quantified by comparing the predicted event counts in MC simulation to those found in data in a ‘validation region’, defined as the region containing the events with
