ISSN: 2254-7088
148
The role of confidence in the evolution of the
Spanish economy: empirical evidence from an
ARDL model
Pablo Castellanos-García, Universidade da Coruña
Indalecio Pérez-Díaz-del-Río, Universidade da Coruña
Jose Manuel Sánchez-Santos, Universidade da Coruña
Abstract
The aim of this paper is to verify the existence and to determine the nature of long-term relationships between economic agents’ confidence, measured by the Economic Sentiment Index (ESI), with some of the "fundamentals" of the Spanish economy. In particular, by modeling this type of relations, we try to determine whether confidence is a dependent (explained) or independent (explanatory) variable. Along with confidence, in our model we incorporate variables such as risk premium of sovereign debt, financial market volatility, unemployment, inflation, public and private debt and the net lending/net borrowing of the economy. For the purpose of obtaining some empirical evidence on the exogenous or endogenous character of the above mentioned variables an ARDL (Autoregressive-Distributed Lag) model is formulated. The model is estimated with quarterly data of the Spanish economy for the period 1990-2012. Our findings suggest that: (a) unemployment is the dependent variable, (b) there is an inverse relationship between ESI in Spain and unemployment; and (c) the Granger causality goes from confidence to unemployment.
JEL classification
C22; D84; E37.
Keywords
149
Introduction
The so-called confidence crisis, understood as a sharp deterioration in expectations and a dramatic increase in economic uncertainty, has been usually considered as a factor playing a key role in the last global crisis in most of the peripheral economies. One of the main reasons that explain that role has to do with the fact that confidence is a variable that contains qualitative information which directly measures the expectations of economic agents. These expectations, through their impact on decisions of consumption, saving, credit, investment, etc., can exert a significant influence both in the state of the economy and in financial stability.
The role of confidence in promoting economic activity has received considerable academic attention by social scientists. Among early economic researches addressing the role played by confidence indicators in the real economy and economic fluctuations can be mentioned Fuhrer (1993), Matsusaka and Sbordone (1995), Golinelli and Parigi (2004), Ludvigson (2004) and Taylor and McNabb (2007). Some other authors also provide empirical evidence supporting the influence of sentiment of investors on aggregate corporate investments (Arif and Lee, 2014), stock market developments (Otoo, 1999; Jansen and Nahuis, 2003; Lee et al., 2002), market price of risk (Verma and Soydemir, 2009), yield spreads (Ferreira et al. 2008), stock market reaction to monetary policy (Kurov, 2010) and even on the probability of future financial distress (Mishkin, 1978).
Confidence indices are statistical tools that are obtained on a regular basis in order to know, through sampling, perceptions of individuals (consumers or businesses) on the state of the economy, their own economic situation and their expectations in the medium and long term.1 For this reason, confidence indices are usually
considered as leading indicators that could somehow incorporate "advanced" information in relation with the one facilitated through national accounts and/or macroeconomic data. In this sense, a large number of papers have investigated the predictive capacity of survey data for consumer spending or output. For instance, Carroll et al. (1994) and Easaw et al. (2005) investigate the predictive power of consumer confidence or sentiment and its usefulness as a forecast of the growth of households consumption. In a similar line, Claveria et al. (2007) analyse the possibility of improving the forecasts for some selected macroeconomic variables for the euro area using the information provided by business and consumer surveys.
Beyond the explanatory and predictive power of confidence indicators, it is important to take into account that the behaviour of this variable in turn might also be conditioned by the evolution of macroeconomic data. Some authors as Vuchelen (1995) seek for determinants of economic agents’ sentiment in macroeconomic data. Particularly, this author focuses on the influence of political events in consumer confidence. Ghonghadze and Lux (2012) examine the dynamics of European Union Economic Sentiment indicator, providing some evidence about the appropriate modelling of expectations formation. In this sense, as Katona (1951, 1975) argues, it should be taken into account that the consumer sentiment contains information that cannot be deduced from economic and financial variables.
In this paper our aim is to shed some light on the nature of the relationship between confidence and some "fundamentals" of the Spanish economy, namely unemployment, inflation, levels of public and private debt and net lending/net
1 Due to the extreme complexity of measuring such a subjective dimension as confidence is, any
150
borrowing capacity of the economy. In particular, modeling this type of relations, we try to determine whether confidence is a dependent (explained) or independent (explanatory) variable. This is a key issue, mainly because if confidence is an independent variable, the policy maker should focus on the effects of that variable on the macroeconomic performance. Once identified those effects, the efficiency of economic policies could be improved considering their influence on the confidence indices. We use as a "proxy" of the confidence the Economic Sentiment Indicator (hereinafter, ESI) elaborated by the European Commission for the region as a whole, for its constituent economies, and by type of economic activity. This is a composite indicator that reflects and represents judgments and attitudes of producers and consumers. This indicator incorporates information from both the confidence and perception that the different sectors of the economy have about the current economic situation well as its future expectations.
Particularly, with the purpose of dealing with the role of confidence in the evolution of the Spanish economy, we develop an empirical analysis in three steps. First, we try to verify whether confidence is explained by economic fundamentals or whether, by contrast, it should be considered as an exogenous variable. Secondly, once identified the existence of a long-term relationship between economic fundamentals and confidence through a cointegration analysis, it is discussed how the dependent variables react to changes in the regressors, both in the short and long term. This discussion is based on the empirical evidence derived from an ARDL (Autoregressive-Distributed Lag) model that is estimated with quarterly data of the Spanish economy for the period 1990-2012. Finally, we establish the direction of the causality between variables through Granger causality tests.
The rest of the paper is organised as follows. The second section describes in detail the variables and the data set. The empirical methodology and the main results are discussed in the third section. Finally, the fourth section summarises the conclusions.
Variables and data
In order to carry out our empirical analysis we consider two subsets of variables. On the one hand, we include qualitative variables proxying the economic agents’ confidence (Economic Sentiment Index), the perception of risk (risk premium of sovereign debt) and the levels of uncertainty (volatility of financial markets). On the other hand, we consider some macroeconomic variables reflecting the Spanish economic fundamentals (unemployment, inflation and debt). The sample on which our empirical analysis is based consists of quarterly data for the above-mentioned variables covering from the fourth quarter of 1990 to the second quarter of 2012, which represents a sample size of 87 data.
Table 1. Descriptive statistics and data sources
Variables Max. Min. Mean SD URL
Pri_Deb 226.87 71.32 135.04 58.90 www.bde.es/webbde/es/estadis/infoest/bolest3.html Pub_Deb 75.95 35.48 54.15 10.14 www.bde.es/webbde/es/estadis/infoest/htmls/cdp.html
ESI_Sp 114.70 73.93 99.74 10.12 ec.europa.eu/economy_finance/db_indicators/surveys/time_series/index_en.htm Inf 6.73 -1.07 3.37 1.51 www.bde.es/webbde/es/estadis/infoest/indeco.html Unem 24.63 7.95 16.22 5.32 www.bde.es/webbde/es/estadis/infoest/sindi.html
Spr 5.66 0.01 1.51 1.71 www.bde.es/webbde/es/estadis/infoest/indeco.html Bor_Cap 2.40 -11.00 -3.18 3.18 www.bde.es/webbde/es/estadis/infoest/indeco.html
VIX 58.60 11.03 20.49 7.68 www.cboe.com/micro/vix/historical.aspx
Table 1 shows the detail of the main descriptive statistics of the variables. As we mentioned before, the ESI is a composite index published on a monthly basis2
2 The compilation of statistics on the ESI is part of the Joint Harmonised EU Programme of Business
151
made up of five sectorial confidence indicators with different weights: industrial confidence indicator (40%), service confidence indicator (30%), construction confidence indicator (5%), consumer confidence indicator (20%) and retail trade confidence indicator (5%). Confidence indicators are seasonally adjusted data obtained from a survey with specific questions for each sector.
ESI values are derived from qualitative questions about current and future behaviour of economic agents. In this sense, the confidence indicator is calculated for each sector as an arithmetic mean of the responses (seasonally adjusted) to specific questions related to a reference variable whose trajectory is tried to be anticipated (e.g. industrial production in the case of the industrial confidence indicator). The responses from the surveys are added as "balances" which are calculated as the differences between the percentages of respondents who provided positive and negative responses. In numerical terms, the ESI is calculated as an index value with an average of 100 and a standard deviation of 10 for a given sampling period. Indicators for each of the sectors would be added in the so-called ESI. In this study, since all other variables are expressed quarterly, we proceeded to calculate a quarterly value of ESI of Spain to make the appropriate econometric tests, denoted as ESI_Sp.
The Chicago Board Options Exchange Market Volatility Index, also known as VIX, is an index that measures the price volatility of the options on the Standard & Poors 500 index (SPX). This index is considered a benchmark for measuring market volatility, collecting in an indirect way the "feeling" of agents operating in it. When volatility is high, the VIX reaches a high figure and correlates with falls of S&P 500, pointing out that there is fear and pessimism in the market, while a minimum VIX reflects in an atmosphere of optimism and confidence. In sum, the VIX is an indicator that provides information on feelings, perceptions or expectations for the future. We incorporate this index in our empirical analysis because it has recently gained acceptance as a summary indicator of global uncertainty or financial stress. In this line, authors such as Bloom (2009), show that the VIX is strongly correlated with measures of uncertainty, including from financial variables. This lends support to its use as a measure of global financial stress. Since this indicator is calculated on a daily basis, it has proceeded to get its correspondent quarterly value.
The yield spread of Spanish and German government bonds, also known as risk premium or spread (hereinafter, Spr) was calculated as the difference between the Spanish and German government bonds yield to ten years in domestic markets. Theoretically speaking, a high risk premium would show lack of confidence in the possibilities of an economy to pay its public debt. From this perspective, the risk premium can be considered as an extra compensation demanded by investors for holding an asset that involves not only a predictable and measurable risk (specific to the economy in question), but also an uncertainty component difficult to quantify. In this sense, the German long-term debt is used widely as a proxy for the return of a risk-free asset and, consequently, their differential with respect to the bond yields of other Eurozone economies is considered as a measure of default risk associated with the sovereign debt of a country. This spread is also obtained on a daily basis and was transformed quarterly for the study using an arithmetic mean.
These three variables (the ESI_Sp, the VIX and the spread) have in common (each in its field, with its own characteristics) that they collect qualitative information on the economy in relation to the “sentiment”, the state of opinion or expectations of the economic agents whose decisions determine the economic progress of the country.
Among the fundamentals of the Spanish economy we incorporate to our analysis the following ones:
152
or interpreted as such, for future economic conditions as well as for uncertainty surrounding these conditions.
· Inflation rate (Inf). Since the inflation rate used in this paper will be the rate or percentage change in the CPI Spain general variable provided monthly, series has been transformed on a quarterly basis in order to allow comparison with other variables.
· Private debt (Pri_Deb). Households and private nonfinancial corporations debt has been growing steadily over the time period analysed and it could be used as a proxy of the internal solvency of the private sector in a country. The value of the Spanish private debt used in this research is the result of adding loans to households and non-profit institutions plus loans to non-financial corporations. · Public debt (Pub_Deb). The value of Spanish government debt is the result of
adding the debt of the central government, the regional governments, the social security administrations and the local corporations. That is, the debt embodied in cash and deposits, debt securities and loans, in nominal value and consolidated. This series is relativised by the Spanish GDP series referenced in the Bank of Spain for the calculation of public debt following the Excessive Deficit Procedure (EDP).
· Borrowing capacity (Bor_Cap). It is the sum of the value of the current account balance plus the capital account balance (calculated on a quarterly basis) in proportion to GDP. This ratio has a remarkable economic importance, as it measures in relative terms the borrowing capacity of Spain in relation to other countries.
Empirical methodology and results
Description of method
In an auto-regressive distributed lag (ARDL) model, the variable of interest is assumed to be a function of the past values of itself (auto-regressive) and the current and past values of other variables (distributed lag).
The basic form of an ARDL regression model, denoted ARDL (p, q), is:
yt = β0 + β1 yt-1 + … + βk yt-p + α0 xt + α1 xt-1 + … + αq xt-q + εt (1)
where y is the dependent variable, x is an explanatory variable and εt is a random disturbance term, which we assume is “well-behaved” in the usual sense.
The ARDL/Bounds testing methodology of Pesaran et al. (2001) has some advantages over conventional cointegration testing. For instance, it can be used with a mixture of I(0) and I(1) data; it involves just a single-equation setup, making it simple to implement and interpret; different variables can be assigned different lag lengths as they enter the model.
153
Unit root tests
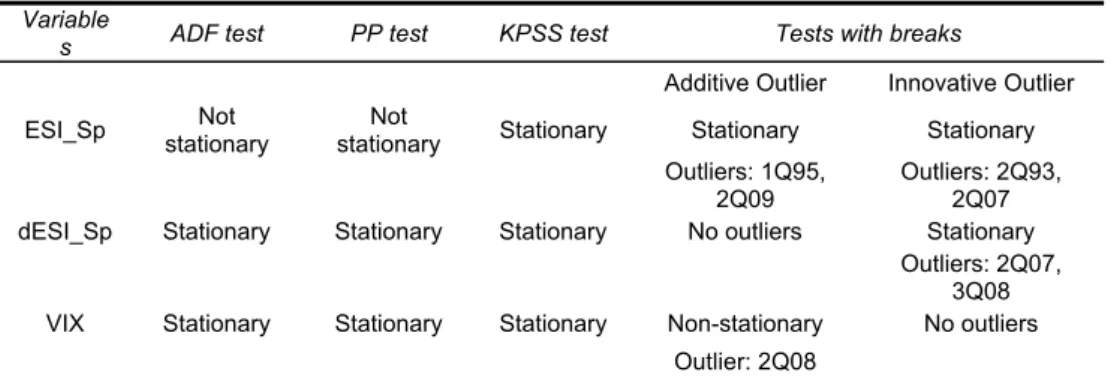
Taking into account that only I(0) and I(1) variables can be included in an ARDL model reflecting the relationships between confidence and some of the fundamentals of the Spanish economy, unit root tests are performed. In this sense Perez et al (2013) provide evidence of the existence of a unit root for variables such as public debt/GDP, private debt/GDP, inflation rate, unemployment rate, borrowing capacity/GDP and Spain vs German yield debt spread. In this paper we complete the analysis developing unit root tests to check the order of integration of ESI_Sp and the VIX. According to the results of unit root tests, ESI_Sp and VIX are stationary variables (Table 2).
Table 2. Results of unit root tests Variable
s ADF test PP test KPSS test Tests with breaks
Additive Outlier Innovative Outlier
ESI_Sp stationary Not stationary Not Stationary Stationary Stationary Outliers: 1Q95,
2Q09
Outliers: 2Q93, 2Q07 dESI_Sp Stationary Stationary Stationary No outliers Stationary
Outliers: 2Q07, 3Q08 VIX Stationary Stationary Stationary Non-stationary No outliers
Outlier: 2Q08
Ho: Existence of a unit root except KPSS (H1 is the existence of unit root). Level of significance = 5%. BIC criterion in the ADF test.
More specifically, Augmented Dickey-Fuller (ADF), Phillips-Perron (PP) and Kwiatkowski-Phillips-Schmidt-Shin (KPSS) tests results clearly show that the VIX is a stationary variable. In relation to ESI_Sp, although ADF and PP tests identify this variable as I(1), unit root with structural breaks tests reveal that I(0) would be its correct order of integration. Details of the procedures and tests performed can be obtained at Perez et al (2013).
PSS test results.
Bound or Pesaran, Shin and Smith (PSS) tests are conducted with the aim of establishing whether the variables incorporated in the model have to be considered as exogenous or endogenous. The abovementioned results of unit root tests allow us to claim that all the considered variables meet the requirements for their inclusion in a bound test.
These tests are implemented making use of relevant alternative statistics F and t and considering a maximum of four lags (Pesaran and Pesaran, 1997). The variables considered in the implementation of F and t tests are private debt/GDP (Pri_Deb), public debt/GDP (Pub_Deb), ESI Spain (ESI_Sp), inflation (Inf), unemployment rate (Des), risk premium (Spr), borrowing capacity/GDP (Bor_Cap) and VIX (VIX).
154
Table 3. Results of bound tests or PSS
Dependent variable of the
model Regressors of the model F test t Test Pri_Deb Pub_Deb, ESI_Sp, Inf, Unem, Spr, Bor_Cap, VIX 1.6684 - Pub_Deb Pri_Deb, ESI_Sp, Inf, Unem, Spr, Bor_Cap, VIX 4.2775 -
ESI_Sp Pri_Deb, Pub_Deb, Inf, Unem, Spr, Bor_Cap, VIX 2.3978 -1.9748 Inf Pri_Deb,Pub_Deb,ESI_Sp, Unem, Spr, Bor_Cap, VIX 1.6891 - Unem Pri_Deb,Pub_Deb,ESI_Sp, Inf, Spr, Bor_Cap, VIX 4.8347 -
Spr Pri_Deb,Pub_Deb,ESI_Sp, Inf, Unem, Bor_Cap, VIX 3.6413 -1.9827 Bor_Cap Pri_Deb,Pub_Deb,ESI_Sp, Inf, Unem, Spr, VIX 1.4470 -
VIX Pri_Deb,Pub_Deb,ESI_Sp, Inf, Unem, Spr, Bor_Cap 5.0427 - Critical values
Pesaran et al.
(2001) F Test t Test
I(0) I(1) I(0) I(1)
10% 2.035 3.153 -2.57 -4,23
5% 2.365 3.553 -2.86 -4,57
1% 3.027 3.233 -3.46 -5,19
Critical values
Narayan (2005) F test
I(0) I(1)
10% 2.129 3.289
5% 2.476 3.746
1% 4.296 4.760
Following Pesaran et al. (2001) in cases in which F tests are not conclusive we apply a t test. According to the results reported in Table 3, in the model in which the ESI of Spain is included as dependent variable, the null hypothesis of the absence of a cointegration relationship between the variables could not be rejected. Therefore, ESI_Sp should not be considered as dependent variable. In summary, according to F and t tests, the ARDL could be applicable in models in which the public debt/GDP, unemployment rate or the VIX were dependent variables.
Estimation of an ARDL model
Generally speaking, an ARDL is a general–to-specific approach that allows to include all the variables that a priori may influence the behaviour of a dependent variable and later on it reveals which ones are relevant and which are not. Thus it minimises the probability of omitting relevant variables, a problem that would be more serious than to include irrelevant variables (Hendry and Ericsson, 1991). Moreover, it allows for the use of variables without a prior knowledge of their order of integration and, therefore, facilitates the joint inclusion of both I(0) and I(1) variables (Sultan, 2010). Finally, the formulation of this model will offer also an insight into the short and long term behaviour of the variables, estimating the speed of adjustment of the dependent variable to a long-run equilibrium after a shock in the independent variables.
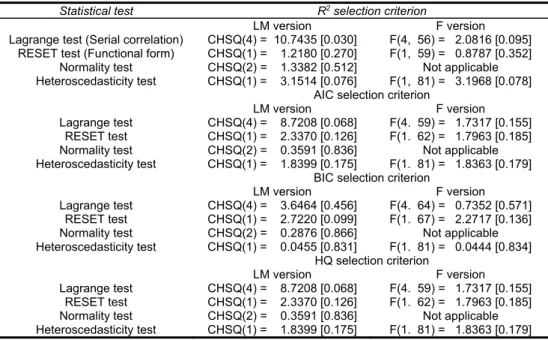
In our particular case, the ARDL model is formulated with each of the dependent variables that the bound test indicated as significant for the case of four lags: unemployment, public debt/GDP ratio and VIX.
The formulation of the ARDL when the public debt/GDP is incorporated as dependent variable shows problems of serial autocorrelation, lack of significance and instability of long term coefficients. The specification with the VIX as dependent variable reveals serial autocorrelation, incorrect functional form, non- normality and heteroscedasticity in the residuals which lead us to reject this formulation.
155
Table 4. Diagnostic tests considering unemployment rate as dependent variable
Statistical test R2 selection criterion
LM version F version
Additionally, Cusum and CusumQ stability tests did not reflect instability of long-run coefficients of the variables.
Thus, after the completion of these tests, the general ARDL model would be established as follows:
where all the variables have been previously defined. t corresponds to the random
disturbance, 0 is the intercept of the equation and i i, i, i, i,i, i and i
correspond to the coefficients of the regressors (including lags of the dependent variable).
The corresponding ARDL models are selected taking into account four criteria, namely, the R2, the Akaike Information Criterion (AIC), the Schwarz Bayesian
Information Criterion (BIC) and the Hannan-Quinn Information Criterion (HQ), and setting a maximum of 4 lags as previously indicated.
156
Table 5. Number of lags to be considered for each criterion and for each variable Nº lags Unem Pri_Deb Pub_Deb ESI_Sp Inf Spr Bor_Cap VIX
R2criterion 3 3 0 4 0 0 3 2
AIC 3 2 0 4 0 0 3 0
BIC 3 2 0 0 0 0 2 0
HQ criterion 3 2 0 4 0 0 3 0
Long and short term models
If two of more variables are cointegrated, two types of models can be estimated. First, an OLS regression model using the levels of the data. This model will provide the long-run equilibrating relationship between the variables. Second, and error-correction model (ECM), estimated by OLS too, but using the differences of the data. This model will represent the short-run dynamics of the relationships between the variables.
Once established the existence of a long-term relationship between the variables through the bound test, the ARDL model allows us to analyse relationships in both the long and short term.
Long-term model
The coefficients of the long-term model obtained for each of the estimations are shown in Table 6:
Table 6. ARDL coefficients in the long term model
Variable R2 criterion AIC BIC
Pri_Deb -0.0537***
(-4.7174) -0.5621*** (-4.1903) (-1.1052) -0.0422 Pub_Deb 0.3316***
(5.2437)
0.3233*** (4.3905)
0.1139 (0.4779) ESI_Sp -0.5347***
(-5.8873) -0.5976*** (-5.3191) -1.1600*** (-1.9309)
Inf -0.8710**
(-3.3095)
-0.8841** (-2.9335)
-1.6693 (-1.5124)
Spr 0.4548
(1.2591)
0.5723 (1.3861)
0.9490 (0.8149) Bor_Cap -0.9932**
(-3.2426) -1.0212** (-2.8412) (-0.9740) -1.0300
VIX 0.0191
(0.3307)
0.0805 (1.4517)
0.2818 (1.2228) C 59.4954*** (6.2485) 65.1116*** (5.5120) 132.1281** (2.0086)
* indicates significance at 10%, ** at 5% and *** at 1%. In brackets, values of the t statistic
The signs of the numbers in Table 6 show the kind of long term relationship that each of the regressors has with the dependent variable, i.e., the unemployment rate (Unem). From their analysis we can draw the following preliminary evidences previously to the results of the causality tests that will be commented later.
-The only variable that is significant in all four criteria is the confidence measured through the Economic Sentiment Indicator in Spain. In this sense we could confirm that increases in the confidence are associated with decreases in the level of unemployment in this country.
-Neither risk premium nor VIX volatility are significant variables in any of the criteria considered, that is, neither the yield of Spanish debt versus German debt nor VIX should be considered as regressors when determining long-term unemployment in Spain.
Short term model
157
ECM, allows us to analyse the impact of a "shock" on the variables of the model as well as the adjustment time needed to return to a situation of equilibrium. This model can be expressed as follows:
t
where et-1 is the error correction lagged one period, t
corresponds to the random
disturbance, 0 is the intercept of the equation and ii, i, i, i,i, i and i
are
the coefficients of the regressors (including lags of the dependent variable). First of all, in order to use the results of the estimation, we have to check both the significance of the error correction lagged one period, et-1, and its sign, which has
to be negative (see table 7). Note that the coefficient of the lagged residual in the ECM shows the speed of adjustment towards the equilibrium following a shock to the syste.
Table 7. ARDL coefficients in the short term model (ECM)
Variable R2 criterion AIC BIC
* indicates significance at 10%, ** at 5% and *** at 1% level respectively. In brackets, values of the t statistic
As regards the qualitative variables on which we focus, the estimated coefficients of the ECM show the following results. The ECM is valid as the error correction term is significant and negative in the three criteria. In the short term, increases in confidence measured through ESI_Sp have a positive relationship with the decrease in the unemployment rate in Spain, according to all criteria. As in the long term, spread has no significant result with any of the criteria, in the short term. The VIX index only appears as significant according to the BIC criterion, showing in this case a positive relationship with the unemployment rate.
158
significant variable neither in the short nor in the long run with any of the criteria used.
For the shake of simplicity, Table 7 really does not include all the estimates of the short-run models, we only included the first term of the lag polynomial of each variable and the error correction term.
Confidence-Unemployment: results of the causality test
Taking into account that the results of the cointegration tests (which check if there is a long-term relationship between the variables) are not sufficient and at the same time they are necessary to determine the existence of causality in the Granger sense, we proceeded to perform causality tests applying Toda and Yamamoto (1995) procedure to test for Granger causality – this procedure is applicable in situations where not all the variables are stationary, as it is the case here.
The information criteria suggest that we should have a maximum lag length of 3 for each variable. The application of the LM test for serial independence against the alternative of AR(k)/MA(k), for k = 1, …, 12 shows that there is no problem using 3 lags (serial correlation is removed). Johansen’s Trace Test and Maximum Eigenvalue Test both indicate the presence of cointegration between the two series, at the 5% level. As m (maximum order of integration of these two variables) is 1, we re-estimated the VAR levels with one extra lag of each variable in each equation and we undertook the Granger non-causality testing. According to the results of this procedure, we cannot reject the null hypothesis of no causality from Unem to ESI_Sp. Furthermore, the null hypothesis of no causality from ESI_Sp to Unem can also be rejected at the 1% significance level.
Thus, a causal link between the two variables is found, that is, increases in the confidence in the economy causes decreases in the level of unemployment in a country and not vice versa. The confidence measured by the ESI seems to cause reductions in the unemployment rate: i.e. a qualitative magnitude linked to expectations as mentioned earlier in this paper, would play a key role in the activation of the labour market. This result would come to endorse the idea that the degree of confidence or "feeling" about the economic situation which the different economic actors have is fundamental in the evolution of unemployment. Therefore, in a situation of increased confidence in the present and future state of the economy, more employees would be hired, whereas worse expectations on the economic situation in the future would reduce employments (increasing the unemployment accordingly).
Although this study does not conclude that the confidence is the only or the most important variable to consider in a model explaining the evolution of unemployment in the Spanish economy, the results obtained show that the influence of "qualitative" factors such as confidence directly impacts on the economic sentiment and causes a decrease in the level of unemployment.
4. Conclusions
The relationship between economic agents’ confidence and the real economy is a subject of great interest to policymakers. On the one hand, confidence, insofar as it affects economic choices of consumption, saving, investment, etc., exerts an influence on both the current state of the economy and on the perspectives of economic growth. At the same time, the behaviour of confidence indices may also be conditioned by the evolution of certain economic and financial indicators.
159
borrowing capacity/GDP) along with other variables that contain qualitative and prospective information measuring the expectations of the economic agents (confidence, risk premium and market volatility).
With the aim of determining the existence of long-term relationships between confidence and some of the fundamentals of the Spanish economy and of exploring the nature of these relationships, we have developed a three step process. First, the application of a bound test for studying the relationship between the variables considered in the analysis enables us to identify unemployment as the dependent variable in a cointegration model that includes the aforementioned variables. Second, we have specified an ARDL, which incorporates both lagged independent variables and the lagged dependent variable (the unemployment rate) as regressors. Among the most relevant results shown by the estimated ARDL model it can be emphasised that the yield spread of Spanish public debt (risk premium) has no significant impact on the unemployment rate. This model also reveals that the ESI of Spain is a variable that shows an inverse relationship with the level of unemployment, that is, ESI_Sp increments are closely associated with long-term unemployment decreases and vice versa. Additionally, the results obtained from the MCE show that increases in the confidence measured by the ESI_Sp have a positive relationship with the decrease in the unemployment rate in Spain also in the short term. Finally, since the existence of a long-term relationship is a necessary but not sufficient condition for the existence of causality, we also proceeded to analyse the relationship between unemployment and confidence through a test of Granger. This test shows unidirectional Granger causality from ESI_Sp towards the unemployment rate for the case of four lags.
These results lead us to consider the confidence as a variable with a long-term relationship and that causes unemployment in the Granger sense. This is a result that does not fully explain the behaviour of the unemployment rate variable (whose evolution is also due to other factors), but it would emphasise the importance of a qualitative variable such as the confidence of economic agents in relation to job creation.
Furthermore, this finding corroborates the importance of the role played by confidence in the Spanish economy. On the one hand, the existence of this causality justifies the need of including the confidence in macroeconomic models that seek to explain the evolution of unemployment in Spain. On the other hand, policy implications also emerge from the results obtained, which highlight the importance of implementing economic policies that encourage confidence among economic agents if the ultimate goal is to reduce unemployment. Thus, empirical evidence reveals that one of the criteria to be considered when evaluating economic policy decisions would be their influence on confidence.
References
Arif, Salman and Charles M.C. Lee (2014) `Aggregate Investment and Investor Sentiment´, The Review of Financial Studies 27(11): 3241-3279.
Bloom, Nicholas (2009) ‘The Impact of Uncertainty Shocks’, Econometrica 77(3): 623–68
Carroll, Christopher D., Jeffrey C Fuhrer and David W. Wilcox, (1994) `Does Consumer Sentiment Forecast Household Spending? If So, Why?´ American Economic Review 84 (5): 1397-1408.
Chicago Board Options Exchange (2014) Introduction to VIX Options and Futures, URL (consulted Nov. 2014): http://www.cboe.com/micro/VIX/vixintro.aspx
160
Dominitz, Jeff and Charles F. Manski (2004) ‘How should we measure consumer confidence?’, Journal of Economic Perspectives 18(2): 51-66.
Easaw, Joshy Z., Dean Garratt and Saeed M. Heravi, (2005) `Does consumer sentiment accurately forecast UK household consumption? Are there any comparisons to be made with the US?´, Journal Macroeconomics 27(3): 517-532. European Commision (2004) `The Joint Harmonised EU Programme of Business and Consumer Surveys. User Guide´. Directorate-General for Economic and financial affairs, Brussels, URL (consulted Nov.2014):
http://ec.europa.eu/economy_finance/db_indicators/surveys/documents/bcs_user_ guide_en.pdf
European Council (2009) Council Regulation (EC) No 479/2009, Official Journal of the European Union, URL (consulted Nov. 2014): http://epp.eurostat.ec.europa.eu/cache/ITY_SDDS/Annexes/ei_naga_a_esms_an2 .pdf
Ferreira, Eva, Maria I. Martínez, Eliseo Navarro and Gonzalo Rubio (2008) `Economic Sentiment and Yield Spreads in Europe´, European Financial Management 14(2): 206-221.
Fuhrer, Jeffrey C. (1993) `What Role Does Consumer Sentiment Play in the U.S. Economy?´ Federal Reserve Bank of Boston New England Economic Review, January-February: 32-44.
Ghonghadze, Jaba and Thomas Lux (2012) `Modelling the dynamics of EU economic sentiment indicators: an interaction-based approach´, Applied Economics 44(24): 205-3088.
Golinelli, Roberto and Giuseppe Parigi (2004) `Consumer Sentiment and Economic Activity. A Cross Country Comparison´, Journal of Business Cycle Measurement and Analysis 10(2): 147-170.
Granger, Clive.W.J. (1969) `Investigating causal relationships by econometric models and cross spectral methods´, Econometrica 37(3): 425-435.
Hendry David F. and Neil R. Ericsson (1991) `Modeling the Demand for Narrow Money in the United Kingdom and the United States´, European Economic Review 35(4): 833-866.
Jansen, Jos W. and Niek J. Nahuis. (2003) `The stock market and consumer confidence: European evidence´, Economics Letters 79(1): 89-98.
Katona, George (1951) Psychological analysis of economic behavior. New York: McGraw-Hill (reprinted 1977).
Katona, George (1975) Psychological economics. Amsterdam: Elsevier.
Kurov, Alexander (2010) `Investor sentiment and the stock market’s reaction to monetary policy´, Journal of Banking & Finance 24(1): 139-149.
Lee, Wayne Y., Christine X. Jiang and Daniel C. Indro (2002) `Stock market volatility, excess returns, and the role of investor sentiment´, Journal of Banking & Finance 26(12): 2277-2299.
Ludvigson, Sydney C. (2004) `Consumer Confidence and Consumer Spending´, The Journal of Economic Perspectives, 18(2): 29-50.
Matsusaka, John G. and Argia M. Sbordone (1995) `Consumer Confidence and Economic Fluctuations´ Economic Inquiry 33 (2): 296-318
Mishkin, Frederic S. (1978) `Consumer Sentiment and Spending on Durable Goods´, Brookings Papers on Economic Activity 1: 217-232.
161
Otoo, María (1999) `Consumer sentiment and the stock market´, Board of Governors of the Federal Reserve System, Finance and Economics Discussion Series 60.
Perez, Indalecio, Pablo Castellanos and José M. Sanchez-Santos (2013) `Risk premium as an economic policy objective: the Spanish case´, Economics and Business Letters, 2(3): 94-104.
Pesaran, M. Hashem and Bijan Pesaran (1997) Working with Microfit 4.0: Interactive Econometric Analysis. Oxford University Press.
Pesaran, M. Hashem, Yongcheol Shin and Richard.J. Smith (2001) `Bounds testing approaches to the analysis of level relationships´, Journal of Applied Economics 16(3): 289-326.
Sultan, Riad (2010) `Short-run and long-run elasticities of gasoline demand in Mauritius: an ARDL bounds test approach´, Journal of Emerging Trends in Economics and Managements Sciences 2(1): 90-95.
Taylor, Karl and Robert McNabb (2007) `Business cycles and the role of confidence: evidence for Europe´, Oxford Bulletin of Economics and Statistics 69(2): 185–208.
Toda, Hiro Y. and Taku Yamamoto (1995) ‘Statistical inference in vector autoregressions with possibly integrated processes’, Journal of Econometrics 66(1-2): 225-250.
Verma, Rahul and GökÇe Soydemir (2009) `The impact of individual and institutional investor sentiment on the market price of risk´, The Quarterly Review of Economics and Finance 49(3): 1129-1145.