Since the 1960s, the effects of social desirability (SD) on non-cognitive assessment, and in particular the possible effects of SD on the predictive validity of personality tests, have been subject to great controversy (Ones, Viswesvaran, & Reiss, 1996; Ones, Dilchert, Viswesvaran, & Judge, 2007).
SD was initially viewed as a confounding variable, which introduces error into self-report scores and attenuates their validity (Paulhus, 1991). Nevertheless, when SD is controlled there is a low to negligible increase in validity and, in certain cases, the relationships between variables disappear so it seems that SD is a meaningful personality trait. Furthermore, if SD is merely a source of measurement error then its relationships with external criteria should be closer to zero but relationships between SD and external criteria—and especially with various personality dimensions—have been found in many studies (Ellingson, Sackett, & Hough, 1999; Li & Bagger, 2006; McCrae & Costa, 1983; Ones, Viswesvaran, & Reiss, 1996).
Although many studies have analyzed the impact of SD on personality measures within the Big Five framework, as Holden & Passey (2009) pointed out, in other areas very few studies have been conducted. Aggression is one fi eld in which little is known about the extent to which aggression questionnaires are affected by SD. This lack of studies is more surprising if we take into account
that aggressive behaviour is highly undesirable and its measures may therefore be highly affected by SD.
The few studies that are available have shown a substantial relationship between SD measures and aggression measures. In this respect, Biaggio (1980) and Selby (1984) reported that most of the correlations between the Buss-Durkee Hostility Inventory (BDHI) scales and the Marlow-Crowne Social Desirability (MCSD) scale fell in the range r= -.3 to -.5. SD has also been related to measures of violent behaviours and partner abuse (Bell & Naugle, 2007; Devon, Colley, & Walkey, 2004) and those aspects of NEO-PI-R related to aggressive behaviour (Holden & Passey, 2010).
There are not many studies on the relationships between the most widely used questionnaire in aggression assessment—the Buss and Perry Aggression Questionnaire (BPAQ) (Buss & Perry, 1992)—and SD. The BPAQ was developed on the basis of the BDHI in an attempt to improve its poor psychometric properties, and it has been proved to be useful in assessing a wide range of aggressive behaviours (Morales-Vives & Vigil-Colet, 2010; Santisteban, Alvarado, & Recio, 2007). Buss & Perry (1992) used factor analysis to fi nd four aggression scales: physical aggression (PA), verbal aggression (VA), anger (AN), and hostility (HO), representing instrumental, emotional and cognitive aspects of aggression.
It seems that SD has a moderate to high effect on the BPAQ scales. Most of the studies analyzing the relationships between BPAQ and SD measures reported correlations in the range r= -.34 to -.60 (Becker, 2007; Harris, 1997; Morren & Meesters, 2002), although it seems that SD does not affect its factorial structure.
It should be pointed out that all the studies reported above have focused on direct aggression. Less is known about the effects of
Fecha recepción: 5-7-11 • Fecha aceptación: 16-11-11 Correspondencia: Andreu Vigil-Colet
Centre de Recerca en Avaluació i Mesura de la Conducta Universitat Rovira i Virgili
43007 Tarragona (Spain) e-mail: [email protected]
The impact of social desirability on psychometric measures of aggression
Andreu Vigil-Colet, Mireia Ruiz-Pamies, Cristina Anguiano-Carrasco and Urbano Lorenzo-Seva
Universitat Rovira i Virgili
Although many studies have focused on the effects of social desirability in personality measures, few have analysed its effects on such highly undesirable behaviour as aggressiveness. The present study analyzes the impact of social desirability on measures of direct and indirect aggression and on the relationships between both kinds of aggression with impulsivity, using a method that enables the content factors of the measures to be isolated from social desirability. Results showed that aggression measures are highly affected by social desirability and that the relationships between the two forms of aggression and impulsivity are due to the content measured by the tests and not to a common social desirability factor.
SD on indirect aggression (IA), which is defi ned as a sort of social manipulation in which the aggressor acts on those close to the victim with the sole aim of harming him without the need for face-to-face confrontation (Bjorkqvist, Osterman, & Kaukiainen, 1992). But for authors such as Vaillancourt (2005) it could be understood as a more general form of aggression that also includes social and relational aggression.
IA emerges during the socialization process of individuals, in such a way that the direct types typical in children and adolescents turn into other kinds of aggression in adults (Vaillancourt, 2005). So, while physical aggression reaches a peak in early childhood, indirect aggression begins during childhood and progressively increases until it peaks during adolescence and adulthood (Tremblay & Nagin, 2005; Archer & Coyne, 2005).
Considering the importance of IA it is surprising that so little is known about how it is affected by SD, particularly because IA is a result of socialization processes. In this regard the only research that has analyzed the relationships between SD and IA is the study by Selby (1984) who reported a substantial correlation of r= -.54 between the indirect aggression scale of the BDHI and the MCSD.
Taking into account the lack of studies about the effects of SD on aggression measures, the present research has two main goals. The fi rst is to determine whether SD has an effect on self-reports of both direct and indirect aggression, and, if there is such an effect, to apply a procedure that allows researchers and applied psychologists to obtain SD-free scores in these tests. The second bears in mind that the effects of SD on validity coeffi cients have been discussed at length in recent decades and aims to determine what effects it has on the relationships between self reports and aggression, and between self reports of aggression and impulsivity. The reason for this second objective is that various studies have shown that there is a consistent relationship between direct and indirect measures of aggression, and that impulsivity has often been used as a predictor of aggressive behavior (Card, Stucky, Sawalani, & Little, 2008; Harris, 1997; Vigil-Colet, Morales-Vives, & Tous, 2008). Nevertheless, if SD has a high impact on all these measures, then these relationships may be questioned because SD may be partially or totally responsible for them. As Ziegler & Buehner (2009) showed, social desirability can generate both spurious mean differences between groups, and correlations between constructs that should be uncorrelated, so it can be viewed as a common method variance, which contributes to correlations between scales.
Some methodological issues should be discussed. Traditionally, SD effects have been controlled by means administering an SD scale together with one or more scales designed to measure the content of interest (Ferrando, 2005). The scores of the SD scale are then used to remove individuals with high scores on SD, or to analyze SD effects on validity coeffi cients by means of partial correlations.
Nevertheless this method has been criticised for a variety of reasons. First, removing participants with high scores on SD does not guarantee that the scores of the others are free of SD. Second, if SD is related to the content that we are measuring, then by removing individuals with high SD scores we may also be removing individuals with high content scores. Third, if the psychologist is interested in an individual’s score this method cannot give an individual SD-free score for the content of interest. Finally, the methods based on a scale’s total scores, such as partial
correlation described above, assume that the items of the SD scale and the content scale have the same psychometric properties—that is, are parallel measurements—, which is highly improbable (Leite & Cooper, 2010).
To correct these defi ciencies, Ferrando (Ferrando, 2005; Ferrando, Lorenzo-Seva, & Chico, 2009), proposed a procedure that can be used to control response bias due to SD. The application of this procedure at the item calibration level provides two loading estimates for each item: a (possibly dominant) loading on the content factor that the test intends to measure, and a (possibly secondary) loading on an orthogonal factor identifi ed as SD. It is thus possible to obtain an individual’s scores by removing SD effects and to assess the validity of the content factors by computing the correlation coeffi cients based on SD free scores without making any assumptions about the item’s characteristics. Because of all its advantages, this is the procedure we will use to achieve the goals outlined above.
Method Participants
The participants were 538 voluntary university students (215 men and 323 women) aged between 17 and 42 years old (mean= 23.65; sd= 6.74) from various faculties of the Rovira i Virgili University, Tarragona (Spain).
Instruments
Indirect Aggression Scale (IAS) (Forrest, Eatough, & Shevlin, 2005):We used the reduced version of the aggressor form of the Spanish adaptation (Anguiano-Carrasco & Vigil-Colet, 2011). Because the full 25-item scale had a unidimensional structure in the Spanish adaptation the authors developed a shorter 10-item form which has good reliability (α= .82).
Buss and Perry Aggression Questionnaire (BPAQ): We administered the reduced Spanish adaptation of the questionnaire (Vigil-Colet, Lorenzo-Seva, Codorniu-Raga, & Morales, 2005). It measures four scales; physical aggression (PA), verbal aggression (VA), anger (AN) and hostility (HO) with reliabilities of .92, .75,.79 and .75, respectively. This adaptation presents a good fi t to the four factors model initially proposed by Buss and Perry (1992) and is free from sex-related biases (Condon, Morales-Vives, Ferrando, & Vigil-Colet, 2006; Morales-Vives, Codorniu-Raga, & Vigil-Colet, 2005).
Dickman’s Impulsivity Inventory (DII): We administered the Spanish adaptation of DII (Chico, Tous, Lorenzo-Seva, & Vigil-Colet, 2003). We only administered the dysfunctional impulsivity (DI) scale, because it is the one that has been related to aggression, specifi cally to the four BPAQ scales (Vigil-Colet, Morales-Vives, & Tous, 2008). In order to apply the SD control method described above, the binary response format of the scale was changed for the same 5-point response format of BPAQ and IAS.
Social Desirability Markers: We administered the four items of the Lie scale of the Eysenck Personality Questionnaire Revised (EPQ-r) proposed by Ferrando (2005), because they have shown a clear unidimensional structure related to SD. The items were administered in a 5-point response format and were mixed between the items of the other measures.
Procedure
Two professional psychologists administered the tests to groups of between 15-30 individuals in their classrooms. The order of the tests was balanced and they took between 15-20 minutes to administer. The participants were asked for no information that could have identifi ed them, thus guaranteeing their anonymity. Data analysis
In order to control SD variance we applied the procedure proposed by Ferrando et al. (2009), which has two main steps. The fi rst step consisted of identifying a factor related to SD by using a set of SD markers. The inter-marker correlation matrix was analyzed using factor analysis of the polychoric correlation matrix to obtain the loading values of each marker on the SD factor. These loading values and the Instrumental Variables Technique (Hägglund, 1982) were then used to compute the loading values of the content items on the SD factor, and the variance explained by the SD factor was removed from the inter-item correlation matrix. In the second step, this residual inter-item correlation matrix was again analyzed by factor analysis to identify the content variables of interest. Factor scores on SD and on content variables were then computed using the method proposed by ten Berge et al., (1999).
Results
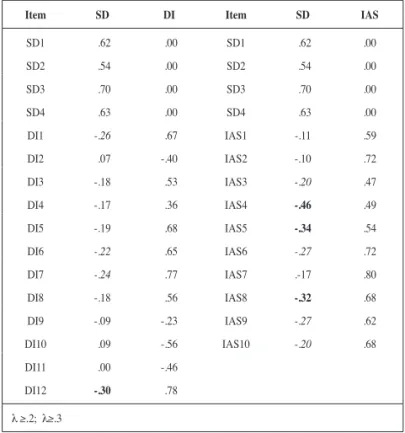
Table 1 shows the SD loadings and content loadings for the IAS scale. First of all, it can be seen that all the SD items have high loadings on the SD factor, which makes it possible to compute the SD loadings of the content items in the second step of the method described above.
Although there is no established criteria to determine when the loading of a content item on an SD factor is high enough, we propose that a loading equal to or higher than .2 indicates the possible presence of SD effects in the item and a loading equal to or higher than .3 indicates that SD has a substantial effect on the item. As can be seen, 7 of the 10 IAS items showed possible SD effects: three of the item loadings were higher than .3, and the loading for one item (number 4) was almost the same on SD and content factors. These results seem to show that IAS is contaminated quite considerably by SD, and the negative loadings of the IAS items on SD show that previous research fi ndings that individuals with high SD tend to underreport their direct aggression levels is also applicable for indirect aggression. As expected, then, aggression is undesirable behaviour from a social point of view. Furthermore, the SD scores of men and women did not differ (t(536)= 0,813 p<0.05) and the correlations between SD and scales’ raw scores for men and woman did not differ signifi cantly.
Table 1 also shows the SD loadings and content loadings for the dysfunctional impulsivity scale of DII. As can be seen, the DI items showed low loadings on the SD factor. Only four of the items had possible SD effects, and only one of these was substantial. This may be because impulsivity is much more desirable than aggression in our society.
Table 2 shows the SD loadings and content loadings for BPAQ. As previous research has shown, BPAQ scales are highly affected by SD. In particular, 4 of the 7 PA loadings on SD are equal to or higher than .3 and the loadings of two other items are higher than .2. This is not surprising because physical aggression is probably the most undesirable aggressive behaviour from a social point of view. The other BPAQ scales also show substantial SD effects. It should be noted that some items of the HO scale did not load only on the expected factor and had even greater loadings on the AN scale. Nevertheless, this problem has been reported in several factor analyses of the BPAQ test and suggests that the AN scale also has a component of resentment that is present in some items of the HO scale (Berstein & Gesn, 1997; García-León et al., 2002; Harris, 1995).
Table 3 shows the product-moment correlations between the factorial scores for aggression and impulsivity measures with and without removing SD effects: that is, in one case the factorial solution with the correlation matrix is used and, in the other, the residual correlation matrix is used after the SD factor has been removed. As can be seen there are some differences between the values but Fisher’s Z test showed no signifi cant differences so it seems that the relationships between direct aggression, indirect aggression and impulsivity are not due to a common SD effect.
Finally to check whether SD can generate spurious differences between groups and whether the method proposed above can prevent these effects, we computed the factorial scores of individuals on the SD factor (with the four markers) and split them into groups (high and low SD) using the median as a cut point. We then compared the means of the factor scores for all measures with and without removing SD effects. Table 4 shows the means for all measures in “T” scores. A multivariate analysis of variance performed on the scores without removing the SD effect showed a signifi cant difference between the two groups (F(6,512)= 8.76; p<0.01). With the exception of the HO scale, all the univariate analyses were signifi cant and, as expected, the high SD group showed lower scores on aggression and impulsivity measures. On the other hand, when SD effects were removed the MANOVA Table 1
Factor loadings for the dysfunctional impulsivity scale and the short form of the IAS
Item SD DI Item SD IAS
SD1 -.62 -.00 SD1 -.62 .00
SD2 -.54 -.00 SD2 -.54 .00
SD3 -.70 -.00 SD3 -.70 .00
SD4 -.63 -.00 SD4 -.63 .00
DI1 -.26 -.67 IAS1 -.11 .59
DI2 -.07 -.40 IAS2 -.10 .72
DI3 -.18 -.53 IAS3 -.20 .47
DI4 -.17 -.36 IAS4 -.46 .49
DI5 -.19 -.68 IAS5 -.34 .54
DI6 -.22 -.65 IAS6 -.27 .72
DI7 -.24 -.77 IAS7 .-17 .80
DI8 -.18 -.56 IAS8 -.32 .68
DI9 -.09 -.23 IAS9 -.27 .62
DI10 -.09 -.56 IAS10 -.20 .68
DI11 -.00 -.46
DI12 -.30 -.78
was non signifi cant (F(6,512)= 2.03; p>0.05), and the only signifi cant
difference at univariate level was found for the IA measure but in
the opposite direction: that is, individuals with high SD seem to show higher levels of IA. These results seem to confi rm that SD can introduce differences in aggression and impulsivity measures between groups that have different levels and that the method used here removes these effects.
Discussion
The above results seem to show that the self-reported levels of aggression are considerably reduced in individuals with high SD levels. Previous research has shown the possible effects of SD on BPAQ (Becker, 2007; Harris, 1997; Morren & Meesters, 2002), on violence and partner abuse (Bell & Naugle, 2007; Devon, Colley, & Walkey, 2004) and on measures related to antisocial behavior (Ferrando, 2005). Our results not only confi rm the effects of SD on the BPAQ but also expand them to a scale measuring indirect aggression such as the IAS.
As we have shown, most of the items on both the BPAQ and the IAS have substantial loadings on SD so individual scores have to be used with caution. In this regard we think that at both the individual and group level it is much more appropriate to compute factorial scores on the basis of the method described above than to use raw scores which seem to be highly affected by SD and may alter individual or group scores on aggression measures. Although this is not a complex procedure, it is still not straightforward for applied psychologists. To solve this drawback, we have developed Excel Applications for each test which give these scores and are available for anyone interested.
Using corrected scores acquires greater importance if we bear in mind that the results reported above were obtained in a neutral testing situation with volunteers and it is quite possible that individuals will show even higher levels of SD than the ones shown in the present research in a personnel selection process or in a psychological diagnostic process.
It should be noted that the present research also shows that the method described by Ferrando et al. (2009) is a valuable tool to control SD effects at least in aggression and impulsivity measures. In this regard, when the effects of SD were removed from high and low SD groups, the SD marker items were able to “clean” the content factors and provide free SD scores.
The results obtained when BPAQ and IAS scores were related and when both these scores were related to DI seem to indicate that SD affects all these measures, especially aggression measures, but that the extent of the relationship is not the same. From this point of view it seems that direct and indirect forms of aggression are highly related and individuals with high levels of aggression use one form of aggression or another as a function of the situation, which is one Table 2
Factor loadings for the BPAQ
Items SD PA VA AN HO
SD1 -.62 -.00 -.00 -.00 -.00
SD2 -.54 -.00 -.00 -.00 -.00
SD3 -.70 -.00 -.00 -.00 -.00
SD4 -.63 -.00 -.00 -.00 -.00
PA1 -.19 -.72 -.02 -.18 -.07
PA2 -.39 -.80 -.00 -.01 -.15
PA3 -.27 -.66 .16 -.00 -.25
PA4 -.25 -.73 -.01 -.04 -.09
PA5 -.40 -.56 -.01 -.06 -.26
PA6 -.30 -.83 -.04 -.04 -.15
PA7 -.34 -.41 -.06 -.32 -.02
VA1 -.36 -.10 -.61 -.04 -.20
VA2 -.31 -.04 -.24 -.08 -.11
VA3 -.21 -.12 -.62 -.11 -.31
VA4 -.19 -.01 -.72 -.09 -.07
AN1 -.14 -.08 -.14 -.40 -.06
AN2 -.20 -.01 -.33 -.47 -.20
AN3 -.22 -.13 -.08 -.71 -.01
AN4 -.20 -.23 -.13 -.41 -.24
HO1 -.25 -.09 -.09 -.77 -.12
HO2 -.17 -.05 -.13 -.09 -.63
HO3 -.43 -.03 -.09 -.33 -.14
HO4 -.24 -.04 -.08 -.31 -.61
HO5 -.20 -.12 -.05 -.19 -.27
λ≥.2; λ≥.3
Table 3
Correlation matrix between aggression and impulsivity measures controlling SD (correlations with SD effects between brackets)
IAS PA VA AN HO DI
IAS (..441484) (..271316) (..215265) (..302278) (..233284)
PA .259
(.287) .170
(.220)
.102
(.070) .229
(.268)
VA .277
(.298) .089
(.031) .270
(.317)
AN .188
(.120) .169
(.203)
HO .164
(.149) DI
p<0.01;p<0.05
Table 4
Factorial scores for high and low SD groups
Group IA PA VA AN HO DI
With SD High-SD 48.2 47.7 49.3 48.5 49.4 48.1
Low-SD 52 52.2 52.1 52.3 50.7 52.1
Controlling High-SD 51.3 50.6 50.8 50.7 50.5 50.7
SD Low-SD 48.6 48.7 49.2 49.8 49.5 49.1
of the determinants of the kind of aggression chosen by individuals (Lorenzo-Seva, Morales-Vives, & Vigil-Colet, 2010). On the other hand, the relationship frequently reported between impulsivity and aggression is not modifi ed when SD effects are removed so this relationship depends on the content variables that the tests are measuring. It should be noted that several studies have shown that SD has negligible or no effects on validity coeffi cients. However, the personality measures in these cases were related to measures of job performance, which are not affected by SD (Li & Bagger, 2006; Ones, Viswesvaran, & Reiss, 1996), while in our case all the measures were affected by SD.
The lack of any difference between the correlation coeffi cients with or without removing SD effects may indicate that SD has a double effect on psychometric measures. On one hand, as Paulhus (1991) proposed, SD may have an effect at the item level and generate measurement error so, when it is controlled, validity coeffi cients should increase. However, at the same time, SD may also be a meaningful personality trait that generates common variance across measures so, when it is controlled,
validity coeffi cients should decrease. As a consequence of this double and opposite effect at both the item and individual level the relationship between measures remains almost the same after SD control. Although it may be diffi cult to test this hypothesis, one way of doing so may be to analyze the relationships between psychometric measures with high SD and, for example, laboratory measures that have a high relationship with the content of the psychometric measures. In this case, controlling SD must involve a decrease in psychometric measurement error but the lack of SD in laboratory tasks means that there is no common variance due to SD so validity coeffi cients are expected to increase. Further research should test this possibility and search for an explanation for the apparent lack of effect of that controlling SD has on validity.
Acknowledgments
The research was supported by a grant from the Spanish Ministry of Science and Innovation (PSI2011-22683).
References
Anguiano-Carrasco, C., & Vigil-Colet, A. (2011). Assessing indirect aggression in aggressors and targets: Spanish adaptation of the Indirect Aggression Scales. Psicothema, 23, 146-152.
Archer, J., & Coyne, S.M. (2005). An integrated review of indirect, relational and social aggression. Personality and Social Psychology Review, 9, 212-230.
Becker, G. (2007). The Buss-Perry Aggression Questionnaire: Some unfi nished business. Journal of Research in Personality, 41, 434-452. Bell, K.M., & Naugle, A.E. (2007). Effects of social desirability on
students’ self-reporting of partner abuse perpetration and victimization. Violence and Victims, 22, 243-256.
Bernstein, I.H., & Gesn, P.R. (1997). On the dimensionality of the Buss/ Perry aggression questionnaire. Behavioral Research and Therapy, 35, 563-568.
Biaggio, M.K. (1980). Assessment of anger arousal. Journal of Personality Assessment, 44, 289-298.
Björkqvist, K., Osterman, K., & Kaukiainen A. (1992). The development of direct and indirect strategies in males and females. In K. Bjorkqvist, & P. Niemela (Eds.), Of mice and women: Aspects of female aggression (pp. 51-64). San Diego, CA: Academic Press.
Buss, A.H., & Perry, M.P. (1992). The aggression questionnaire. Journal of Personality and Social Psychology, 63, 452-459.
Card, N.A., Stucky, B.D., Sawalani, G.M., & Little, T.D. (2008). Direct and indirect aggression during childhood and adolescence: A meta-analytic review of gender differences, intercorrelations, and relations to maladjustment. Child Development, 79, 1185-1229.
Chico, E., Tous, J.M., Lorenzo-Seva U., & Vigil-Colet A. (2003). Spanish adaptation of Dickman’s impulsivity inventory, its relationship to Eysenck’s personality questionnaire. Personality and Individual Differences, 35, 1883-1892.
Condon, L., Morales-Vives, F., Ferrando, P.J., & Vigil-Colet, A. (2006). Sex differences in the full and reduced versions of the Aggression Questionnaire: A question of differential item. European Journal of Psychological Assessment, 22, 92-97.
Devon, L.L., Collie, R.M., & Walkey, F.H. (2004). Criminal attitudes to violence: Development and preliminary validation of a scale for male prisoners. Aggressive Behavior, 30, 484-503.
Ellingson, J.E., Sackett, P.R., & Hough, L.M. (1999). Social desirability corrections in personality measurement: Issues of applicant comparisons and construct validity. Journal of Applied Psychology, 84, 155-166. Ferrando, P.J. (2005). Factor analytic procedures for assessing social desirability
in binary items. Multivariate Behavioral Research, 40, 331-349.
Ferrando, P.J., Lorenzo-Seva, U., & Chico, E. (2009). A general factor-analytic procedure for assessing response bias in questionnaire measures. Structural Equation Modeling, 16, 364-381.
Forrest, S., Eatough, V., & Shevlin, M. (2005). Measuring adult indirect aggression: The development and psychometric assessment of the indirect aggression scales. Aggressive Behavior, 31, 84-97.
García-León, A., Reyes, G.A., Vila, J., Pérez, N., Robles, H., & Ramos, M.M. (2002). The aggression questionnaire: A validation study in student samples. The Spanish Journal of Psychology, 5, 45-53. Hägglund, G. (1982). Factor analysis by instrumental variable methods.
Psychometrika, 47, 209-222.
Harris, J.A. (1995). Confi rmatory factor analysis of the aggression questionnaire. Behavioral Research and Therapy, 8, 991-993.
Harris, J.A. (1997). A further evaluation of the Aggression Questionnaire: Issues of validity and reliability. Behaviour Research and Therapy, 35, 1047-1053.
Holden, R.R., & Passey, J. (2009). Social desirability. In M.R. Leary & R. H. Hoyle (Eds.), Handbook of individual differences in social behavior (pp. 441-454). New York: Guilford.
Holden, R.R., & Passey, J. (2010). Socially desirable responding in personality assessment: Not necessarily faking and not necessarily substance. Personality and Individual Differences, 49, 446-450. Leite, W.L., & Cooper, L.A. (2010). Detecting social desirability bias
using factor mixture models. Multivariate Behavioral Research, 45, 271-293.
Li, A., & Bagger, J. (2006). Using the BIDR to distinguish the effects of impression management and self-deception on the criterion validity of personality measures: A meta-analysis. International Journal of Selection & Assessment, 14, 131-141.
Lorenzo-Seva, U., Morales-Vives, F., & Vigil-Colet, A. (2010). Aggressive responses to troubled situations in sample of adolescents: A three-way model approach. Spanish Journal of Psychology, 13, 178-189. McCrae, R.R., & Costa, P.T. (1983). Social desirability scales: More
substance than style. Journal of Consulting and Clinical Psychology, 51, 882-888.
Morren, M., & Meesters, C. (2002). Validation of the Dutch version of the Aggression Questionnaire in adolescent male offenders. Aggressive Behavior, 28, 87-96.
Morales-Vives, F., & Vigil-Colet, A. (2010). Are there sex differences in physical aggression in the elderly? Personality and Individual Differences, 49, 659-662.
Ones, D.S., Viswesvaran, C., & Reiss, A.D. (1996). Role of social desirability in personality testing for personnel selection: The red herring. Journal of Applied Psychology, 81, 660-679.
Ones, D.S., Dilchert, S., Viswesvaran, C., & Judge, T.A. (2007). In support of personality assessment in organizational settings. Personnel Psychology, 60, 995-1027.
Paulhus, D.L. (1991). Measurement and control of response bias. In J.P. Robinson, P.R. Shaver & L.S. Wrightsman (Eds.), Measures of personality and social psychological attitudes (pp. 17-59). San Diego, CA: Academic.
Santisteban, C., Alvarado, J.M., & Recio, P. (2007). Evaluation of a Spanish version of the Buss ansd Perry agression questionnaire: Some personal and situational factors related to the aggression scores of young subjects. Personality and Individual Differences, 42, 1453-1462.
Selby, M.J. (1984). Assessment of violence potential using measures of anger, hostility, and social desirability. Journal of Personality Assessment, 48, 531-544.
Ten Berge, J.M.F., Krijnen, W., Wansbeek, T., & Shapiro, A. (1999). Some new results on correlation-preserving factor scores prediction methods. Linear Algebra and its Applications, 289, 311-318.
Tremblay, R.E., & Nagin, D.S. (2005). The developmental origins of physical aggression in humans. In R.E. Tremblay, W.W. Hartup & J. Archer (Eds.), Developmental origins of aggression (pp. 83-106). New York. Guilford Press.
Vaillancourt, T. (2005). Indirect aggression among humans: social construct or evolutionary adaptation? In R.E. Tremblay, W.W. Hartup & J. Archer (Eds.), Developmental origins of aggression (pp. 158-177). New York. Guilford Press.
Vigil-Colet, A., Lorenzo-Seva, U., Codorniu-Raga, M.J., & Morales, F. (2005). Factor structure of the aggression questionnaire among different samples and languages. Aggressive Behavior, 31, 601-608.
Vigil-Colet, A., Morales-Vives, F., & Tous, J. (2008). The relationships between functional and dysfunctional impulsivity and aggression across different samples. Spanish Journal of Psychology, 11, 480-487. Ziegler, M., & Bühner, M. (2009). Modeling social desirable responding