Broadband Channel Long Delay Cluster
Measurements and Analysis at 2.4GHz in Subway
Tunnels
Ruisi He
State Key Laboratory of Rail Traffic Control and Safety Beijing Jiaotong University
Beijing, P.R.China Email: [email protected]
Zhangdui Zhong
State Key Laboratory of Rail Traffic Control and Safety
Beijing Jiaotong University Beijing, P.R.China Email: [email protected]
Cesar Briso
Department of Communications, Acustic and Image Polithecnic University of Madrid
Madrid, Spain Email: [email protected]
Abstract—The delay caused by the reflected ray in broadband communication has a great influence on the communications in subway tunnel. This paper presents measurements taken in subway tunnels at 2.4 GHz, with 5 MHz bandwidth. According to propagation characteristics of tunnel, the measurements were carried out with a frequency domain channel sounding technique, in three typical scenarios: line of sight (LOS), Non-line-of-sight (NLOS) and far line of sight (FLOS), which lead to different delay distributions. Firstly IFFT was chosen to get channel impulse response (CIR) h(t) from measured three-dimensional transfer functions. Power delay profile (PDP) was investigated to give an overview of broadband channel model. Thereafter, a long delay caused by the obturation of tunnel is observed and investigated in all the scenarios. The measurements show that the reflection can be greatly remained by the tunnel, which leads to long delay cluster where the reflection, but direct ray, makes the main contribution for radio wave propagation. Four important parameters: distribution of whole PDP power, first peak arriving time, reflection cluster duration and PDP power distribution of reflection cluster were studied to give a detailed description of long delay characteristic in tunnel. This can be used to ensure high capacity communication in tunnels.
Keywords-tunnel; broadband channel model; long delay characteristic; reflected delay cluster distribution; power delay profile
I. INTRODUCTION
Most wireless communications networks in subway tunnels use narrow band systems like TETRA or GSM [1, 2], however, with the development of third generation mobile communication, high capacity and efficient communications are needed in subway tunnels for metros controlling and to give better service for the passengers. Therefore, it does require an accurate broadband characteristic and model of the tunnels to build the wireless network.
To design an optimal wireless communication network, an accurate channel model is needed to predict the path loss as well as the signal delay spread. Path loss can be used to describe the large scale characteristic [3, 4], while delay spread is connected with broadband characteristic [5, 6]. Compared
with some other environments, the structure of tunnel has some special influences on the radio wave propagation. Because of the obturation of tunnel, the reflected rays can be greatly remained, the conventional theory that direct ray is predominant when there is line of sight must be queried here. This new phenomenon requires us to do a detailed research on broadband channel in tunnel and make a deep investigation on the delay characteristic. The present network in subway tunnel may need some improvements.
A lot of research about the radio wave propagation characteristic in tunnel environment have been done by now. Some of them focused on large and small scale characteristic [2, 7], and some others investigated the broadband channel characteristic in tunnel [8, 9]. Little research on delay spread in the tunnel has been conducted at present. Some papers mentioned the influence of delay in tunnel [10], and the special characteristic of long delay in tunnel is observed, too [11]. However, few people conduct a deep analysis about broadband delay cluster in tunnel, especially the long delay characteristic caused by the reflection. To guide the engineering construction for subway communication, it’s necessary to do the in-depth research on the long delay cluster characteristic in subway tunnel environment.
The remainder of this paper is organized as follows. In Section II, the measurement configuration and scenarios are described. In Section III, an overview of broadband channel model is given. Then, in Section IV, based on the broadband channel model, the characteristic of long delay in tunnel is analyzed, and the four important parameters of long delay are discussed. Finally, the paper is concluded in Section V.
II. MEASUREMENT CAMPAIGN
A. Measurement Configuration and Environment
The present Madrid line subway tunnel was utilized in the measurements. The tunnel measured is 9.6m width and with 6.1m maximum height. A flat spectrum channel sounder installed in the wall of the tunnel is utilized in the measurements with the carrier frequency of 2.4 GHz.
This work is supported by the National Natural Science Foundation of China under Grant 60830001, the Program for Changjiang Scholars and Innovative Research Team in University under Grant No. IRT0949, the Program for New Century Excellent Talents in University under Grant NCET-09-0206 and the Key Project of State Key Lab of Rail Traffic Control and Safety under Grant RCS2008ZZ006, the Project of State Key Lab. of Rail Traffic Control and Safety under Grant RCS2008ZT005, the State Key Laboratory of Rail Traffic Control and Safety(Contract No.RCS2010K008).
(a) (b)
Figure 1. (a) Shape of tunnel and transmitter, (b) Receiving system
The two flat antennas are utilized in the transmitter. Inside the tunnel, the antennas were located 4m over the floor and 25cm from the tunnel walls, as shown in Fig. 1(a). The receiving equipment was deployed in the locomotive cabin of a 60m length train. The receiving antennas were installed on the front window of the train, as shown in Fig. 1(b). Table I summarizes the measurement configuration.
TABLE I. MEASUREMENT CONFIGURATION
Frequency 2.4GHz, 5MHz bandwidth
TX Power 20dBm
TX Antenna 8dBi gain,circular polarization
RX Antenna 8dBi gain, linear polarization
Sampling Interval 10 milliseconds
Maximum Train Speed 20km/h
B. Typical Propagation Regions
Mostly, the direct ray makes the main contribution in the communication compared with other contributions, such as reflection. But in some special environments like subway tunnel, with the increasing of the distance between transmitter and receiver, the influence of direct ray is becoming unconsidered while the influence of the reflection is becoming considerable, which leads to a special characteristic of delay distribution. To investigate this issue, the measurements in different regions were taken. We’ll give the descriptions for the regions as follows.
• Line of sight (LOS): It happens when the train is close to the transmitter, 100m before and after passes it.
• Non-line-of-sight (NLOS): It appears when the train is passing the transmitter. As the train is 60m long and the tunnel is narrow, there is no line of sight in this situation.
• Far line of sight (FLOS): When the train is far from the transmitter, there isn’t a clear LOS between train and transmitter. It is usually located 100-300m from the transmitter in subway tunnels.
III. BROADBAND CHARACTERISTIC OVERVIEW With the test system, we get the measured data of the frequency response, which allows us to give an overview for the broadband characteristic. Fig. 2 shows a 3D figure of the measured wideband received signals at 2.4GHz, with 5MHz bandwidth. Three regions are marked in the figure.
Figure 2. Measured 3D wideband received signal
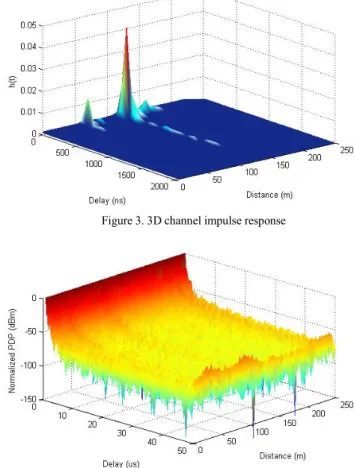
Figure 3. 3D channel impulse response
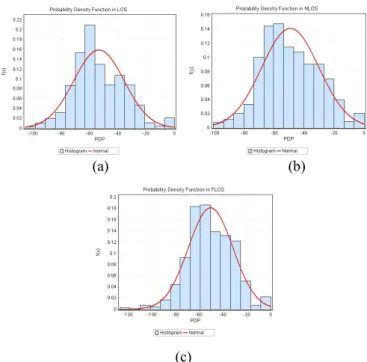
Figure 4. 3D normalized power delay profile
The impulse response of channel h(t) can be calculated by processing the inverse discrete Fourier transfer (IDFT) of the transfer function H(f) [12]. IFFT with 1000 points was chosen in this work. The 3D h(t) is shown in Fig. 3.
IV. DELAY CLUSTER CHARACTERISTICS ANALYSIS Power delay profile is widely agreed to be a negative exponential characterized by the delay spread [13]. However, there is no simple mathematical expression that can model the shape of the measured PDPs in some special environments [14]. In subway tunnel, the existence of long delay cluster changes the distribution of power delay profile by the delay spread.
With the overview of broadband channel model, we can make the deeper investigation on long delay. Firstly we give a detailed 3D figure of PDPs to make it clear, as shown in Fig. 5. Mostly, amplitude of normalized PDPs decrease with the delay, however, we can see some heaves in Fig. 5 at the time more than 1000ns, which means there are some reflected rays coming after a long delay while the direct ray is inexistent (NLOS) or unconsidered (FLOS) at this time. To make a better comparison, three PDPs in typical LOS, NLOS and FLOS situations are taken out and put into one 2D figure, Fig. 6. The black dashed line is the fitting exponential distribution of the PDP in LOS, which is the only region matches exponential distribution, while in NLOS and FLOS, some long delay clusters lead to different distribution of PDP. It shows that during the time more than 1000ns, some great peaks come out again in NLOS and FLOS regions. The amplitude at 1400ns in NLOS region is even up to -9dBm, which is very high to result in large errors in receiver. This phenomenon just happens in the tunnel environment because of the obturation of tunnel. In open area or some other in-door environments, even though the strength of direct ray is becoming unconsidered with the
Figure 5. Detail of 3D normalized PDP
Figure 6. Comparison of normalized PDP in three typical regions
increasing of the distance, the reflection will never make the main contribution. When it comes to tunnel, the reflection will be greatly remained by the obturation of tunnel, that’s why we can see some great peaks after a long delay even though there is line of sight. The delay caused by the obturation of tunnel leads to great influence on the communication in tunnel. The deep investigation will be made on four important parameters.
A. Distribution of Whole PDP Power
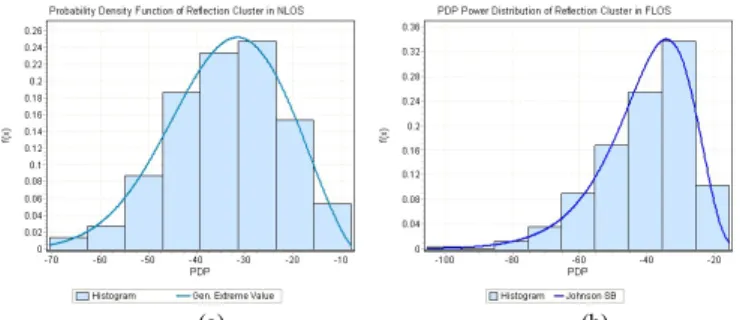
The PDP powers in three typical regions were gathered respectively and the software EasyFit was utilized to get the distribution of the whole PDP powers in first 5000 ns, as shown in Fig. 7. Generally, it can be well fitted by normal distribution. And the parameters of normal fit are obtained and shown in Table II. It’s obvious that the standard deviation
σ
is the greatest when in NLOS because of the strong multipath and deep fading there, up to 19.049 dB, compared to 17.742 in LOS. An interesting result is that the mean of PDP power in NLOS is the greatest, while the lowest in LOS. It is because when there is line of sight, the PDP is agreed to be a negative exponential distribution and decrease with the delay. However, when it comes to be in NLOS and FLOS situations, some great peaks come out again, these peaks make up big long delay cluster, as shown in Fig. 6, which make the PDP power much greater than it used to be, and lead to a greater mean value, as shown in Table II.(a) (b)
(c)
Figure 7. Probability density function of normalized PDP in three regions
TABLE II. NORMAL FIT RESULTS OF PDP POWER
LOS FLOS NLOS
B. First Peak Arriving Time
To make the deep investigation on the long delay characteristic, we observed PDPs in every location and recorded the first peak arriving time in NLOS and FLOS situations. The distributions of the first peak arriving time are shown in Fig. 8, respectively. It is obvious that there is no simple mathematical expression that can describe the distribution of the first peak arriving time. Anyway, we can still calculate the mean value of it, which is 938.46 ns in NLOS and 712.5 ns in FLOS, respectively. That means the first peak comes later in NLOS situation, because the strong multipath causes longer reflection distance. There isn’t delay cluster in LOS, so we don’t need to do this job in that situation.
C. Reflection Cluster Duration
The duration of the reflection cluster affects the communication a lot. The longer it lasts, the more chance it may result in large errors in receiver. The duration is recorded according to the change of peaks and fitted as shown in Fig. 9. There is also no simple mathematical expression can describe the distribution very well. The mean value of the reflection cluster duration is 953.85 ns in NLOS situation, while 1062.5 ns in FLOS situation, which means the reflection cluster lasts longer in FLOS than in NLOS situation.
D. PDP Power Distribution of Reflection Cluster
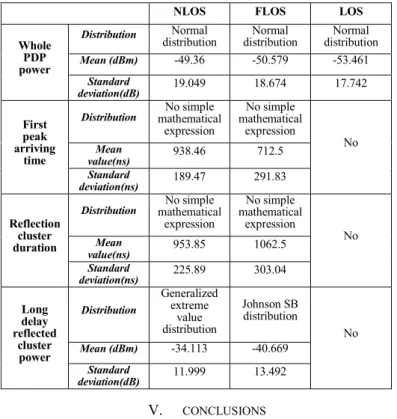
At last, we present the distribution of the reflected cluster. Instead of the whole PDPs, just the peaks in first reflected cluster are recorded to give the distribution. The probability density functions of normalized PDP in reflected cluster are shown in Fig. 10. In NLOS region, it can be fitted by generalized extreme value distribution, the probability density function is given by
(a) (b)
Figure 8. The distribution of first peak arriving time
(a) (b)
Figure 9. The distribution of reflection cluster duration
(
)
⎪
⎩
⎪
⎨
⎧
−
−
−
+
+
−
=
− − −
))
exp(
exp(
1
)
1
(
)
1
(
exp
1
)
(
/ 1 1 /
1
z
z
kz
kz
x
f
k k
σ
σ
0
0
=
≠
k
k
(1)
Where
z
=
(
x
−
μ
)
σ
, andk
=
−
0
.
41547
,σ
=
12
.
676
,575
.
37
−
=
μ
. And in FLOS region, it can be fitted byJohnson SB distribution, the probability density function is given by
)
))
1
ln(
(
2
1
exp(
)
1
(
2
)
(
2z
z
z
z
x
f
−
+
−
−
=
γ
δ
π
λ
δ
(2)Where
z
=
(
x
−
ξ
)
λ
, andγ
=
−
6
.
7739
,4833
.
2
=
δ
,λ
=
537
.
13
,ξ
=
−
542
.
62
. Theseexpressions give an overview of what happened on the reflection cluster. And also, the mean value and the standard deviation are calculated, the reflection cluster mean value is -34.113 dBm in NLOS and -40.699 dBm in FLOS, because the bigger long delay clusters exist more in NLOS than in FLOS, which makes the greater mean value. The cumulative distribution function of reflected cluster is shown in Fig. 11. It also shows the PDPs are greater in NLOS region than in FLOS region, mostly. 90% of the long delay cluster values are less than -20 dBm for NLOS region, while it’s -26 dBm for FLOS region.
(a) (b)
Figure 10. The distribution of PDP reflected cluster
With all the investigations, we can see that even though there is no simple mathematical expression for first peak arriving time and reflection cluster duration, we can still find that the clusters come earlier and last longer in FLOS than in NLOS region, but it is stronger in NLOS region. And it also leads to stronger power value for the whole PDPs, which are much stronger than in LOS region. All the measurements and analysis results of long delay cluster characteristics are dedicated in Table III.
TABLE III. ANALYSIS RESULTS OF LONG DELAY CHARACTERISTICS
NLOS FLOS LOS
Whole PDP power
Distribution distribution Normal distribution Normal distribution Normal
Mean (dBm) -49.36 -50.579 -53.461
Standard
deviation(dB) 19.049 18.674 17.742
First peak arriving
time
Distribution mathematical No simple expression
No simple mathematical
expression
No
Mean
value(ns) 938.46 712.5
Standard
deviation(ns) 189.47 291.83
Reflection cluster duration
Distribution mathematical No simple expression
No simple mathematical
expression
No
Mean
value(ns) 953.85 1062.5
Standard
deviation(ns) 225.89 303.04
Long delay reflected
cluster power
Distribution
Generalized extreme
value distribution
Johnson SB distribution
No
Mean (dBm) -34.113 -40.669
Standard
deviation(dB) 11.999 13.492
V. CONCLUSIONS
In this paper, we present the measurements taken in a real Madrid subway tunnel at 2.4GHz with 5MHz bandwidth. The overview of broadband radio wave propagation and the accurate characterizations of long delay cluster were studied.
Based on the measured three-dimensional frequency transfer functions in three typical scenarios: LOS, NLOS and FLOS, the channel impulse response, PDP were calculated to give an overview of the broadband characteristics.
The long delay cluster caused by the obturation of tunnel was observed and deeply investigated in all the scenarios. The conventional theory that the distribution of power delay profile is negative exponential is incorrect in tunnel, because the reflection can be greatly remained by the tunnel, which leads to long delay cluster where the reflection makes great contribution for radio wave propagation. Four important parameters: distribution of whole PDP power, first peak arriving time, reflection cluster duration and PDP power distribution of reflection cluster were studied to give a detailed
description of long delay characteristic in tunnel. It shows that the clusters come earlier and last longer in FLOS than in NLOS region, but it is stronger in NLOS region. And it also leads to greater power value for the whole PDPs, which are much greater than in LOS region. The reflected delay cluster is agreed to be generalized extreme value distribution in NLOS situation and Johnson SB distribution in FLOS situation.
ACKNOWLEDGMENT
We would like to thank to the Madrid Subway Carrier (METRO) and to Dimetronic Invensys for their help and support to perform the propagation measurements.
REFERENCES
[1] A. Hrovat, G. Kandus and T. Javornik, “Four-slope channel model for path loss prediction in tunnels at 400 MHz,” Microwaves, Antennas & Propagation, IET. vol. 4, Issue: 5, pp: 571 - 582, . 2010.
[2] Y. P. Zhang, “Novel model for propagation loss prediction in tunnels,” IEEE Transactions on Vehicular Technology, vol. 52, no. 5, September 2003.
[3] Hata M, “Empirical formula for propagation loss in land mobile radio services,” Vehicular Technology, 1980, 29(3): 317--325.
[4] Ruisi He, Zhangdui Zhong and Bo Ai, “Path loss measurements and analysis for high-speed railway viaduct scene,” IWCMC2010-Proceedings of the 6th International Wireless Communications and Mobile Computing Conference, p 266-270, 2010.
[5] Pitchaiah Soma, Ling Cheun Ong, Sumei Sun and Michael Yan Wah Chia, “Propagation measurements and modeling of lmds radio channel in singapore,” IEEE Transactions on Vehicular Technology, vol. 52, no. 3, May 2003.
[6] Gilbert Siy Ching, Mir Ghoraishi and Markus Landmann, “Wideband polarimetric directional propagation channel analysis inside an arched tunnel,” IEEE Transactions on Antennas and Propagation, vol. 57, no. 3, March 2009.
[7] J.-M. Molina-Garcia-Pardo, M. Lienard, A. Nasr and P. Degauque, “Wideband analysis of large scale and small scale fading in tunnels,” ITS Telecommunications, Page(s): 270 – 273, 2008.
[8] Jose-Maria Molina-Garcia-Pardo,José-Victor Rodríguez and Leandro Juan-Llácer, “Wide-band measurements and characterization at 2.1ghz while entering in a small tunnel,” IEEE Transactions on Vehicular Technology, vol. 53, no. 6, November 2004.
[9] Mathieu Boutin, Ahmed Benzakour, Charles L. Despins and Sofiène Affes, “Radio wave characterization and modeling in underground mine tunnels,” IEEE Transactions on Antennas and Propagation, vol. 56, no. 2, February 2008.
[10] Zhi Sun and Ian F. Akyildiz, “Channel modeling and analysis for wireless networks in underground mines and road tunnels,” IEEE Transactions on Communications, vol. 58, no. 6, June 2010.
[11] Y. P. Zhang and H. J. Hong, “Ray-optical modeling of simulcast radio propagation channels in tunnels,” IEEE Transactions on Vehicular Technology, vol. 53, no. 6, November 2004.
[12] T Rappaport, Wireless Communications Principles and Practice 2nd Edition, 31. Dec. 2001.
[13] Jan Hansen, “An analytical calculation of power delay profile and delay spread with experimental verification,” IEEE Communications Letters, vol. 7, no. 6, June 2003.