Simultaneously measuring two ultrashort laser
pulses on a single-shot using double-blind
frequency-resolved optical gating
Tsz Chun Wong,1,* Justin Ratner,1Vikrant Chauhan,1Jacob Cohen,1Peter M. Vaughan,1Lina Xu,1 Antonio Consoli,2and Rick Trebino1
1School of Physics, Georgia Institute of Technology, 837 State Street, Atlanta, Georgia 30332 USA 2E.T.S.I. de Telecomunicación, Universidad Politécnica de Madrid, Av. Complutense 32, 28040, Madrid, Spain
*Corresponding author: [email protected]
Received November 22, 2011; revised January 30, 2012; accepted February 2, 2012; posted February 2, 2012 (Doc. ID 158454); published May 9, 2012
We demonstrate a simple self-referenced single-shot method for simultaneously measuring two different arbitrary pulses, which can potentially be complex and also have very different wavelengths. The method is a variation of cross-correlation frequency-resolved optical gating (XFROG) that we call double-blind (DB) FROG. It involves measuringtwospectrograms, both of which are obtained simultaneously in a single apparatus. DB FROG retrieves both pulses robustly by using the standard XFROG algorithm, implemented alternately on each of the traces, taking one pulse to be“known”and solving for the other. We show both numerically and experimentally that DB FROG using a polarization-gating beam geometry works reliably and appears to have no nontrivial ambiguities. © 2012 Optical Society of America
OCIS codes: 320.0320, 320.7100.
1. INTRODUCTION
In ultrafast-optical experiments it is often necessary to mea-sure two pulses simultaneously. For example, in the charac-terization of materials, both input and output pulses must be known to measure the desired material properties. Also, measuring exotic wavelength pulses usually requires a well characterized reference pulse at a very different, less exotic wavelength, thus also yielding a two-pulse measurement pro-blem. The same is true for very complex pulses (such as con-tinuum), which are also best measured using a previously characterized simple reference pulse with a vastly different spectrum [1,2]. As a result, a self-referenced technique that can simultaneously measure two different pulses—of poten-tially different wavelengths, pulse lengths, and complexities— would be very useful. Single-shot operation would be even better.
A method has been proposed in which the two different un-known pulses gate each other in a nonlinear medium. Spec-trally resolving the gated pulse generates a spectrogram, as in the class of frequency-resolved-optical-gating (FROG) meth-ods [3,4]. It is called Blind FROG in reference to its mathema-tical equivalence to two-dimensional “blind deconvolution” [4–10]. Blind FROG attempts to retrieve the two different pulses from a single such FROG trace.
Blind FROG is related to a well known technique with iden-tical apparatus, called XFROG [11–13], in which one of the two pulses is known and which quite reliably yields an essen-tially unambiguous measurement of the other pulse. An XFROG apparatus becomes a Blind FROG apparatus when neither of the two pulses is known. In contrast to XFROG, Blind FROG cannot retrieve the two unknown pulses (as pointed out in the original publication [3]). In other words, in contrast to XFROG (and FROG), which have at most a few
trivial (unimportant) ambiguities, Blind FROG usually has manynontrivialambiguities [3,9]. So an additional measure-ment of at least one pulse spectrum and preferably both pulse spectra, is required to achieve convergence of the blind FROG pulse-retrieval algorithm [3]. Related techniques, such as VAMPIRE, [14] also require additional measured spectra. Thus, unlike FROG and XFROG for measuring single pulses, blind FROG has proved too complex for most pulse-measure-ment problems, although it may find applications in attose-cond-pulse measurement, where the expression for the signal field is different and so corresponds to a different mathematical problem, which may have better convergence properties.[15]
Here we show that a variation on blind FROG, originally proposed by one of us [4], but never previously numerically considered or experimentally attempted, solves this problem. We call this technique double-blind (DB) FROG. Unlike other FROG variants, in which only one spectrogram is measured, in DB FROG two traces are measured, preferably simulta-neously. DB FROG takes advantage of the obvious fact that, in an XFROG, as one pulse gates the other in the nonlinear medium, the other is also simultaneously gating the one. If two gated signal pulses are generated, it is then usually straightfor-ward to spectrally resolve and measure both. The result is the generation of two different spectrograms in which the two pulses play complementary roles. Generating two signal pulses is straightforward in the polarization-gating (PG) FROG beam geometry.
To retrieve the two pulses from the two measured spectro-grams, DB FROG uses the standard XFROG algorithm with no modifications. It simply assumes that one pulse is known (even though it is not) and, using the XFROG algorithm in con-junction with one trace, finds the other, and then vice versa
using the other trace. This process is continued until both pulses are retrieved. In contrast to Blind FROG and other re-lated previous methods, the DB FROG algorithm requires no prior knowledge of the pulse spectra to converge.
Finally, DB FROG can naturally operate on a single-shot basis. In this article, we describe single-shot experiments that confirm its ability to measure two pulses simultaneously. We also describe numerical simulations of its algorithm for more complex pulses.
2. DB PG FROG
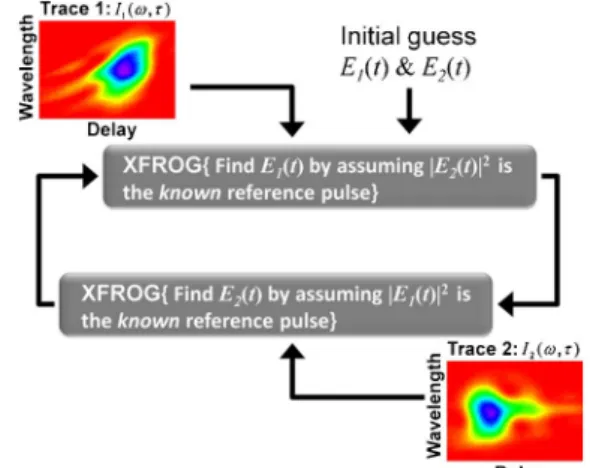
A DB polarization-gating FROG (DB PG FROG) experimental setup is similar to a PG XFROG setup, except for an additional polarizer, oriented at−45° and an additional spectrometer and camera (see Fig.1). The two unknown pulses gate each other in aχ3 nonlinear medium, such as fused silica. Pulse 1 is 0°-polarized and pulse 2 is 45°-polarized, both with respect to the horizontal plane. Both the pulses are temporally and spatially overlapped in the fused silica glass plate. The in-duced birefringence in the fused silica caused by the presence of pulse 1 is seen by pulse 2. As a result, pulse 1 induces time-gated polarization rotation in pulse 2. By the same mechan-ism, pulse 2 causes a time-gated polarization rotation in pulse 1. In other words, the first pulse experiences the polarization-gating interaction in which the second pulse acts as the gate and simultaneously the second pulse experiences the polari-zation-gating interaction in which the first pulse is the gate. An inexpensive spectrometer and camera are placed in each beam path (although one spectrometer–camera combination could be used for both traces because, unless one of the pulses is complex, the traces are usually much smaller than the full camera screen), so that two spectrograms are pro-duced, one from each interaction.
The DB technique implemented with PG FROG inherits the advantages and disadvantages of standard PG FROG. For ex-ample, the nonlinear optical process of polarization-gating is automatically phase-matched for all wavelengths, so pulses of even vastly different wavelengths can be used and pulses with extremely large bandwidths and hence very complex tempor-al waveforms can be measured. Automatic phase-matching also occurs for all beam-crossing angles, including large ones. This allows large delay ranges in single-shot beam geometries, which map delay onto transverse position in the nonlinear medium and use crossed beams at large angles to achieve large delay ranges. Finally, automatic phase-matching vastly simplifies alignment.
On the other hand, PG FROG requires high-quality polari-zers with an extinction ratio of at least∼105. Calcite polarizers offer the required extinction ratio, but they are thick, so their use introduces nonnegligible material dispersion and distorts the pulse somewhat, the precise amount depending on the length of the pulse and its wavelength range. However, this is usually not a serious problem if the pulse is in the visible or near IR. Also, only the polarizer before the nonlinear med-ium matters and its effect can be taken into account through simple postprocessing after the measurement, in which the pulse is simply numerically back-propagated to obtain the in-put pulse, which is possible because the measurement yields the full intensity and phase versus time and frequency. Finally, PG FROG uses a third-order effect and so requires at least one amplified pulse and usually two. These issues are not overly burdensome, however, and DB PG FROG is relatively easily implemented.
Mathematically, the two traces in DB PG FROG are given by
I1ω;τ Z E1tjE2t−τj2e−iωtdt2 (1)
and
I2ω;τ Z E2tjE1t−τj2e−iωtdt2. (2)
In the standard generalized-projections XFROG iterative phase-retrieval algorithm [4,16], the known pulse is called the gate pulse and the unknown pulse (often called the probe pulse) is retrieved using it. DB FROG, of course, lacks a known reference pulse and has two traces from the two simul-taneous measurements. So, in the first step, our DB FROG algorithm assumes that E1t is the unknown pulse and
E2tis the (admittedly incorrect) known reference pulse. The XFROG algorithm runs for a few iterations onI1ω;τ(trace 1) starting with initial guesses for bothE1tandE2t. The result of this first step is, of course, not the correct pulse, but instead is simply a better estimate for it than the initial guess because this estimate more closely satisfies the traceI1ω;τ. In the next half of the cycle, the resulting improved value ofE1t is now assumed to be the known pulse and the second data set,I2ω;τ, is used to obtain an improved value forE2t. The
Fig. 1. (Color online) The schematic of single-shot DB PG FROG. One pulse gates the other, while the other gates the one. Two spectro-grams are generated, from which both pulses are retrieved without
additional information or assumptions. Fig. 2. (Color online) Pulse-retrieval algorithm in DB PG FROG.
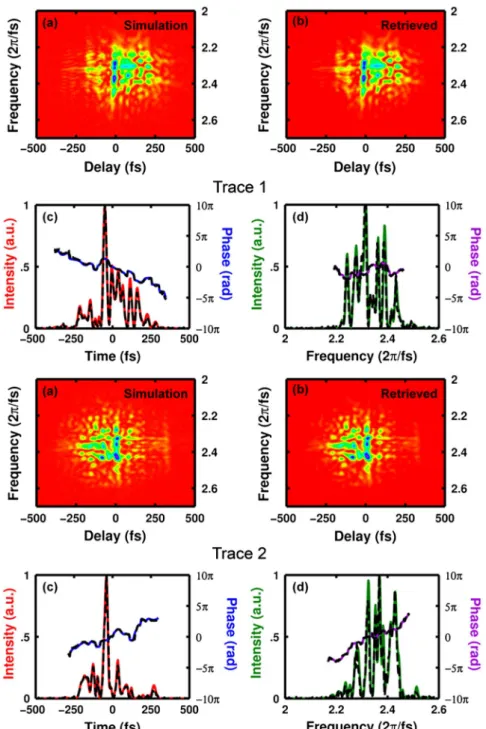
improved values ofE1tandE2tthus obtained are used as the initial guesses for the next cycle. This process is repeated until the two resulting iterated DB PG FROG traces match the experimentally measured traces, that is, the difference between the measured and retrieved traces is minimized. Figure2shows the flowchart of the retrieval algorithm. Before running the algorithm on the traces, we perform standard noise-reduction steps and background subtraction (which make no assumptions about the pulses) [17]. The convergence of the algorithm is defined using theGerror (the rms differ-ence between the measured and retrieved traces), just as in other FROG techniques [4], except that here we obtain two FROG errors, one for each measured trace.
We found this process to be extremely robust. In simula-tions, we routinely retrieved pairs of complex pulses with rms time-bandwidth products of ∼7 from simulated traces, even with 1% Poisson noise added (see Fig.3) to simulate ex-perimental conditions. In our simulations, the FROG trace ar-ray size was1024×1024and theGerror of the trace with the higher error was 0.085%, indicative of an excellent fit. More importantly, the retrieved pulses agreed very well with the ac-tual pulses, which were, of course, known in our numerical simulations. No ambiguities were found in these preliminary numerical studies, except for the well known trivial ambigu-ities of most pulse-measurement techniques, the zeroth and first-order spectral phases.
3. EXPERIMENT
In experiments, two 5-mm-wide beams of 100 fs pulses (at a 1 kHz repetition rate), centered at 800 nm, from a regenerative amplifier (coherent legend elite) were crossed at an angle of 6° in a fused silica glass plate of 250μm thickness. This cross-ing angle and the beam diameter yielded a total delay range of 1.5 ps. In our single-shot geometry, there is, by definition, no transverse temporal broadening, but there is some longitudi-nal temporal broadening [4] of the trace associated with the thickness of the nonlinear medium used, so a thin glass plate is preferred. But the signal pulse energy decreases
quadrati-cally with decreasing thickness of the nonlinear medium. We found that with a pulse energy of 50μJ, a 250μm fused silica plate provided enough signal photons on a single-shot to be measured, while only resulting in temporal broadening of ∼10fs. Figure 1 gives the schematic of our DB PG FROG setup.
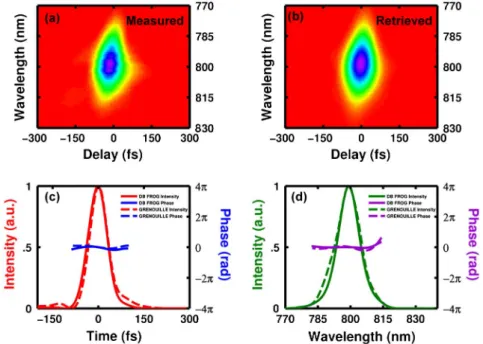
Beam 1 passed through a 0° polarizer and was focused to a line in the fused silica plate using a cylindrical lens of 100 mm focal length. This beam was then collimated using another identical cylindrical lens after emerging from the fused silica plate. Finally, it was analyzed by a 90° polarizer. Similarly, Fig. 4. (Color online) (a) The measured trace 1 for a simple pulse. (b) Retrieved trace 1 with a FROG error of 0.3%. (c) Retrieved pulse intensity and phase in time compared with an independent GRENOUILLE measurement. (d) The measured spectrum and the spectral phase compared with GRENOUILLE.
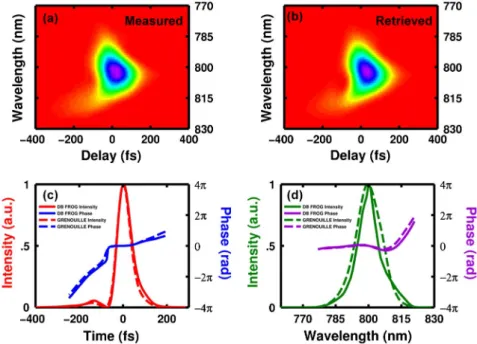
Fig. 5. (Color online) (a) The measured trace 2 for another simple pulse. (b) Retrieved trace 2 with a FROG error of 0.2%. (c) Retrieved pulse intensity and phase in time compared with an independent GRENOUILLE measurement. (d) The measured spectrum and the spectral phase compared with GRENOUILLE.
beam 2 passed through a half-wave plate to rotate its polariza-tion to 45° and then through a 45° polarizer to improve its polarization purity. It was then focused using the same cylind-rical lens into the fused silica plate, where it spatially over-lapped with beam 1 and crossed with it in the horizontal plane at an angle of 6°. This beam, after passing through the same collimating lens as beam 1, was analyzed by a−45° po-larizer. The polarizers used in the experiment were calcite with an extinction ratio of>105. In the absence of temporal overlap of the pulses from the two beams, no signal beam could be seen, as the crossed polarizers essentially completely
blocked both of the signals from the cameras. We used a delay stage in one of the beam paths to obtain temporal overlap be-tween the crossing pulses, but it remained stationary during the measurement. When both beams temporally coincided in the plate, a cross-correlation signal beam appeared after the crossed polarizers in both of the beam paths. Cylindrical lenses of 300 mm focal length each imaged the delay axis in the glass plate onto the cameras. After each imaging lens, an imaging spectrometer with a 600line∕mm grating and a 100 mm cylindrical lens spectrally resolved each cross-correlation signal. Two cameras recorded the two traces. Fig. 6. (Color online) (a) The measured trace 1 for a simple pulse. (b) Retrieved trace 1 with a FROG error of 0.2%. (c) Retrieved pulse intensity and phase in time compared with an independent GRENOUILLE measurement. (d) The measured spectrum and the spectral phase compared with GRENOUILLE measurements.
We first measured DB PG XFROG traces for a pair of simple pulses. The resulting DB PG FROG measurements are shown in Figs.4and5. The DB PG FROG algorithm converged quickly for these traces and the two DB PG FROG trace errors were 0.3% and 0.2%. We compared the measured simple pulses with independent measurements using a commercial GRENOUILLE device from Swamp Optics for confirmation. Pulses 1 and 2 were measured by DB PG FROG to be 73 fs and 65 fs long, respectively, in good agreement with the GRENOUILLE measurements of these pulse widths of 68 fs and 66 fs.
In a second set of measurements, we generated two pulses having different amounts of chirp introduced into them by passing through different lengths of glass. In addition, pulse 2 passed through an additional 2 cm of SF11 glass block, which increased its pulse width further. DB PG FROG’s mea-sured pulse width for pulse 1 was 74 fs, which is very close to the GRENOUILLE-measured pulse width of 71 fs (see Fig.6). DB PG FROG-measured pulse 2 to be 148 fs long, in close agreement to the GRENOUILLE measurement of 147 fs (see Fig.7). In addition to the pulse broadening, DB PG FROG and GRENOUILLE also agreed on the phase of the two pulses. Fig. 8. (Color online) (a) The measured DB PG FROG trace 1 for the simple pulse. (b) Retrieved trace 1 with a FROG error of 0.2%. (c) Retrieved pulse intensity and phase in time compared with a GRENOUILLE measurement. (d) The measured spectrum and the spectral phase.
Fig. 9. (Color online) (a) The measured trace 2 for the pulse train from etalon. (b) Retrieved trace 2 with a FROG error of 0.3%. (c) Retrieved pulse intensity and phase in time: peak locations occur at 0 fs, 152 fs, and 319 fs in agreement with GRENOUILLE measurements. (d) The measured spectrum and the spectral phase compared with GRENOUILLE measurements.
We also measured a pair of pulses consisting of a simple pulse and a pulse train, which we generated by placing an etalon in one of the beams before the DB PG FROG. The mea-surements are shown in Figs.8and9. The two traces yielded errors of 0.3% and 0.2%. The simple pulse was measured by DB PG FROG to be 64 fs long, in good agreement with the GRE-NOUILLE measurement of 65 fs (see Fig. 8). The DB PG FROG-measured pulse was, however, slightly more chirped and its spectrum somewhat narrower than that measured by the GRENOUILLE, perhaps due to drift between the two measurements. Also, the imperfect spatial profile of our beam—well known to affect single-shot crossed-beam pulse
measurements—may be an additional factor in the discre-pancy. This is because GRENOUILLE uses a thick crystal (3.5 mm in our case) as the nonlinear medium, which reduces the spatial profile’s effect on FROG measurements [18]. On the other hand, due to the thin (250μm) nonlinear medium in our DB PG FROG, it does not benefit as much from this effect. Thus, the spatial profile of the beam could also affect two measurements differently.
The etalon-generated temporal peak locations of the pulse train measured by DB PG FROG were 152 fs and 319 fs, which agreed well with the measurement made by GRENOUILLE indicating peak locations of 150 fs and 317 fs.
Fig. 10. (Color online) (a) The measured DB PG FROG trace 1 for the chirped pulse. (b) Retrieved trace 1 with a FROG error of 0.2%. (c) Retrieved pulse intensity and phase in time compared with a GRENOUILLE measurement. (d) The measured spectrum and the spectral phase.
In the last measurement, we modified the simple pulse and pulse train setup by chirping the simple pulse with a 2 cm SF11 glass block. The twoGerrors were 0.4% and 0.2%. The pulse width of the chirped pulse measured by DB PG FROG was 133 fs, in good agreement with 136 fs measured by GRENOUILLE (see Fig.10). The temporal peak locations of the pulse train were found to be 157 fs and 318 fs by DB PG FROG. They were very close to the values of 155 fs and 318 fs in the GRENOUILLE measurement, as shown in Fig.11.
4. CONCLUSIONS
We have demonstrated a single-shot method for simulta-neously measuring two potentially very different unknown pulses using one device. DB PG FROG has no known nontri-vial ambiguities, has a reliable algorithm, and is automatically phase-matched for all beam angles, wavelengths, and spectral bandwidths. In simulations, it has proven to be extremely ro-bust, measuring complicated pulses with TBPs of at least∼7 even in the presence of noise. In future work, we will more completely study the DB FROG algorithm performance and also measure more complicated pulses, including, if possible, continuum.
ACKNOWLEDGMENTS
This work was supported by the National Science Foundation, Grant #ECCS-1028825, and the Georgia Research Alliance. We are also thankful to Dongjoo Lee from Swamp Optics for help-ful discussions and support in both the experiments and the preparation of this manuscript.
REFERENCES
1. Q. Cao, X. Gu, E. Zeek, M. Kimmel, R. Trebino, J. Dudley, and R. S. Windeler, “Measurement of the intensity and phase of supercontinuum from an 8 mm-long microstructure fiber,”Appl. Phys. B77, 239–244 (2003).
2. X. Gu, L. Xu, M. Kimmel, E. Zeek, P. O’Shea, A. P. Shreenath, R. Trebino, and R. S. Windeler,“Frequency-resolved optical gating and single-shot spectral measurements reveal fine structure in microstructure-fiber continuum,” Opt. Lett. 27, 1174–1176 (2002).
3. B. A. Richman, K. W. DeLong, and R. Trebino,“Temporal char-acterization of the Stanford mid-IR FEL micropulses by‘FROG’,” Nucl. Instrum. Methods Phys. Res. A358, 268–271 (1995).
4. R. Trebino,Frequency-Resolved Optical Gating: The Measure-ment of Ultrashort Laser Pulses(Kluwer Academic, 2002). 5. R. J. Steriti and M. A. Fiddy, “Blind deconvolution of
im-ages by use of neural networks,” Opt. Lett. 19, 575–577 (1994).
6. K. W. DeLong, R. Trebino, and W. E. White,“Simultaneous re-covery of two ultrashort laser pulses from a single spectro-gram,”J. Opt. Soc. Am. B12, 2463–2466 (1995).
7. J. J. Field, C. G. Durfee, and J. A. Squier,“Blind frequency-resolved optical-gating pulse characterization for quantitative differential multiphoton microscopy,”Opt. Lett.35, 3369–3371 (2010).
8. D. J. Kane, G. Rodriguez, A. J. Taylor, and T. S. Clement,“ Simul-taneous measurement of two ultrashort laser pulses from a single spectrogram in a single shot,” J. Opt. Soc. Am. B14, 935–943 (1997).
9. B. Seifert, H. Stolz, and M. Tasche,“Nontrivial ambiguities for blind frequency-resolved optical gating and the problem of un-iqueness,”J. Opt. Soc. Am. B21, 1089–1097 (2004).
10. J. H. Seldin and J. R. Fienup, “Iterative blind deconvolution algorithm applied to phase retrieval,” J. Opt. Soc. Am. A7, 428–433 (1990).
11. S. Linden, H. Giessen, and J. Kuhl,“XFROG-a new method for amplitude and phase characterization of weak ultrashort pulses,”Phys. Stat. Sol. B206, 119–124 (1998).
12. A. Yabushita, T. Fuji, and T. Kobayashi,“SHG FROG and XFROG methods for phase/intensity characterization of pulses propa-gated through an absorptive optical medium,”Opt. Commun. 198, 227–232 (2001).
13. J.-Y. Zhang, C.-K. Lee, J. Y. Huang, and C.-Y. Pan, “ Sub-femto-joule sensitive single-shot OPA-XFROG and its applica-tion in study of white-light supercontinuum generaapplica-tion,”Opt. Express12, 574–581 (2004).
14. S. Birger and S. Heinrich,“A method for unique phase retrie-val of ultrafast optical fields,”Meas. Sci. Technol.20, 015303 (2009).
15. K. T. Kim, D. H. Ko, J. Park, V. Tosa, and C. H. Nam,“Complete temporal reconstruction of attosecond high-harmonic pulse trains,”New J. Physics12, 083019 (2010).
16. H. Giessen, S. Linden, J. Kuhl, A. Knorr, S. W. Koch, F. Gindele, M. Hetterich, M. Grun, S. Petillon, C. Klingshirn, and N. Peyghambarian, “Coherent high-intensity pulse propagation on a free exciton resonance in a semiconductor,”Phys. Stat. Sol.206, 27–36 (1998).
17. D. N. Fittinghoff, K. W. DeLong, R. Trebino, and C. L. Ladera, “Noise sensitivity in frequency-resolved optical-gating measure-ments of ultrashort pulses,” J. Opt. Soc. Am. B 12, 1955–1967 (1995).
18. D. Lee, Z. Wang, X. Gu, and R. Trebino,“Effect and removal of an ultrashort pulse’s spatial profile on the single-shot measure-ment of its temporal profile,”J. Opt. Soc. Am. B25, A93–A100 (2008).