An integrated assessment of two decades of air pollution
policy
making
in
Spain:
Impacts,
costs
and
improvements.
Michel Vedrenne , Rafael Borge, Julio Lumbreras , Beth Conlan , María Encarnación Rodríguez,
Juan Manuel de Andrés , David de la Paz, Javier Pérez , Adolfo Narros
This paper analyses the effects of policy making for air pollution abatement in Spain between 2000 and 2020
under an integrated assessment approach with the AERIS model for number of pollutants (NO
x/NO
2, PM
10/
PM
2 5, O
3, SO
2, NH
3and VOC). The analysis of the effects of air pollution focused on different aspects: compliance
with the European limit values of Directive 2008/50/EC for NO
2and PM
10for the Spanish air quality management
areas; the evaluation of impacts caused by the deposition of atmospheric sulphur and nitrogen on ecosystems;
the exceedance of critical levels of NO
2and SO
2in forest areas; the analysis of O
3induced crop damage for grapes,
maize, potato, rice, tobacco, tomato, watermelon and wheat; health impacts caused by human exposure to O
3and
PM
2 5; and costs on society due to crop losses (O
3), disability related absence of work staff and damage to build
ings and public property due to soot related soiling (PM
2 5). In general, air quality policy making has delivered
improvements in air quality levels throughout Spain and has mitigated the severity of the impacts on ecosystems
health and vegetation in 2020 as target year. The
fi
ndings of this work constitute an appropriate diagnosis for
identifying improvement potentials for further mitigation for policy makers and stakeholders in Spain.
1. Introduction
Since the adoption in 1999 of the Gothenburg Protocol to abate acid ification, eutrophication and ground level ozone, the Government of Spain has been continuously designing and implementing regulations to abate general air pollution level and comply with its international ob ligations as a signing party Moreover, as a Member State of the European Union, Spain is legally bound by the European regulatory framework on air and environmental quality which has required com plementary policy efforts across several years. In general the policy making process for air quality control in Spain has not been a simple one, too often conditioned by conflicts between national and regional
governments in the distribution of competencies. As a result, a complete and sensible analysis of the effects of these policies not only on emis sions or air quality levels, but on crucial variables such as human health, protection of ecosystems and associated costs has been absent for many years. In 2011, a scientific task force headed by the Centre for Integrated Assessment Modelling (CIAM) conducted a revision of the Gothenburg Protocol using IIASA's Greenhouse gas Air pollution Interactions and Synergies (GAINS) model (TSAP Report #11). The results of this study revealed improvements in the general air quality picture in the Spain (as in Europe) but required establishing new reduction commitments for 2020 (Amann et al , 2012).
with the European limit values for annual nitrogen dioxide (NO2) con centrations in 4 air quality management zones, particulate matter (PM10) daily levels in 11 zones and ground level ozone (O3) above tar get value in 51 zones (Orío et al., 2013). The purpose of this study is to evaluate the impacts and benefits of the general air quality policy mak ing process in Spain between the adoption of the Gothenburg Protocol and the target year for the new reduction commitments in 2020. The ul timate goal is to quantify the global improvement on the air quality question in Spain in order to provide enough guidance on the effective ness of the measures that were undertaken and those that are still to be enforced towards the 2020 target year.
This analysis will be conducted following an integrated assessment (IA) approach, due to the fact that it focuses on holistic modelling per spectives that are able to generate relevant information for environ mental planning without the need to configure complex atmospheric dispersion models under long run times (Moussiopoulos et al., 2009; Oxley et al., 2013). Relying in IA allows quantifying the most relevant ef fects that air quality has on human and environmental health for both past and future scenarios. For the concrete case of this study, this anal ysis was made using the newly embedded modules for the quantifica tion of air quality impacts and costs of the Atmospheric Evaluation and Research Integrated system for Spain (AERIS), combining diagnos tic (past years) and prognostic (future years) approaches (Vedrenne et al., 2014a). Besides assessing compliance with the European Limit Values (LVs) for nitrogen dioxide (NO2) and particulate matter (PM10), the analysis focused on evaluating the consequences of air pol lution such as damage on ecosystems and human health, as well as es timating the economic benefits of policy driven action.
2. Methodology
As already stated in the introduction, the evaluation of the air quality control policies undertaken by the different Spanish administrations in the two decades comprised between 2000 and 2020 was carried out fol lowing the integrated assessment approach of the AERIS model. This section is devoted to explaining the origin and preparation of the neces sary input data for running the model as well as outlining the method ologies and criteria for the estimation of impacts and economic benefits, recently incorporated in AERIS.
2.1. Scenario definition
The policy making activity for air quality control in Spain between 2000 and 2020 was modelled as a set of 11 biannual scenarios that con template a series of concrete control measures resulting in emission re ductions for 5 pollutants considered by AERIS: nitrogen oxides (NOx), sulphur dioxide (SO2), ammonia (NH3), particulate matter (PM10, PM2.5) and volatile organic compounds (VOC). For the years comprised between 2000 and 2012, emission scenarios were derived from official ly reported emission data as well as the concrete control strategies that limited these emissions. To be consistent with the conceptual formula tion of AERIS, annual emission data for these years and the before men tioned pollutants were obtained from the Spanish National Emission Inventory (SNEI) disaggregated by SNAP activity code (MAGRAMA, 2014). The future character of the period between 2014 and 2020 made necessary to rely on emission projections which in the case of
AERIS are to be quantified with the Spain's Emission Projection (SEP) model (Lumbreras et al., 2008). These projections were estimated for each of the pollutants mentioned above, considering only a situation de fined by the current legislation (CLE) in order to analyse the effective ness of the implemented plans, measures and policies in Spain. Additional considerations regarding the nature and potential evolution of the macroeconomic drivers of the projections, specifically those concerning the latest economic crisis in southern Europe were imple mented according to what has been published inMARM (2009)and
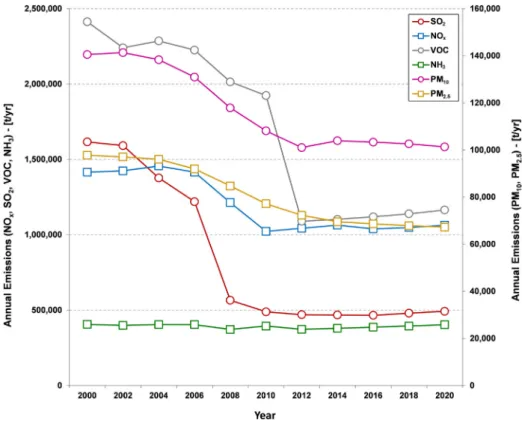
Torrero (2010). The aggregated national emissions (without SNAP sec tor distinction) of the studied pollutants across the studied years are presented inTable 1andFig. 1.
2.2. Control measures
In general, strategic management of atmospheric pollution through policy should be translated into a specific set of control measures that have to be realistic and applicable for a concrete target activity (Vlachokostas et al., 2011). To this respect, a number of actions and measures were identified from the different national air quality man agement plans that have been implemented in Spain in the past years and that are deemed responsible for the experienced trend in the na tional air quality situation. For the future years, it was considered that CLE prevails and that no extraordinary actions to tackle air pollution will take place. For the purposes of this study, the CLE situation in Spain is the one defined by Directive 2008/50/EC and its respective transposition to the national regulatory framework through the Royal Decree 102/2011 and Law 34/2007 (Orío et al., 2013). The concrete measures that were identified are shown inTable 2, and classified as technical (TM) and non technical measures (NTM) following the end of pipe criterion established in the GAINS modelling framework (Schucht, 2005). Due to the difficulty associated with the allocation of a reduction percentage to NTM, these were not considered for the pro jection of emission scenarios (D'Elia et al., 2009). The selected TM were differentiated by the administrative level that applied them (national, regional and local) according to the information submitted by Spain to the European Commission (Questionnaire 461 on Directive 1999/30/ EC).
2.3. Atmospheric dispersion
In order to estimate the effects of air pollution, it is necessary to quantify the concentration levels resulting from atmospheric dispersion and chemical processes across a given domain. To this respect, the IA ap proach followed by AERIS allows quantifyingfinal pollutant concentra tion (NO2, SO2, NH3, PM10and PM2.5) through a series of transfer matrices for individual SNAP sectors as a function of a baseline scenario of emissions (in this case, the emissions reported by the 2007 version of SNEI). These transfer matrices constitute a parameterisation of the WRF CMAQ air quality modelling system configured for Spain as de scribed inBorge et al. (2014)and allow retrieving concentration values for 4500 16 km cells deployed in a 75 × 60 grid centred in 40°N and 3°W which covers the entire Iberian Peninsula and parts of the neighbouring countries (Vedrenne et al., 2014a). The effects of tropo spheric ozone (O3) or the secondary fraction of particles are accounted for in AERIS through a secondary pollutant module that relates them
Table 1
Aggregated annual emissions of the studied pollutants in Spain across the studied years—(annual metric tons per year).
Pollutant 2000 2002 2004 2006 2008 2010 2012 2014 2016 2018 2020
NOx 1,415,399 1,424,453 1,456,473 1,415,782 1,213,378 1,022,917 1,043,164 1,063,994 1,039,300 1,048,280 1,063,324 SO2 1,616,057 1,591,735 1,377,336 1,219,739 565,916 489,434 470,181 468,127 466,069 480,273 492,815
NH3 405,271 398,997 404,289 404,031 371,952 395,139 372,996 379,879 387,211 395,019 403,330
PM2.5 97,764 97,109 96,074 91,993 84,745 77,173 72,302 69,521 68,655 67,884 67,238
to thefinal concentrations of their respective precursors (NOxand VOC for O3and NOx, SO2and NH3for PM10/PM2.5). Concentration values can be obtained in the form of mean annual concentrations or the respective metrics that indicate compliance with the limit values (LVs) contem plated in Directive 2008/50/EC. The concentrations estimated with AERIS are comparable to those produced by its parent air quality model (WRF CMAQ), showing a good one to one statistical correspon dence for all the considered pollutants (correlation coefficient r≤0.97)
and a variation in predictions within 5% and 20% for annual mean con centrations (Vedrenne et al., 2014a). In order to capture the interannual meteorological variations, the transfer matrices of AERIS have been built with runs of WRF CMAQ referred to 2007 and 2014. Due to the inten sive use of computational resources that is required for building a com plete set of transfer matrices, the interannual variations for other years are currently reproduced in AERIS through a statistical calibration with observations from 331 background (urban, suburban and rural) Fig. 1.Aggregated annual emission trends in Spain across studied years (2000–2020).
Table 2
Air quality control measures adopted by Spanish administrations between 2000 and 2012.
Sector Measure Type AERIS Admn. level
Road transport Creation of protected atmosphere urban zones NTM 070000 L
Improving and promoting public transport NTM 070100 N,R,L
Limitation of maximum and variable circulation speed NTM 070000 L
Modification of the vehicle inspection procedures NTM 070000 N
Economic incentives for new and efficient vehicles NTM 070000 N,R
Renovate publicfleets with efficient vehicles NTM 070000 L
Foster technological improvements in heavy duty vehicles TM 0703, 0707* N
Incentivise the use of bicycles—bicycle paths NTM 070100 R,L
Increase road cleaning/washing activities TM 070000 L
Mobility and public transport plans NTM 070100 N,R,L
Industry Implementation of best available techniques (BAT) TM 03*, 04* N,R
Reviewing and updating industry emission limits NTM 03*, 04* N
Promoting change to cleaner fuels—end of coal funding NTM 03*, 04* N,R
Domestic Domestic installation retrofitting TM 020202 R,L
Promoting change to cleaner fuels—discourage solid fuels NTM 020202 N,R,L
Change from individual to district heating TM 020202 R,L
Energy Implementation of best available techniques (BAT) TM 010000 N,R
Promoting change to cleaner fuels—end of coal funding TM 010000 N,R
Economic incentives to renewable energy sources TM 010000 N,R
Construction Limiting dust emissions through technology improvements TM 080800 N,R,L
Implementation of best available techniques (BAT) TM 080800 N,R
Airports Fleet renewals NTM 080500 N
Operational measures (approach, towing, boarding) TM 080500 N
Agriculture Banning agricultural waste burning NTM 100500 N,R,L
Reduce emissions associated with fertilisers TM 1001, 1002 N,R
Reduce emissions from manure operations TM 100500 N,R
monitoring locations across Spain and Portugal. Observations from differ ent years were available at these monitoring stations for the period com prised between 1987 and 2012, so a wide range of meteorological conditions could be reflected when this approach is applied (Vedrenne, in press). The process for building transfer matrices from air quality sim ulations will be revisited in the future to account for updated informa tion (e.g., emission inventories).
2.4. Estimation of impacts
The estimation of impacts is essential for evaluating whether policies resulted in an abatement of the damage to the population, ecosystems and property produced by air pollution. The ability to describe these im pacts is one of the most important advantages of relying on IA tools for the evaluation of the two decades of policy making in Spain. The follow ing sections are dedicated to the description of the methodological ap proaches incorporated into AERIS for the description of such impacts.
2.4.1. Deposition and protection of ecosystems
AERIS is capable of estimating the annual accumulated atmospheric deposition of oxidised and reduced nitrogen as well as sulphur in milligrammes per hectare annum. It consists in a parameterisation of the complex deposition mechanism described by CMAQ , which quan tifies wet and dry deposition of 8 different species of oxidised nitrogen, 3 of reduced nitrogen and 5 of sulphur (Im et al., 2013). The general methodology that was followed to develop such a parameterisation is published inGanev et al. (2008)and modified to the particular condi tions of the Iberian Peninsula according toMartín et al. (2011). The comparison of the estimates of accumulated deposition of species with AERIS and CMAQ revealed a good performance, with a correlation coefficients of 0.99 for oxidised nitrogen, reduced nitrogen and sulphur and an expected variation in predictions between 7% and 8% (Vedrenne, in press).
The negative effects of atmospheric deposition on ecosystems have, namely eutrophication and acidification are quantified in AERIS through the exceedance of a critical load (CL) (Posch et al., 2001). CLs are indica tors of ecosystem sensitivity with a particular relevance under the framework imposed by the Convention of Long range Transboundary Air Pollution (CLRTAP) and the revision of the National Emission Ceil ings Directive (NEC) (Reinds et al., 2008) and defined as an estimate of an exposure below which significant harmful effects do not occur at present knowledge (Hettelingh et al., 2013). AERIS is able to quantify exceedances according to two types of CL: for eutrophication effects through the CL for nutrient nitrogen CLnut(N) and for acidification ef fects through an acidity trapezoidal function of CL for sulphur and nitro gen (CLmax(S), CLmin(N) and CLmax(N)) according to the general methodology presented inPosch et al. (2001). Additionally, the current version of AERIS is able to quantify impacts caused by deposition on eco systems in the form of an accumulated average exceedance (AAE) in order to account for ecosystem area gap closures.
The estimation and mapping of CL in the Iberian Peninsula were de rived from atmospheric deposition estimates produced by GAINS model (IIASA) and the Coordination Centre for Effects (CCE) for a given and well known emission scenario and further processed statistically. This process was carried out through the combination of maps of soils, land cover and forest growth regions (Schelhaas et al., 1999; Panagos et al., 2011; Henry and Aherne, 2014).
2.4.2. Impacts on crops and vegetation
The harmful effects of air pollution on plants and trees are also taken into account by AERIS, focusing on the damage to forests caused by the exceedance of critical levels (Cl) of NO2and SO2as well as on the de crease in crop production caused by O3for a number of plant species. The modelling approach for describing the impacts of O3on crops is based on the measure of risk described by exposure response (E R) functions (Alonso et al., 2008). To this respect, E R functions based on
the daylight accumulated dose over a 40 ppb threshold (AOT40) were obtained for the most important agricultural and horticultural crops that Spain produces, namely wheat (Triticum aestivum), maize (Zea mays), rice (Oryza sativa), potato (Solanum tuberosum), sunflower
(Helianthus annuum), tomato (Solanum lycopersicum), grapes (Vitis vi
nifera), tobacco (Nicotiana tabacum) and watermelon (Citrullus lanatus)
(Mills et al., 2007; Mirasgedis et al., 2008; Van Dingenen et al., 2009). Spatial crop productions were derived as a function of harvested areas and gross crop production (NUTS 2 statistical level), incorporating spe cific geographic covers from EarthStat and CORINE Land Cover 2002 ac cording to Monfreda et al. (2008). The general approach for the estimation of crop losses based on AOT40values has been previously analysed inde Andrés et al. (2012)andVedrenne et al. (2014b)for wheat.
The evaluation of impacts on forests is made by inspecting the de gree of exceedance of the critical levels (Cl) of NO2and SO2, defined as a situation when either the annual mean concentration or the winter half year mean concentration for the before mentioned pollutants is greater than 30μg/m3and 20
μg/m3respectively. These exceedances are only quantified for those cells which contain one or more of the following forest categories according to CORINE Land Cover 2002: broadleaved deciduous forests, broadleaved evergreen forests, mixed leaf type forests and needle leaved evergreen forests (Pilli, 2012).
2.4.3. Impacts on human health
In the latest version of AERIS, the estimation of the health related impacts is limited to particulate matter (PM2.5) and tropospheric ozone (O3). The general conceptual framework that has been followed is the one addressed by GAINS and published inMechler et al. (2002)
andRao et al. (2012). This methodology allows AERIS to provide esti mates on the change in statistical life expectancy per person (Δec), the total amount of life years lost (YOLL) and the disability adjusted life years (DALY) for PM2.5related cardiopulmonary impacts and the annual cases of premature mortality (Mort) produced by exposure to O3. The estimation of health affectations by air pollutants depends on the quan tification of the respective relative risks, whose values in this case stemmed from two epidemiological studies for exposure to PM2.5 (Pope et al., 2002) and to O3(Jerrett et al., 2009; Heal et al., 2013). The estimation ofΔecand YOLL requires the definition of a survival function, which for the case of AERIS was determined from mortality rates which were taken from the World Health Organization (WHO) mortality data and statistics database for cohorts aged between 30 and 60 in Spain, Portugal, Andorra, France, Algeria and Morocco between the years 1990 and 2010 (WHO, 2014). The quantification of cardiopulmonary1DALY required the definition of raw disability values
obtained from the Mortality and Burden of Disease Estimates for WHO Member States in 2004 under egalitarian principles (Mathers et al., 2006). Additional considerations for the estimation of health impacts in Spain were made according toBoldo et al. (2012). Discussions on the representativeness of the estimates that AERIS provides on the be fore mentioned health impacts have been published inVedrenne et al. (2014b).
2.5. Estimation of costs and benefits
The valuation of air pollution costs and benefits associated to policy making in AERIS is presently carried out only for health and non health damage variables in millions of euros per year (M€/yr). The cost to indi viduals and health services due to air pollution disability (restricted ac tivity days) was modelled for PM2.5under an impact pathway approach adapted to Spain (Dixon, 1998; Defra, 2013). The valuation of non health damage was carried out for crop losses (O3related) and building soiling (PM2.5) according toWatkiss et al. (2001). Market prices for
1
cereals (wheat, maize and rice) were taken from local data published by the regional government of Castille and prices for the rest of the crops (at origin) were drawn from the Ministry of Finance (JCL, 2014; MEC, 2014). Costs were estimated for the 11 biannual scenarios and referred to 2014 using a nominal annual interest rate published by the Bank of Spain of 0.55% (BDE, 2014). Prices were increased in 2.5% per annum to account for inflation, and further increased by 2% per annum to reflect the assumption that willingness to pay for health will rise in line with economic growth assuming a similar behaviour in Spain to that of the United Kingdom (Defra, 2011). A mean Sterling to Euro exchange rate was calculated from the 2012 daily spot exchange rates published by the Bank of England (BE, 2014). Damage costs on ecosystems, soils or water bodies are not being presently addressed in AERIS.
3. Results and discussion
3.1. Analysis of air quality levels and compliance with Directive 2008/50/EC LVs
As it was already introduced inSection 2.1, the different sets of mea sures implemented by the Spanish authorities at the three administra tive levels (national, regional and local) have resulted in a general decrease in the emission or airborne pollutants (NOx, SO2, NH3, PM10, PM2.5, VOC) in the period between 2000 and 2014, while the period be tween 2014 and 2020 does not experience a substantial change in the emissions for these pollutants (Fig. 1). These small changes in emissions can be explained by the fact that most of the policies considered to be the‘low hanging fruits’have already been applied in Spain (e.g., limita tion of the sulphur content in fuels) (Amann et al., 2011). Moreover, it has been assumed that the deterioration of the economy in Spain due to thefinancial crisis will continue to be an obstacle for any additional substantial reductions in the emissions of pollutants, mostly caused by budget (public and private) limitations or unfavourable behaviour changes in the population (Saffari et al., 2013).
Modelling such emission reductions with AERIS allowed assessing compliance for the 126 air quality management zones of Spain (exclud ing the Canary Islands)2for the hourly and annual LVs for NO2and for
the daily and annual LVs for PM10. Despite the fact that other pollutants are regulated by Directive 2008/50/EC, analysis was limited to NO2and PM10as only compliance with their respective LV was analysed in IIASA's TSAP Report #11. Fig. 2 shows the number of zones in
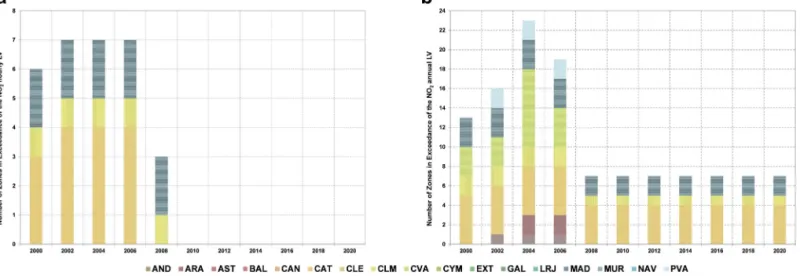
exceedance of the NO2LVs for the period between 2000 and 2020. For both LVs, a decrease in the number of exceeding zones can be seen across the studied years, from a total of 6 zones in infringement of the NO2hourly LV in 2000 to no zones in 2020 and from 13 zones in in fringement of the NO2annual LV in 2000 to 5 zones in 2020 (with max ima being 7 and 21 zones respectively). Most of these zones are located in Catalonia (CAT) and Madrid (MAD) on which the largest urban ag glomerations in Spain are located (Madrid and Barcelona). These two communities account for 5 and 3 air zones above the NO2annual LV in 2020. The number of zones in infringement of the PM10LVs between 2000 and 2020 are shown inFig. 3. Although similar to the number of zones above the NO2LVs, the decrease in the number of zones in in fringement of the PM10LVs has been modest (28 zones in 2000 against 21 zones in 2020 above the daily LV and 3 zones an 2000 against no zones in 2020 above the annual LV). Most of the zones in infringement with the PM10daily LV are located in Andalusia (AND), Asturias (AST), Catalonia (CAT), Galicia (GAL), Madrid (MAD) and Murcia (MUR), while the zones above the annual LV concentrate in Catalonia (CAT), the Valencian Community (CVA) and Galicia (GAL). In summary, the de crease in the air quality zones in infringement is in line with the de creasing air quality trends observed in Spanish monitoring locations for NO2and PM10(Querol et al., 2014). Due to the inability of AERIS to quantify the natural contribution of Saharan dust to the general air qual ity levels, no discounts on the PM10concentrations have been made to reduce the number of zones in non compliance. This subtraction is crit ical for those zones located in Southern Spain, which are especially vul nerable to high dust episodes (de la Paz et al., 2013).
The number of zones quantified by AERIS for Spain (Figs. 2 3) con sists in a conservative estimate that does not take into consideration the different local factors (i.e., meteorology, emplacement, pollution hotspots) that drive monitoring locations to register high concentra tions. This results in the fact that the estimate of zones in infringement by the model does not necessarily coincide with the official number of zones that exceeded the NO2and PM10LVs between 2004 and 2012 ac cording to Questionnaire 416. For example, in 2012 the number of zones above the NO2hourly LV quantified by AERIS was 0, while Spain official ly reported 2 zones in infringement (ES1301 and ES1309). Despite the abovementioned, the estimates of AERIS are underpinned by a robust parameterisation of a CMAQ system applied to the Iberian Peninsula, which has been validated against observations (Vedrenne et al., 2014a,b) and which in turn has been used for assessing the compliance of the air quality management zone of the city of Madrid (ES1301) with the NO2LVs (Borge et al., 2014). The evolution of the rest of pollutants simulated by AERIS (SO2, PM2.5, NH3, O3), which are also regulated by Directive 2008/50/EC through limit or threshold values, will be analysed 2
Considering a total number of zones in Spain of 134 as of 2010.
indirectly in the following sections through the different impacts they produce on other aspects such as health or ecosystems.
3.2. Analysis of the contribution of the autonomous communities to air quality levels
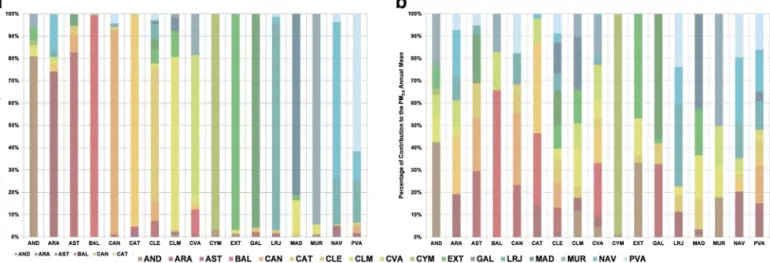
It is often found that air quality management zones do not achieve compliance because of the contribution of transboundary air pollution from the nearby regions. As a consequence, the average contributions of the individual autonomous communities to the air quality levels of NO2 and PM2.5 between the years 2000 and 2020 are presented (Fig. 4). As it can be seen, the degree of contribution of the different au tonomous communities is different and pollutant specific. The annual means of NO2of most of the autonomous communities are largely de termined by the emissions located in their territory, ranging from 62% for the Basque Country (PVA) and 99% for the Balearic Islands (BAL) (Fig. 4a). In the case of the annual means of PM2.5, the degree of contri bution of the emissions located in the territory of the autonomous com munity is variable but not as high as for NO2. The lowest degree of contribution is observed for Castille and Leon (CLE 12%) and the highest for Ceuta and Melilla (CYM 98%). The case of contributions to the PM2.5 levels for CLE is extreme, as annual means are the product of the emis sions produced in 10 communities (Aragon, Asturias, Cantabria, Castilla La Mancha, Extremadura, Galicia, La Rioja, Madrid, Navarre and the Basque Country) (Fig. 4b). The information provided by the
contribution analysis is able to hint on the origins of air pollution at a given air quality management zone in order to orientate efforts from local authorities towards abating emissions from sources under their control.
3.3. Analysis of deposition and impacts on ecosystems
The reduction in emissions registered in Spain between 2000 and 2020 brought about a reduction in the atmospheric deposition of oxidised nitrogen (Nox) and sulphur (S), as well as a slight increase in the deposition of reduced nitrogen (Nred). The reduction of sulphur de position equalled 63% in the studied period, from an initial deposition of 550,000 mg/m2·yr in 2000 to approximately 200,000 mg/m2·yr in 2020. The evolution of the deposition of oxidised nitrogen was modest, descending from an initial 240,000 mg/m2·yr in 2000 to a final 210,000 mg/m2·yr ( 14%), while the deposition of reduced nitrogen in creased from 180,000 mg/m2·yr in 2000 to 270,000 mg/m2·yr in 2020 (+ 50%). While the decrease in the atmospheric deposition of S and Noxis directly related to a decrease in the emissions of SO2and NOxin the studied years ( 69% and 24% respectively Fig. 1), the increase in the deposition of Nredis associated with the deposition chemistry considered by CMAQ, which in limited conditions of SO2and NOx(as a product of emission reductions) and almost constant levels of NH3 ( 0.5% between 2000 and 2020), enhances its deposition as ammonium species (Sotiropoulou et al., 2004).
Fig. 3.Number of air quality management zones above the PM10a) daily and b) annual LVs between 2000–2020 simulated with AERIS (without natural subtraction).
The reduction in the total deposition budgets registered for the years between 2000 and 2020 produced a similar tendency in the respective excess depositions (as average accumulated exceedances). In the case of the excess acid deposition (Sacid,AAE), a clear decrease has been witnessed in Spain from an initial 640,000 eq./ha·yr in 2000 to afinal 430,000 eq./ha·yr in 2020 ( 32%). The case of the excess nitrogen depo sition (Nnut,AAE) shows an increase in the studied year from 325,000 eq./ha·yr in 2000 to 490 eq./ha·yr in 2020 (+ 51%), after reaching a minimum deposition in 2012 of 280,000 eq./ha·yr (Fig. 5a). In the case of excess acid deposition of nitrogen and sulphur species on soils (ExcSoils,NOx, ExcSoils,S), decreases are observed between 2000 and 2020. In the case of ExcSoils,NOx, excess deposition was reduced from 3650 eq./ha·yr to 2500 eq./ha·yr ( 31%) while for ExcSoils,Sthe de crease was more noticeable, namely 72% (9000 eq./ha·yr in 2000 against 2500 eq./ha·yr in 2020). In general, it was observed that policy directed towards abatement of airborne pollutants has reduced signifi cantly the impacts of sulphur on ecosystems due to deposition, while the impacts caused by nitrogen species experienced a more modest re duction. In every case, the reduction patterns of the impacts on ecosys tems seem to correspond with those of emission abatements between 2000 and 2020.
3.4. Analysis of impacts on crops and vegetation
The abatement of NOxand SO2emissions in the 20 year period be tween 2000 and 2020 has reduced the phytotoxic impact that these pol lutants have on forests. The decreasing trend of forest area above NO2 and SO2critical levels (Cl) is shown inFig. 5b. In 2000, forest land above 20μg/m3of SO2was approximately 22,000 km2and reached a minimum level in 2008 of 2500 km2( 88%) which will be kept unal tered until 2020. The reason for this substantial decrease in the exposi tion of forests to SO2is the ban imposed on high sulphur gasoil in 2000 and its further revisions in 2005 and 2009 which reduced the emissions of sulphur into the atmosphere. The area of forests above 30μg/m3of NO2showed a moderate change in the period between 2000 and 2020, from approximately 13,000 to 10,000 km2( 23%). Both tenden cies seem to follow an analogous evolution pattern with that of SO2 and NOxemissions (Fig. 1).
Reductions in the emissions of NOxand VOC have reduced crop damage due to vegetal exposure to O3.Fig. 6depicts the trend of these reduced impacts in terms of the monetary losses due to crop damage in Spain. It is worth noting that the comparison was carried out in eco nomic terms due to the different annual yields of the individual crops to attenuate the effect of the cultivated land extension and to reflect their market value. In 2000 the total losses due to O3induced crop damage
accounted 20.7 million€2014, which were reduced to 18.8 million
€2014in 2020 ( 11%). The bulk of economic losses concentrate on wheat (10.5 m€2014in 2000 vs. 9.6 m€2014in 2020), followed by potato (2.9 m€2014in 2000 vs. 2.7 m€2014in 2020) and grapes (2.6 m€2014in 2000 vs. 2.3 m€2014in 2020). The total mass of wheat lost in the studied period accounted 510,000 metric tonnes, with 35% of these losses con centrated in Castilla y León only (180,000 tonnes). Potato losses added up to a total of 120,000 tonnes, concentrating mainly in Galicia (18%) while total grape losses were 118,000 tonnes with 45% of them occur ring in Castilla La Mancha (54,000 tonnes). Policy making activity that has taken place in the last 20 years in Spain has prevented farmers and producers from losing 1.9 m€2014, which could have been externalised to consumers through increases in food prices. Additional ly, the abatement of emissions has increased commodity offer in ap proximately 2 million metric tonnes.
3.5. Analysis of impacts on human health
The quantification of impacts on human health is an essential com ponent for air pollution integrated assessment. Stakeholders might be interested in assessing the effectiveness of policies directed towards emission abatement and control on public health, which is also para mount in decision making (Tasićet al., 2012). The emission reductions between 2000 and 2020 have produced benefits in human health for the two pollutants characterised by epidemiological studies: PM2.5and O3(Fig. 7). The impacts of O3in mortality (expressed as the number of deaths) in Spain have not improved in the studied period; the modelled mortality in 2000 (732 cases) was marginally increased in 7 additional deaths in 2020. The highest improvement is observed in the period between 2000 and 2020 (6 less mortality cases), while the worst period was between 2006 and 2008 (4 additional deaths to the 2000 levels and 14 deaths compared to the previous biannual period). The highest mortality cases are allocated in the autonomous communi ties of Andalusia (AND), Catalonia (CAT) and Madrid (MAD). This is re lated to the presence of large urban centres (i.e., Madrid, Barcelona and Seville) in such communities, their location in high ozone regions in Spain and their high populations (Baldasano et al., 2011; Querol et al., 2014). Additionally, the variations in the emissions of NOxand VOC do not seem to decrease in an analogous pattern, showing a more restric tive control for VOC than for NOx(Fig. 1). Despite this, VOC emissions are always greater than NOxwhich could derive in high VOC/NOxratios that complicate O3control (Vivanco, 2009; Dimitriou and Kassomenos, 2015). The relatively negligible increase in O3mortality cases is also re lated to the presence of high regional hemispheric backgrounds in the Mediterranean basin (Heal et al., 2013).
Regarding the evolution of PM2.5related impacts, improvements have been witnessed as a consequence of the abatement of primary particle emissions as well as NOx, SO2and NH3which contribute to the total par ticle mass (Fig. 1). FromFig. 7, only one biannual period produced worse levels of mortality (measured as YOLL) than 2000 (230,700 years), name ly 2000 2002 (233,200 years). After 2002 improvements with respect to 2000 have been witnessed, reaching a maximum improvement in the pe riod between 2006 and 2008 (203,000 years and 5087 years won with re spect to 2004 2006). After 2012, the number of years lost due to PM2.5air pollution reaches a level of approximately 195,500 years which is main tained until 2020 and registering marginal biannual improvements. The total number of years won due to air pollution management in Spain in the studied period was 36,271 years, most of which are concentrated in the autonomous communities of Andalusia (AND, 16%), Catalonia (CAT, 17%), Valencian Community (CVA, 9%), and Madrid (MAD, 18%). Ac cording toBoldo et al. (2014), PM2.5related mortality in Spain is heavily influenced by road traffic emissions and particularly intense in urban environments. In this sense, health improvements become more evi dent for these autonomous communities due to the fact that these
contain the largest urban centres in Spain, and concentrate 47% of the total Spanish population. The contribution of Saharan dust to adverse health was not studied because it has been observed that particles orig inating from long range transport are less toxic than those originated by local sources (e.g., road traffic) (Samoli et al., 2011).
3.6. Analysis of air quality costs
Policy makers are often confronted with the need of quantifying the cost that poor air quality has on society, particularly if this has an impact on public spending. For the purposes of this paper, the costs of address ing the consequences that air quality has on crops, human health and soiling have been quantified for each of the 11 biannual scenarios (2000 2020). Savings were quantified as the differences between the incurred costs for every scenario and the costs of a do nothing scenario in 2000 (Fig. 8). These savings can be interpreted as the amount of money whose expenditure is avoided to stakeholders (either authori ties or individuals) due to air quality policy making. As it can be seen fromFig. 8, the total savings accrued in the studied period due to
Fig. 7.Biannual and total improvements in a) O3mortality (number of deaths) and PM2.5mortality (YOLL) between 2002 and 2020 by autonomous community. Negative values denote increases in mortality.
emissions abatement rose to 5,463,362€2014, growing biannually since 2008 at an almost constant 13%. Of these savings, an average of approx imately 40% of these savings is due to health improvements (2.1 m
€2014). The highest improvement in savings is achieved in the period be tween 2006 and 2008, which is in line with the improvement in YOLL for that same period as shown inFig. 7. It should be noted that the quan tification of health related costs is partial in the sense that it only con siders low severity disability (restricted activity dates), whose costing is only related with decreases in wage rates due to work absence. Costs due to high severity disabilities such as hospital admissions, emergency room visits or illness in children due to PM2.5or other pollut ants are not being considered at present.
As it was already discussed inSection 3.4, the impact that O3had on crops was mitigated in monetary terms produced savings of 1.9 m€2014 in the studied period, after continuous reductions (Fig. 6). In average, the contribution of crop impact mitigation is approximately 39%. Soiling costs due to the soot fractions of PM2.5are associated with build ing cleaning and restoration and account for 25% of the total savings (1.3 m€2014). As with health impacts the greatest improvement is ob served between 2006 and 2008 (+18%). Despite the abovementioned, the savings quantified in this section are gross as AERIS does not quan tify abatement costs (i.e., the costs associated with the implementation of mitigation measures).
4. Conclusions
The study of twenty years of policy making for air pollution control and management in Spain with the AERIS model for integrated assess ment has allowed quantifying the effectiveness of the efforts directed towards the abatement of pollutants between 2000 and 2020. In gener al, the witnessed reductions in the emissions of air pollutants have brought about benefits in the different aspects that are encompassed in the air pollution question. Regarding the compliance of Spain with the European air quality limit values for NO2and PM10specified by Di rective 2008/50/EC, the number of zones in infringement exhibited a sustained decrease in the studied period. The decreases in the NO2levels are due principally to measures that concentrate on road traffic and general combustion processes (industrial and domestic), while the mit igation of PM10concentrations is also associated with power generation and off road sources. Despite this, it has been anticipated that a number
of air quality management zones will still be in infringement of such limit values under CLE scenarios in 2020 for both pollutants. The analy sis of the contribution of the autonomous communities to such exceedances suggested that the air quality levels are not substantially influenced by transboundary dispersion from neighbouring communi ties, being these contributions generally higher for NO2than for PM2.5.
Decreases in the impacts that air quality has on other aspects such as atmospheric deposition, damage on crops and forests and affectation of human health have also been witnessed. Regarding impacts on ecosys tems due to atmospheric deposition (exceedance of critical loads) the affectation due to sulphur has been widely mitigated in the studied pe riod, an issue that is directly related to the restrictions imposed on sul phur contents of fuels and to the shift to cleaner fuels in the power generation and industrial sectors. The abatement of nitrogen related deposition was more modest due to the increasing difficulty associated with controlling NOxemissions. Analogous decreases were observed for the area of forests above critical levels of NO2and SO2. The analysis of impacts on crops also evidenced a decrease in the monetary losses due to O3induced crop damage due to the control of NOxand VOC emissions, avoiding the potential externalisation of approximately 1.9 m€2014to the commodities market. When considering health im pacts, the degree of impacts produced by human exposure to O3re vealed a very marginal increase in the 20 year period (6 additional deaths), basically due to unharmonised control strategies for VOC and NOxthat did not limit the formation of O3and the high hemispheric background levels in the region. Regarding PM2.5related health impacts, these were substantially decreased as evidenced by the number of years of life won by population groups and to the increasing savings on work related absences due to air pollution related disability. Finally, under taking air quality actions directed towards emission abatement brought about gross savings in the order of 5.4 m€2014.
The evaluation also revealed that impacts are still being produced and that there is still enough clearance for air quality improvements in 2020. However, it should be noted that the improvements in the general air quality of Spain between 2000 and 2020 were achieved under mod erate ambition levels and without considering departures from current legislation. The results presented in this paper provide a useful starting point for identifying key issues on which further abatement can be allo cated in order to deliver better air quality in Spain in the forthcoming years.
Disclaimer
The research andfindings presented in this paper are responsibility of the authors and do not necessarily reflect the position or views of Ricardo AEA. The AERIS model is intellectual property of the Technical University of Madrid. There is no conflict of interest.
Appendix A
Table A.1
Sectors and pollutants currently considered by AERIS.
SNAP code
Activity name NOx SO2 PM10 PM2.5 NH3
010000 Coal-fired power plantsN300 MW ● ●
020202 Residential plantsb50 MW ● ● ● ●
030000 Combustion in manufact.—area sources
● ●
040000 Production processes—area sources ●
070101 Passenger cars—highway driving ● ● ●
070103 Passenger cars—urban driving ● ● ●
070201 LDVb3.5—highway driving ● ● ●
070203 LDVb3.5—urban driving ● ● ●
070301 HDVN3.5 t—highway driving ● ● ●
070303 HDVN3.5 t—urban driving ● ● ●
0707 + 08
Break, tire and road abrasion processes
● ●
080500 Airports LTO/yrN10.000 ●
080600 Agriculture (machinery) ● ● ● ●
080800 Industry (machinery) ● ● ● ●
100101 Culture with fertilisers—permanent crops
●
100102 Culture with fertilisers—arable crops ●
100500 Other agricultural activities ● ● ●
110000 Other sources and sinks ●
– Portugal (total) ● ● ● ● ●
– International ship transit ● ●
Table A.2
Spanish autonomous communities considered by AERIS.
Code Autonomous community Official name
AND Andalusia Andalucía
ARA Aragon Aragón
AST Asturias Principado de Asturias BAL Balearic Islands Islas Baleares/Illes Balears
CAN Cantabria Cantabria
CAT Catalonia Cataluña/Catalunya CLE Castille and Leon Castilla y León CLM Castille-La Mancha Castilla-La Mancha
CVA Valencian Community Comunidad Valenciana/Comunitat Valenciana CYM Ceuta and Melilla Ciudades Autónomas de Ceuta y Melilla
EXT Extremadura Extremadura
GAL Galicia Galicia
LRJ La Rioja La Rioja
MAD Community of Madrid Comunidad de Madrid MUR Region of Murcia Región de Murcia
NAV Navarre Comunidad Foral de Navarra/Nafarroako Foru Komunitatea
PVA Basque Country País Vasco/Euskal Herria
References
Alonso, R., Elvira, S., Sanz, M.J., Gerosa, G., Emberson, L.D., Bermejo, V., Gimeno, B.S., 2008.
Sensitivity analysis of a parameterization of the stomatal component of the DO3SE model forQuercus ilexto estimate ozonefluxes. Environ. Pollut. 155, 473–480.
Amann, M., Bertok, I., Borken-Kleefeld, J., Cofala, J., Heyes, C., Höglund-Isaksson, L., Klimont, Z., Nguyen, B., Posch, M., Rafaj, P., Sandler, R., Schöpp, W., Wagner, F., Winiwarter, W., 2011.Cost-effective control of air quality and greenhouse gases in Europe: Modeling and policy applications. Environ. Model. Softw. 26, 1489–1501.
Amann, M., Bertok, I., Borken-Kleefeld, J., Cofala, J., Heyes, C., Höglund Isaksson, L., Klimont, Z., Rafaj, P., Schöpp, W., Wagner, F., 2012.Environmental improvements of the 2012 revision of the Gothenburg protocol. CIAM Report 1/2012. Centre for Inte-grated Assessment Modelling (CIAM)—International Institute for Applied Systems Analysis (IIASA), Laxenburg.
Baldasano, J.M., Pay, M.T., Jorba, O., Gassó, S., Jiménez-Guerrero, P., 2011.An annual as-sessment of air quality with the CALIOPE modeling system over Spain. Sci. Total En-viron. 409, 2163–2178.
Banco de España (BDE), 2014. Tipos de Interés y Tipos de Cambio. Mercado Interbancario, Madrid (Available at:http://www.bde.es/webbde/es/estadis/infoest/tipos/tipos. html).
Bank of England (BE), 2014. Statistical Interactive Database—daily spot exchange rates against Sterling.http://www.bankofengland.co.uk/boeapps/iadb/Rates.asp(London, Available at:).
Boldo, E., Linares, C., Lumbreras, J., Borge, R., Narros, A., García-Pérez, J., Fernández-Navarro, P., Pérez-Gómez, B., Aragonés, N., Ramis, R., Pollán, M., Moreno, T., Karanasiou, A., López-Abente, G., 2012.Health impact assessment of a reduction in ambient PM2.5levels in Spain. Environ. Int. 37, 342–348.
Boldo, E., Linares, C., Aragonés, N., Lumbreras, J., Borge, R., de la Paz, D., Pérez-Gómez, B., Fernández-Navarro, P., García-Pérez, J., Pollán, M., Ramis, R., Moreno, T., Karanasiou, A., López-Abente, G., 2014.Air quality modeling and mortality impact offine particles reduction policies in Spain. Environ. Res. 128, 15–26.
Borge, R., Lumbreras, J., Pérez, J., de la Paz, D., Vedrenne, M., de Andrés, J.M., Rodríguez, M.E., 2014.Emission inventories and modeling requirements for the development of air quality plans. Application to Madrid (Spain). Sci. Total Environ. 466–467, 809–819.
D'Elia, I., Bencardino, M., Ciancarella, L., Contaldi, M., Vialetto, G., 2009.Technical and non-technical measures for air pollution emission reduction: the integrated assessment of the regional air quality management plans through the Italian national model. Atmos. Environ. 43, 6182–6189.
de Andrés, J.M., Borge, R., de la Paz, D., Lumbreras, J., Rodríguez, M.E., 2012. Implementa-tion of a module for risk of ozone impacts assessment to vegetaImplementa-tion in the Integrated Assessment Modelling system for the Iberian Peninsula. Evaluation for wheat and Holm oak. Environ. Pollut. 165, 25–37.
de la Paz, D., Vedrenne, M., Borge, R., Lumbreras, J., de Andrés, J.M., Pérez, J., Rodríguez, E., Karanasiou, A., Moreno, T., Boldo, E., Linares, C., 2013.Modelling Saharan dust trans-port into the Mediterranean basin with CMAQ. Atmos. Environ. 70, 337–350.
Department of Environment, Food & Rural Affairs (Defra), 2011.Air Quality Damage Cost Guidance (London).
Department of Environment, Food & Rural Affairs (Defra), 2013.Impact Pathway Guid-ance for Valuing Changes in Air Quality (London).
Dimitriou, K., Kassomenos, P., 2015.Three year study of tropospheric ozone with back tra-jectories at a metropolitan and a medium scale urban area in Greece. Sci. Total Envi-ron. 502, 493–501.
Dixon, J.A., 1998.The Economic Valuation of Health Impacts. The World Bank, Washington D.C.
Ganev, K., Prodanova, M., Syrakov, D., Miloshev, N., 2008.Air pollution transport in the Balkan region and country-to-country pollution exchange between Romania, Bulgaria and Greece. Ecol. Model. 217, 255–269.
Heal, R.M., Heaviside, C., Doherty, R.M., Vieno, M., Stevenson, D.S., Vardoulakis, S., 2013.
Health burdens of surface ozone in the UK for a range of future scenarios. Environ. Int. 61, 36–44.
Henry, J., Aherne, J., 2014.Nitrogen deposition and exceedance of critical loads for nutri-ent nitrogen in Irish grasslands. Sci. Total Environ. 470–471, 216–223.
Hettelingh, J.P., Posch, M., Velders, G.J.M., Ruyssenaars, P., Adams, M., de Leeuw, F., L ükewille, A., Maas, R., Sliggers, J., Slootweg, J., 2013.Assessing interim objectives for acidification, eutrophication and ground-level ozone of the EU National Emission Ceilings Directive with 2001 and 2012 knowledge. Atmos. Environ. 75, 129–140.
Im, U., Christodoulaki, S., Violaki, S., Zarmpas, P., Kocak, M., Daskalakis, N., Mihalopoulos, N., Kanakidou, M., 2013.Atmospheric deposition of nitrogen and sulfur over southern Europe with focus on the Mediterranean and the Black Sea. Atmos. Environ. 81, 660–670.
Jerrett, M., Burnett, R.T., Pope, C.A., Ito, K., Thurston, G., Krewski, D., Shi, Y., Calle, E., Thun, M., 2009.Long-term ozone exposure and mortality. N. Engl. J. Med. 360, 1085–1095.
Junta de Castilla y León (JCL), 2014.Precios de los Cereales en Castilla y León. Servicio de Estadística, Estudios y Planificación AgrariaConsejería de Agricultura y Ganadería, Valladolid.
Lumbreras, J., Borge, R., de Andrés, J.M., Rodríguez, M.E., 2008.A model to calculate con-sistent atmospheric emission projections and its application to Spain. Atmos. Environ. 42, 5251–5266.
Martín, F., Vivanco, M.G., Palomino, I., Garrido, J.L., González, M.A., 2011.Cálculo de Mapas de Depósito de Contaminantes. Año 2008. Encomienda de Gestión 2010–2014 entre el Ministerio de Medio Ambiente y el CIEMAT para trabajos en materia de calidad del aire, energía y evaluación ambiental. Actuación 2: Aplicación de la modelización en la evaluación de la calidad del aire en España. Centro de Investigaciones Energéticas, Medioambientales y Tecnológicas (CIEMAT), Madrid. (Available at: ftp://ftp.ciemat.es/pub/modelizacion/Reevaluacion-calidad-aire-2010/ deposito_2010-ciemat.pdf).
Mathers, C.D., López, A.D., Murray, C.J.L., 2006.The burden of disease and mortality by condition: data, methods and results for 2001. In: López, A.D., Mathers, C.D., Ezzati, M., Murray, C.J.L., Jamison, D.T. (Eds.), Global Burden of Disease and Risk Factors. Oxford University Press, New York, pp. 45–240.
Mechler, R., Amann, M., Schöpp, W., 2002.A methodology to estimate changes in statisti-cal life expectancy due to the control of particulate matter air pollution. Interim Re-port IR-02-035. International Institute for Applied Systems Analysis (IIASA), Laxenburg.
Mills, G., Buse, A., Gimeno, B., Bermejo, V., Holland, M., Emberson, L., Pleijel, H., 2007.A synthesis of AOT40-based response functions and critical levels of ozone for
agricul-tural and horticulagricul-tural crops. Atmos. Environ. 41, 2630–2643.
Ministerio de Economía y Competitividad (MEC), 2014.Información de Precios Origen-Destino (2004–2014). Secretaría de Estado de Comercio, Madrid.
Ministerio de Medio Ambiente y Medio Rural y Marino (MARM), 2009.Proyección de emisiones de contaminantes atmosféricos en España. Resumen. Dirección General de Calidad y Evaluación Ambiental (Madrid).
Mirasgedis, S., Hontou, V., Georgopoulou, E., Sarafidis, Y., Gakis, N., Lalas, D.P., Loukatos, A., Gargoulas, N., Mentzis, A., Economidis, D., Triantafilopoulos, T., Korizi, K., Mavrotas, G., 2008.Environmental damage costs from airborne pollution of industrial activities in the greater Athens, Greece area and the resulting benefits from the introduction of BAT. Environ. Impact Assess. Rev. 28, 39–56.
Monfreda, C., Ramankutty, N., Foley, J.A., 2008.Farming the planet: 2. Geographic distri-bution of crop areas, yields, physiological types and net primary production in the year 2000. Glob. Biogeochem. Cycles 22, GB1022.
Moussiopoulos, N., Vlachokostas, Ch., Tsilingiridis, G., Douros, I., Hourdakis, E., Naneris, C., Sidiropoulos, C., 2009.Air quality status in Greater Thessaloniki Area and the emis-sion reductions needed for attaining the EU air quality legislation. Sci. Total Environ. 407, 1268–1285.
Orío, A., Pallarés, M., Jiménez, S., Reina, F., Javato, R., Hervás, M., Cornide, M.J., 2013.
Análisis de la calidad del aire en España: evolución 2001–2012. Dirección General de Calidad y Evaluación Ambiental y Medio NaturalMinisterio de Agricultura, Alimentación y Medio Ambiente, Madrid.
Oxley, T., Dore, A.J., ApSimon, H., Hall, J., Kryza, M., 2013.Modelling future impacts of air pollution using the multi-scale UK Integrated Assessment Model (UKIAM). Environ. Int. 61-17-35.
Panagos, P., van Liedekerke, M., Montanarella, L., 2011.Multi-scale European Soil Infor-mation System (MEUSIS): a multi-scale method to derive soil indicators. Comput. Geosci. 15, 463–475.
Pilli, R., 2012.Calibrating CORINE Land Cover 2000 on forest inventories and climatic data: an example for Italy. Int. J. Appl. Earth Obs. Geoinf. 19, 59–71.
Pope, C.A., Burnett, R.T., Thun, M.J., Calle, E.E., Krewski, D., Ito, K., Thurston, G.D., 2002.
Lung cancer, cardiopulmonary mortality, and long-termexposure tofine particulate air pollution. JAMA 287, 1132–1141.
Posch, M., Hettelingh, J.P., de Smet, P.A.M., 2001.Characterization of critical load exceedances in Europe. Water Air Soil Pollut. 130, 1139–1144.
Querol, X., Alastuey, A., Pandolfi, M., Reche, C., Pérez, N., Minguillón, M.C., Moreno, T., Viana, M., Escudero, M., Orío, A., Pallarés, M., Reina, F., 2014.2001–2012 trends on air quality in Spain. Sci. Total Environ. 490, 957–969.
Rao, S., Chirkov, V., Dentener, F., Van Dingenen, R., Pachauri, S., Purohit, P., Amann, M., Heyes, C., Klinney, P., Kolp, P., Klimont, Z., Riahi, K., Schöpp, W., 2012.Environmental modeling and methods for estimation of the global health impacts of air pollution. Environ. Model. Assess. 17, 613–622.
Reinds, G.J., Posch, M., de Vries, W., Slootweg, J., Hettelingh, J.P., 2008.Critical loads of sul-phur and nitrogen for terrestrial ecosystems in Europe and northern Asia using differ-ent soil chemical criteria. Water Air Soil Pollut. 193, 269–287.
Saffari, A., Daher, N., Samara, C., Voutsa, D., Kouras, A., Manoli, E., Karagkiozidou, O., Vlachokostas, C., Moussiopoulos, N., Shafer, M.M., Schauer, J.J., Sioutas, C., 2013. In-creased biomass burning due to the economic crisis in Greece and its adverse impact on wintertime air quality in Thessaloniki. Environ. Sci. Technol. 47, 13312–13320.
Samoli, E., Kougea, E., Kassomenos, P., Analitis, A., Katsouyanni, K., 2011.Does the pres-ence of desert dust modify the effect of PM10on mortality in Athens, Greece? Sci.
Total Environ. 409, 2049–2054.
Schelhaas, M.J., Varis, S., Schuck, A., Nabuurs, G.J., 1999.EFISCEN's European Forest Re-source Database. EFI, Helsinki.
Schucht, S., 2005.Including structural changes into IAM: some ideas and possible implica-tions. Workshop on the Importance of Non-Technical Measures for Reductions in Emissions of Air Pollutants and How to Consider Them in Integrated Assessment Modelling. ASTA, Göteborg, Sweden (7–8 December).
Sotiropoulou, R.E.P., Tagaris, E., Pilinis, C., 2004.An estimation of the spatial distribution of agricultural ammonia emissions in the Greater Athens Area. Sci. Total Environ. 318, 159–169.
Tasić, V., Jovašević-Stojanović, M., Vardoulakis, S., Milošević, N., Kovačević, R., Petrović, J., 2012.Comparative assessment of a real-time particle monitor against the reference gravimetric method for PM10and PM2.5in indoor air. Atmos. Environ. 54, 358–364.
Torrero, A., 2010. La crisisfinanciera y sus efectos en la economía española. Serie Documentos de Trabajo 13/2010. Instituto Universitario de Análisis Económico y So-cial. Universidad de Alcalá, Alcalá de Henares (Available at:http://www2.uah.es/iaes/ publicaciones/DT_13_10.pdf).
Van Dingenen, R., Dentener, F.J., Raes, F., Krol, M.C., Emberson, L., Cofala, J., 2009.The glob-al impact of ozone on agriculturglob-al crop yields under current and future air quglob-ality leg-islation. Atmos. Environ. 43, 604–618.
Vedrenne, M., 2015.Development and implementation of an air quality integrated assess-ment model for the Iberian Peninsula. PhD Thesis, Technical University of Madrid, Madrid, Spain (in press).
Vedrenne, M., Borge, R., Lumbreras, J., Rodríguez, M.E., 2014a.Advancements in the de-sign and validation of an air pollution integrated assessment model for Spain. Envi-ron. Model Softw. 57, 177–191.
Vedrenne, M., Borge, R., Lumbreras, J., Rodríguez, M.E., 2014b.Evaluation of air quality im-pacts with an integrated assessment model for Spain. In: Mitto, T., Fallmann, J., Mikolajczyk, U., Suppan, P., Singh, V., Sokhi, R.S. (Eds.), Proceedings of the 9th Inter-national Conference on Air Quality—Science and Application. ISBN: 978-1-909291-20-1.
Vivanco, M.G., Palomino, I., Vautard, R., Bessagnet, B., Martín, F., Menut, L., Jiménez, S., 2009.Multi-year assessment of photochemical air quality simulation over Spain. En-viron. Model Softw. 24, 63–73.
Vlachokostas, Ch., Achillas, Ch., Moussiopoulos, N., Banias, G., 2011.Multicriteria method-ological approach to manage urban air pollution. Atmos. Environ. 45, 4160–4169.
Watkiss, P., Pye, S., Forster, D., Holland, M., King, K., 2001.Quantification of the non-health effects of air pollution in the UK for PM10objective analysis. Report AEAT/ENV/R/
0734. AEA Technology Environment, Abingdon.