Coverage Location Problem
Arlen Guar´ına and Andr´es Ram´ırez Hassanb
aBanco de la Rep´ublica de Colombia b
Universidad EAFIT
Abstract. The probability of facing prison is one of the major factors that deters indi-viduals from committing crimes. The degree of impact of this variable is affected both by the severity of penalties, and by the probability of being caught, which largely depends on the level of police coverage in the jurisdiction. Thus, we consider a maximal covering lo-cation problem where the objective is to provide maximal coverage of weighted potential homicide spots through the construction of police stations for instant reaction, subject to a budget constraint. Our empirical application is performed in Medell´ın (Colombia), one of the cities with the highest homicide rate in the World. Specifically , we call the Google Maps Application Programming Interface (API) to estimate average travelling time between police stations and criminal spots, then we use a Simulated Annealing algorithm to find the best feasible allocation of stations subject to a set of suggested budgets. We confirm that the maximum coverage follows a diminishing marginal process over the budget.
1 Introduction
Extended periods of violence entail large costs on society; in addition to losses in quality and length of life, enormous amounts of fiscal and private spending on unproductive activities such as defense, criminal justice and prison systems, and destruction of physical and human capital, crime and violence create uncertainty about the future, restricting investment and innovation, which ends up bringing negative effects on growth and productivity.
Research such as that of Soares (2006) suggests that, when considering some intangibles, the average cost of violence for Latin America may be as high as 14 percent of GDP, an estimate larger than for the other regions. This figure could be particularly important in countries exposed to long periods of conflict and high crime rates such as Colombia.
Given the high relevance of social interactions and individual decisions, and the high costs that criminals acts bring, the detail in the explanation, causes and consequences of this im-portant issue has become a matter of priority analysis for the society as a whole.
An early analysis from an economic point of view in this field was that of Becker(1968), which allowed us to understand the crime as part of optimal microeconomic decisions, giving theoretical support to this social problem, and unleashing a series of empirical studies that seek to deepen this social conflict and have made a much more disaggregated examination.
Some researchers (Ackerman and Murray (2004),Bourguignon (1999) andBecker (1968)) have found that socioeconomic conditions of individuals have an important influence on the
Keywords and phrases.Homicide, Maximal Coverage Location Problem, Police Station
decision to commit a crime, then societies with higher levels of poverty, exclusion, income inequality, among others, tend to have higher crime rates. However, the change in these variables usually occurs gradually and the effects of interventions in these fields may only be seen in the long run.
Given the slow pace of socioeconomic interventions to reduce violence, different interven-tions are then necessary to relieve the problem in the short term. The work ofBecker(1968) allows seeing that when committing a crime individuals face a situation that offers some ben-efits (economic in most cases), but entails some costs (both moral costs, and the punishment they could face). As the costs get higher, for example due to a higher probability of being punished or a stronger severity of the penalties that criminal might face, the individual will have less incentive to commit the crime.
In that sense, approaches such as Lee and McCrary (2009) and Levitt (1998) conclude that to the extent that penalties are higher, the lower the crime rate is, an effect that is consolidated by two mechanisms, the first called the deterrence effect, which means that more serious sentences deter potential criminals to carry out their act, and the incapacitation effect because the more time those who committed crimes spend in prison, the larger is the time it takes them to re-offend.
In addition, Di Tella and Schargrodsky(2004) and Chalflin and McCrary (2013) find pos-itive and significant effects of the presence of police force on crime reduction, with much stronger effects on violent crimes than in property crimes.
In summary, literature suggests that criminal behavior in the long run is more strongly determined by the socioeconomic conditions of individuals, so that circumstances such as poverty, exclusion, income inequality, lack of government presence and poor provision of social services have an influence on violence. Meanwhile, in a shorter period of time, law enforcement instruments become more important, and in this vein the severity of penalties for crimes and high capture probabilities, ensured by a greater proximity of the police, create incentives for individuals on the decision whether to commit a crime or not.
Recent research (Cozens (2008), Andresen (2006) and Wang et al. (2013)) also suggests that criminal activity is concentrated at specific points within cities, which has led to the implementation of new methodologies and aproaches.These studies indicate that when making any analysis of criminal acts, it is important to consider the structure of where the incident occurred, as this social problem tends to cluster geographically.
methodology allows to approximate efficient spatial allocation of law enforcement agencies in order to counter the criminal acts1.
This latter part is the main motivation for this research, because once the criminal hot spots are identified, an efficient location of the law enforcement agencies can ensure greater coverage of these problematic clusters, generating a greater impact in reducing crime rates.
In this research, we consider a maximal homicide covering location problem where the objective is to provide maximal coverage of weighted potential criminal spots in Medell´ın (Colombia), one of the cities with the highest crime rate in the World, subject to a constraint given by the budget for the construction of Police agencies. We use a Simulated Annealing algorithm to find the best feasible Allocation of police stations subject to a set of suggested budgets, and we confirm that the maximum coverage follows a diminishing marginal process over the budget.
The rest of the paper is organized as follows. In Section 2 we conduct a short contextualizing of the phenomenon of crime in Colombia emphasizing Medell´ın (Colombia). In Section 3 we make a brief description of the Police Stations, Colombian Police enforcement agencies. In Section 4 we discuss the strategy to solve the maximal covering location problem. Section 5 describes the data and procedures performed in more detail. Section 6 Concludes.
2 Crime in Colombia and Medell´ın
High rates of homicide and crime in Colombia and their persistence during the last decades is a worrisome fact, and its dynamics causes and effects have attracted numerous studies over the years. Although in the decades of 50 and 60 took place in the country an era called “La ´epoca de la Violencia” (The era of violence), a phenomenon that finds its origins in political and institutional disputes, in which some guerrilla groups and groups outside the law were formed, as the missing M19 and others still in force as the FARC and ELN; it is only from the mid-70s when, in a simultaneous process of strengthening of drug trafficking organizations in the country, variables such as the homicide rate began a rapid ascent, passing from averages of 16 murders per hundred thousand in the first half of the 70s to peaks of even 89 homicides per hundred thousand in early 90s.
As highlighted in S´anchez and nez (2001) comparing these figures allowed to demonstrate the seriousness of the problem, in fact when performing a comparison considering violent countries like Brazil and Mexico, it is found that homicide rates in Colombia were four times those of these two countries in the region, seven times that of the United States and about seventy times that of European countries. Despite the dismantling of major drug cartels in the early nineties and a subsequent drop in homicide rates to less exorbitant indexes, levels of
1
violence remained higher than desired, yet presenting persistent cycles with a recrudescence of such indicators.
Medell´ın’s case has not been out of the national reality,Giraldo(2008) explained how vari-ations in the homicide rate in the city have evolved in line with the national conflict behavior. So in the late 80’s, the increase in homicides responded to the narcoterrorism onslaught, sit-uation that also explains much of the behavior of the index during the first years of the 90’s.
Giraldo(2008) stated that at the end of the 90s and beginning of the century, violence in the city was associated with urban guerrilla and paramilitary, central government neglect of the phenomenon that was occurring in cities and the loss of security monopoly by the local govern-ment. Similarly, decreases in this variable are also associated with central government actions, such as the dismantling of the Medell´ın cartel in the mid-90s, urban intervention actions as the eradicating of guerrillas in the western sector of the city through the “Orion Operation” in late 2002, and the subsequent demobilization of the Paramilitary “Bloque Cacique Nutibara” with an extensive control of criminal activities in the city for that date.
Medina et al.(2011) also enhanced the high correlation in the evolution of crime nationally, and the three main cities (Bogot´a, Medell´ın and Cali), stating that confrontations with illegal groups and drug trafficking organizations, have been crucial (in a quite synchronized form) in the variation of national homicide rates in particular in the city of Medell´ın.
By focusing on the city of Medell´ın, Medina et al.(2011) detailed that, despite the demise of Pablo Escobar and the Medell´ın Cartel in the 90s, the capacity for reinvention of drug trafficking groups, and the ability to achieve their objectives through violent means has allowed various groups involved in this activity, appear and disappear sequentially in the context of the city without sighted no definitive solution.
According toMedina et al.(2011) despite the high costs that the constant presence of illegal armed and drug-related groups in recent decades have brought to the city, affecting not only dimensions traditionally analyzed as life expectancy, but also aspects related to inhabitants life satisfaction, the city seems to have used to the violent conditions imposed by organized crime.
Although the various phenomena of drug trafficking groups operating outside law, and the evolution of crime rates show a high correlation and possible causality in this regard, numerous studies have tried to ascertain the actual causes of crime in the country and particularly the city of Medell´ın. For example, S´anchez and nez (2001) found that for seven cities of the country, the main explanation of the increase in the homicide rate is the increase in drug trafficking and, in a lesser extent, the judicial system malfunction. In the particular case of Medell´ın, drug phenomenon explains about 80% of the increase in the homicide rate in the 80s. In making estimates at municipality panel level, they also found that variables such as poverty, inequality, political participation, presence of armed groups, drug trafficking and inefficiency of justice is also highly related to the homicide rate.
those whit the lowest rates (highest and lowest quintile, respectively) and between 3% and 13% is explained by variables such as poverty, inequality, political exclusion and poor access to education.
Bonilla(2009) also contributed to the discussion finding that the change in the composition of the population pushed up the murder rate, although this effect is apparently not very important because it explains only 13.5% of total homicides increase. The percentage is greatly reduced when controlling by variables such as time fixed effects and individuals age. Thus, the author concluded that changes in the homicide rate in recent years have little correlation with demographic changes.
When analyzing the effect that variables such as household income and inequality had on crime,Bourguignon et al.(2003) found that the part of the population whose living standards are 80% below the average (5 or 6 poorest deciles aproximately) are more related to the determination of the crime. Thus, changes in the distribution of income that do not affect the population that is above that threshold will not influence the crime rate.
In this sense, Posada and Montenegro (1994) did a department-level analysis which shows that poverty-related variables do not cause homicidal violence, finding even a negative rela-tionship between the two variables, which in turn indicated that the increase in the rate of murders was associated with output growth, social wealth increase and a weak judicial sys-tem. Finally, the authors highlighted the existence of a threshold where the increase in crime affects investment and saving and reduce economic growth.
Although, as in the international literature, most of the studies in Colombia point to socioe-conomic conditions as one of the main determinants of crime in the long term, some actions are necesary to face the problem in the short term, increasing individual costs for those who commit crimes.
Thus, and following the work of Lee and McCrary (2009) and Levitt (1998), Guar¨ı¿12n et al. (2013) took advantage of the discontinuity in punishment at age 18 to assess if that change has a deterrent effect on arrests, finding important deterrence an incapacitation effects of punishment especially on those crimes related to drug consumption and trafficking. Then, the costs associated with a greater punishment deters criminals in the city of Medell´ın.
Following the same logic used above and explained in the international literature, higher levels of police coverage will be associated with higher odds of capture, and therefore with higher costs of committing a crime. The police presence to address criminal phenomena imme-diately in the city is given by the law enforcement agencies called CAI that will be presented bellow.
3 A brief description of the CAIs
on the urban perimeters of municipalities, towns, slums or neighborhoods of the major Colom-bian cities which have this territorial division, and is responsible for guiding and strengthening the urban surveillance made by the National Police, protecting the citizens rights and free-dom. Medell´ın, as the second largest city of the country, has also in its terriotory this kind of police units.
The first CAIs in the city of Medell´ın were created in 1987, in line with the community integration policies implemented by the National Police, with the responsibility of ensuring the safety of its jurisdiction and timely attending the requirements of its inhabitants. As also indicated in Policia (2009), its location reflects strategic factors previously defined as: high traffic streets, easy access for citizens, industrial, residential and commercial development centers and city hotspots that have the highest crime rates.
Policia (2009) also indicated how the creation of these commands obeyed to the need of decentralizing the services of the regular police stations, allowing operational autonomy based on the changes in the traditional system of common surveillance by assigning security responsibility to the commanders of each CAI jurisdiction.
However, a few years after its creation, during the direct confrontation of Pablo Esco-bar and the group “Los Extraditables”2 with Colombian police that took place especially in Medell´ın, the CAIs became into an usual Narcoterrorism target, suffering various kind of at-tacks ranging from armed harassment to atat-tacks with grenades and dynamite. These facts and the connivance of some members of the CAIs with criminal gangs, generated the diactivation of these facilities.
A decade after its closure, and in view of having overcome the main circumstances that led to this, municipal government took up new efforts seeking to revive the CAIs figure, decen-tralizing services stations and looking for greater effectiveness in addressing security issues that plagued the city, giving as a result the launching of 23 CAIs in different neighborhoods units of the city.
Each modern CAI must have, a computer, a laptop for the vehicles, a printer, a camera, bulletproof vest level 3 (one by police), metal handcuffs (one by police), a mechanical equip-ment (in case of fire, confined space rescues, rescue calls for help, etc.) A mirror to check underneath vehicles, among other things. To Build a CAI an area of 100 square meters is needed and it costs on average 60 thousand dollars, excluding the cost of land which has a large variation throughout the city.
4 Methodology
An important policy objective would be to analyze an optimal location of CAIs such that generates the maximun coverage of the clusters with the highest homicide rates subject to a
budget constraint that takes into consideration the price level per square meter over the city of Medell´ın.
The above is a Maximun Coverage Location Problem (MCLP), in which one seeks a set of locations for a number of facilities on a space in such a way that a covere target is maximized. The MCLP was first introduced by Church and Revelle (1974) and since then, many other extensions and variations to the original research have been made.
Many applications of the MCPL have been implemented to determine the optimum location of different facilities based on the distribution of potential consumers, being used for example for the allocation of schools, parks, gas stations and emergency facilities such as fire stations, hospitals and police units.
The variation in approaches is often around the type of implemented parameters (determin-istic or probabil(determin-istic), the type of solution (Exact and Heur(determin-istic) and the solution procedure, where the problems with deterministic parameters and heuristic solutions found by using La-grangean relaxation are the most popular (Galvao et al.(2000),Bernan and Krass(2002) and
Karasakal and Karasakal(2004)).
In the case of emergency response units, especially those of police type, literature often uses recent records (Location of crimes, fires, crashes, etc.) to form spots that represent potential claims along the space to be analyzed. Given these locations and the specific problems to be solved (Equal claiming share corresponding for each unit, specific movement restrictions, etc.) the authors apply the MCLP that fits their needs (Keskin et al.(2012),Curtin et al.(2010),
Ying and Mu(2012),Guo and Qi(2014) and Gu et al.(2010)).
One major difference with other works done in the case of police facilities until now is that, in addition to taking into consideration the value of the land where potential CAIs will be built, in our paper coverage of the objective crime spots will not be measured as the euclidean distance between the points considered, none using the road layout of the city, but using an approximation of the actual average time that takes to travel from the origin point to the destination point for which we call the Google Maps Application Programming Interface (API) to estimate that average travelling time.
Although a exact method may be capable of solving this Maximal Coverge Location Prob-lem, it would only work well for a small number of possible facilities as it would suffer from combinatorial explosion. So an exercise with 100 possible facilities would require the evalua-tion of 1.27×10100different combinations.3 This kind of problem belong to the NP-hard class (Kariv and Hakimi(1979)) and the time and computer amount of memory used to solve such problems repeatedly in real cases become prohibitive, so general heuristic methods become the most attractive alternative.
On this basisArostegui et al.(2006) evaluated some of the most well known general heuris-tic methods applied to some Location Problems under time-limited, solution-limited, and unrestricted conditions. They found that in most cases Tabu Search and Simulated Annealing
3This figure was derived from the calculationP100 i=1
100 i
show the best performance with no clear difference between both of them when the time of the heuristic is unrestricted. This result is in line with that ofDrezner et al. (2002) who also found tha a variant of the Simulated Annealing gave the most satisfactory results among five heuristics evaluated to solve a Location Problem in a discrete space.
Given the obove, we use a Simulated Annealing (SA) algorithm to solve our MCLP. Our SA is based on that proposed byKirkpatrick et al. (1983), which is in turn a modification of the Metropolis-Hastings algorithm developed byMetropolis et al. (1983). This methodology has also been used with success in papers likeCambolat and Massow(2009) andDavari et al.
(2011), among others.
As is pointed out by Davari et al. (2011) Simulated Annealing is a local procedure that is capable of searching stochastically and is designed not to get stuck in a local optimum. SA name comes from the fact that the process emulates those of the metals industry, where major changes are allowed at the beginning of the process, while the material is hot, but as it cools less alterations can be made.
That is precisely the logic behind Simulated Annealing procedure. An initial solution is raised, and a new potential solution is chosen from the feasible region; if the latter has a better fit than the first, is accepted as the new solution, otherwise it is accepted with a probability that will fall to the extent that the iterative process forwards. In our case, the feasible region will be influenced not only by the geographic area but also by the allocated budget.
5 Data, Procedures and Results
5.1 Land prices
In our research, the center of analysis is the city of Medell´ın. For construction of feasibility regions4, for each budget level, we must have a data set with land prices citywide. For this objective, we use the ECV 2011 Survey (Encuesta de Calidad de Vida, in English Life Quality Survey) implemented annually in the city since 2004 to track the socioeconomic conditions of the inhabitants of the 16 communes in which Medell´ın is divided. In the survey, respondents answer questions about actual rent or self-assessment rent of their home.
In the 2011 survey, 60% of interviwed families had home ownership, 33% paid a rent and the remaining 7% lived in other forms of occupation. The actual value of their rent is a good indicator that will allow us to evaluate the market value of the property in question. But most people live in a owned home, and they tend to overestimate the value of their home. To approximate the value of this overestimate, we make a comparison of the average actual rent and the average self-assessment of rent in every neighborhood of the city. Figure1shows how people perform an overestimation of approximately 11.7% of the value of their home. We will make this correction for our calculations .
4
We also have available the number and type of rooms of the house, but its size in square meters is not specified, then we cannot make a direct calculation of the value of rent per unit of space. Taking data from the major rental agencies in the city, that put online the size in square meters of houses for rent, and the number and type of rooms tha the houses have, we find the average size of the latter,5 which allows us to estimate the average size of the respondents’ houses, by making use of the number and type of rooms in ECV.
With these data we can calculate the estimated value of rent per square meter for each household in the survey. The relationship between the rent and the market value of the land of the properties was studied by Jaramillo and Cuervo (2014) who indicated that by 2011 the ratio rent/price of the house by socioeconomic stratum was: 0.6% (high) 0.55% (Medium) 0.68% (low stratum).6 Using these ratios we can finally find the price per square meter for each point in the city where an interview was conducted.
Once these points are georeferenced, and given the representativeness of the survey at the commune level, we can calculate the average value per square meter for each point of the city, as a distance weighted average price found through the ECV. Figure2 shows an example of this process where the average price per square meter at the centroid of each neighborhood was estimated, finding the highest prices in the south and southwest of the city, risen to over US$1500 per square meter figures; and cheaper land located on the outskirts of the east and northeast of the city with values ranging from US$160 per square meter.
5.2 Crime Points
To identify potential demand points, two main sources of information are used, the first one is the census of catches in the city of Medell´ın, available for the period Jan/2002-Oct/2012. Despite 90.9% of the captures in the period in the city of Medell´ın were made in the act, this data, although it could be a useful proxy, does not meet all the desired conditions for the construction of a crime spot because their values are clearly affected by variables such as the expertise of criminals to carry out their activities behind the authority. To solve this problem, we use the records of crimes against life of SIJIN (Criminal Investigation Branch), which has the census of homicides carried out in the city and the common injuries records. Since homicide allows in most cases a record of the event, the latter data set reproduces unbiased estimates of the crime rate.
We also use the census of georeferenced CAIs in the city of Medell´ın, to determine the crime points that are already covered by the police force.7
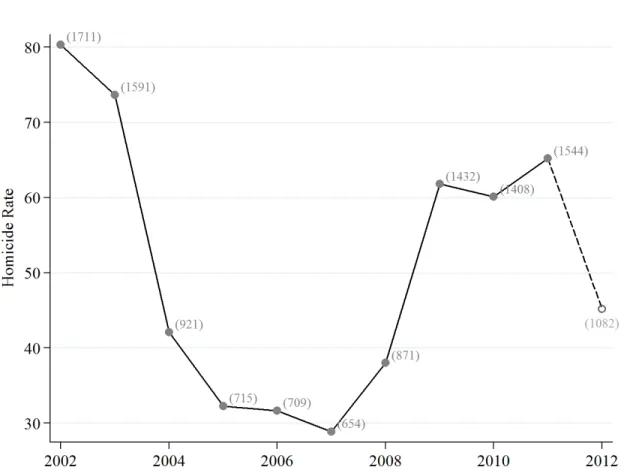
Figure 3 shows the evolution of the homicide rate in the city (number of homicides in parentheses) where a significant drop in this variable is evident during the 2004-2008 period, with a new increase from 2009. The drop in 2012 has a dashed line, as the data just covers
5
We found that in Medell´ın each living room adds on average 8.5mts2, each dining room adds 11.8mts2, a garage adds 21.1m2and each bedroom adds 22.2m2 .
6
Socioeconomic stratum is a classification used by the Colombian government to calculate households eligi-bility for subsidies. The lower the stratum, the higher the household needs.
7
until October of that year. In order to give greater validity to our research, we will consider the two most recent years for which data is available, these being 2011 and 2012.
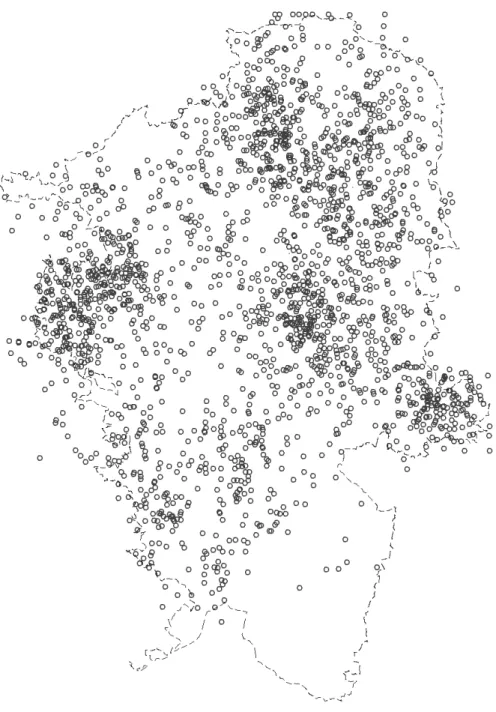
The census of homicides records the address of the event, allowing georeferencing these crimes. Figure 4 shows the spatial distribution of homicides in the city of Medell´ın in the period in question (2011-2012). To avoid points plotted on top of each other a spherical random noise is added to the data before plotting.
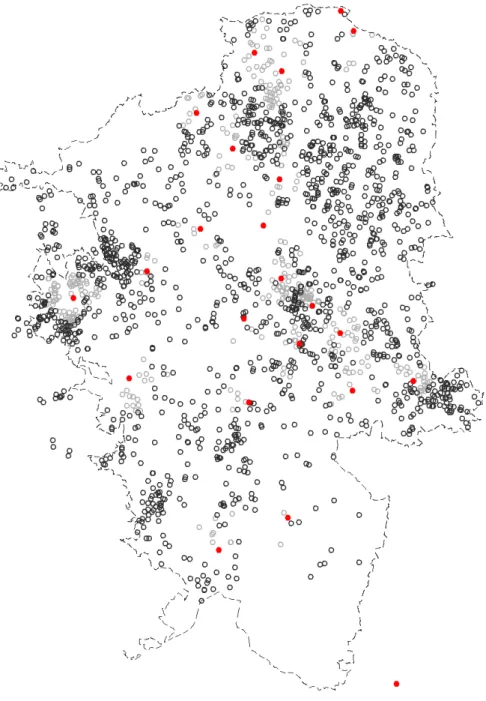
As mentioned before there are a total of 23 CAIs currently operating in the city, then some of the crime points analyzed are already covered. Figure 5 shows the location of the built CAIs (red dots) and the covered points (gray points). As shown in the figure, coverage buffer is not linear, since it is determined by the vial availability, roads senses and flow speed in the sector. Figure6 shows the spatial distribution of not covered points, which will become a key input for the following.
5.3 Clusters
As the literature highlights, the criminal acts in cities tend to cluster spatially, then a more plausible approach than the use of all of the points, would be the construction of weighted clusters that represent those points. For this purpose we use the k-means cluster procedure as follows.
Given the set of n points shown in Figure 6, the k-means clustering procedure seeks to divide it into C sets while minimizing the within-cluster heterogeneity. Then the objective is to find S (S={S1,S2,...,SC}) that minimizes PCi=1
Pni
j=1d(lij, li), where li and ni are the
centroid and size of clusteri, respectively, and d(.) is the euclidean distance function. Figure
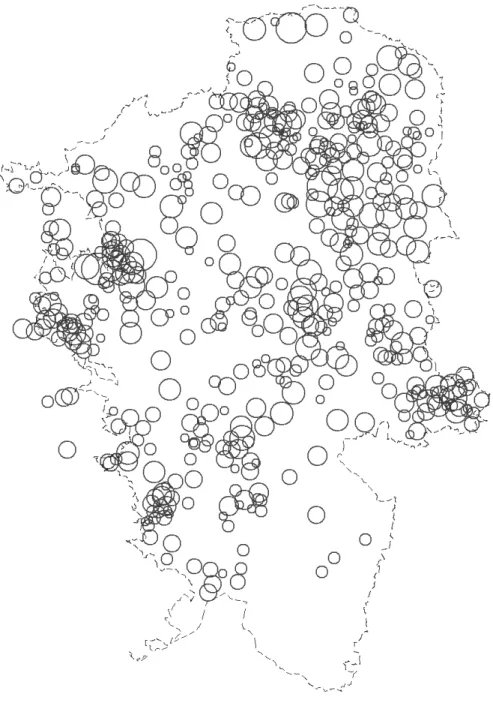
7 shows the result of performing the exercise for C = 500 clusters, the size of each circle indicates the number of points each cluster represents, therefore, the weight that each cluster will have in the optimization process.
5.4 Specific Simulated Annealing Process
At this point we have all the necessary inputs for the optimization process using the SA algorithm. Whose technical details will be defined below.
Homicide clusters are representative areas of crime spots, therefore, besides being the best reference for the definition of demand, their centroids are the best candidates for the possible location of CAIs.
Let M be the budget amount for the construction of the CAIs. The problem feasibility region is given by all combinations of possible CAIs that can be achieved with such budget. Then, it is necessary to know the cost of building a CAI in each of the locations determined by the 500 clusters. The price per square meter at the centroid of each cluster (VC) is calculated
using the estimates from ECV data as follows:
VC =
P
i∈ECV
φ(d(lC, lsi))V si
P
i∈ECV
φ(d(lc, lsi))
Where φ(d(lC, lsi)) is the normal density function with mean 0 and standar deviation 0.5,
evaluated over the euclidean distance between the location of the centroid of the cluster C
(lC) and the location of the ithhousehold of the ECV (lsi),V si is the price per square meter
in the location of that household. Let V be the vector of prices per square meter estimated at the location of each of the 500 clusters.
Let D be the 500 ×500 time distance matriz between each of the clusters’ centroids, calculated using the Google API Tool. And let A=f(D) be a 500×500 matrix that in the (i, j) position has a 1 if thejthcluster is covered by theith cluster, that is, 1 if police could go from theith cluster to thejthcluster in less than 3 minutes, and 0 otherwise.8
LetP be a vector of dimension 500 with the weighted demand, whose values are the number of homicides that each cluster represents. LetXLbe a vector of dimension 500 containingones
in the positions associated with the clusters of the solutionL, whereLis any combination of clusters, andzerosin the remaining positions. LetN(X0) be a function that changes the values of the transposed vector X0 to one when they are greater than 0 and let them unmodified otherwise.
Given the above, the coverage in this case can be measured asCov=N(XL0A)1×500P500×1,
wich is the number of homicides that are covered byL. Then the aim of the optimization can be written as:
arg max
L Cov=N(X
0
LA)P subject to 100X
0
LV + 60X
0
LXL≤M
Where the first term of the constraint refers to the cost of the land, and the second to the cost of the costruction of the CAIs. Specifically, 100 is the CAI’s area in square meters and 60 is the cost of construction and equipment in thousands of dollars. Note thatXL0XL is the
number of CAIs associated with the solutionL.
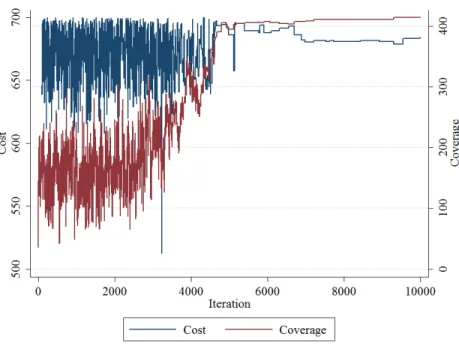
As has already been explained in advance, to carry out this estimation we use a Simulated Annealing algorithm that will follow the next steps:
1. ProposeLtF R, and estimateCov(Lt)
2. ProposeL∗t+1 where we randomly drop or add 2 elements to Lt
3. IfL∗t+1∈/ F R, repeat step 2 4. Lt+1 =L∗t+1 with probability Pt+1
5. Pt+1= 1 if Cov(L∗t+1)> Cov(Lt),Pt+1 =e
−∆
T(t,E) ifCov(L∗
t+1)≤Cov(Lt)
Where t is the current iteration, E is the number of total iterations to be run, F R is the feasible region, ∆ is the difference between Cov(L∗t+1) and Cov(Lt), and T(t, E) is the
8
“temperature” of the process. This temperature will follow the functionT(t, E) = 500∗(1− 10
E)
t), this structure is similar to that used in SA literature and ensures that in the first
iterations, the probability of accepting a solution with lower coverage is high, avoiding falling into local optima.
For our research a total of 10000 iterations have worked well to the budgets amount taken in consideration.
Figures 8 to 11 show an example of how the optimization process works, appearing a searching process with a high stochastic component in the early stages and reaching a high stability in the last iterations.
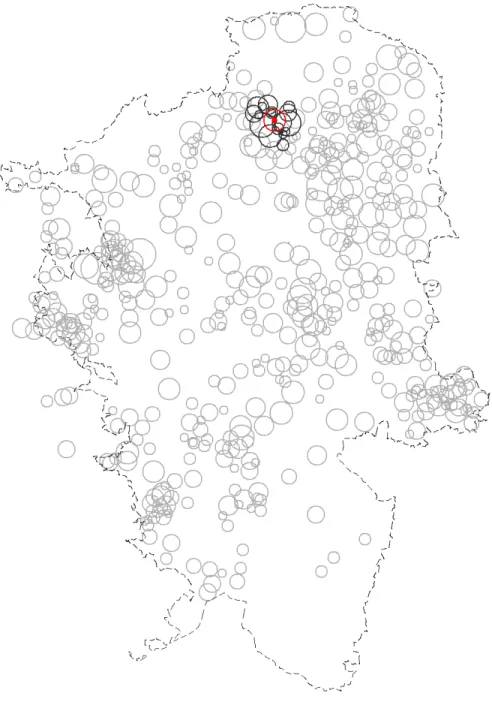
In addition, figures12 to20show the georeferenced optimal solution for each budget taken into account, where the red dots are the selected locations for building a CAI, red circles are the cluster whose centroids were selected, black circles are the clusters that would be covered by the new CAIs and gray circles are the clusters that remain uncovered. Here again, the size of the circle is associated with the number of homicides that each cluster represents.
6 Conclusions
As may be evident from the results, low budgets can quite restrict coverage and possible optimal constructions of CAIs, specifically, budgets lower than US$100,000 do not allow the construction of more than one CAI, limiting coverage to no more than 4% of demand.
To the extent that larger budgets are allocated, more freedom will be present in the process of optimization and better results will be gotten in the coverage field. However, as it is evident in figure21, which shows the evolution of the maximum coverage for every budget analyzed, target variable features marginally decreacing variations with respect to the budget constraint.
We also found the exact solution to the set of problems analyzed here, this results are also shown in figure21. We can see that the solution found by Simulated Annealing is very close to the exact solution, but for the former, the total resources used (time and system memory) is significantly lower than for the latter. This aspect is crucial when feasible region for the probleme increase.
While resources of US$100,000 not reach even a 4% coverage of the homicides map, with a budget of US$10,000,000 a total coverage of over 70% is achieved.
If government would like to achieve a coverage of 50% percent of the of the potential demand, a budget of approximately US$2,500,000 needs to be allocated.
more on the outskirts; and third, the low speed in downtown makes it very difficult to achieve a high coverage. These factors might suggest that CAI does not appear to be the best method to tackle the problem of violence in downtown.
References
Ackerman, W. V. and Murray, A. T. (2004). Assessing spatial patterns of crime in lima, ohio. Elsevier, 21(5):423–437.
Andresen, M. (2006). A spatial analysis of crime in vancouver, british columbia: a synthesis of social disorga-nization and routine activity theory. The Canadian Geographer, 50(4):487–502.
Arostegui, M., Kadipasaoglu, S., and Khumawala, B. (2006). An empirical comparison of tabu search, simu-lated annealing, and genetic algorithms for facilities location problems.International Journal of Production Economics, (103):742–754.
Becker, G. (1968). Crime and punishment: An economic approach.The Journal of Political Economy, 76(2). Bernan, O. and Krass, D. (2002). The generalized maximal covering location problem. Computers and
Oper-ations Research, 29:563–581.
Bonilla, L. (2009). Demograf´ıa, juventud y homicidios en colombia, 1979-2006. Technical report, Banco de la Rep´ublica.
Bourguignon, F. (1999). Crime as a social cost of poverty and inequality: A review focusing on developing countries. Desarrollo y Sociedad.
Bourguignon, F., N¨ı¿1 2¨ı¿
1
2ez, J., and S´anchez, F. (2003). What part of the income distribution matters for explaining property crime? the case of colombia. Technical report, Universidad de los Andes.
Cambolat, M. and Massow, M. (2009). Planar maximal covering with ellipses. Computers and Industrial Engineering, (57):201–208.
Chalflin, A. and McCrary, J. (2013). The effect of police on crime: New evidence from u.s. cities, 1960-2010. Technical report, NBER 18815.
Church, R. and Revelle, C. (1974). The maximal coverage location problem. Papers of Regional Science Association, 32:101–118.
Cozens, P. (2008). New urbanism, crime and the suburbs: A review of the evidence.Urban Policy and Reserach, 26(4):429–444.
Curtin, K., Hayslett-MacCall, K., and Qiu, F. (2010). Determining optimal police patrol areas with maximal covering and backup covering location models. Networks and Spacial Economics, (10):125–145.
Davari, S., Fazel, M., and Hemmati, A. (2011). Maximal covering location problem (mclp) with fuzzy travel times. Expert Systems with Applications, (38):14535–14541.
Di Tella, R. and Schargrodsky, E. (2004). Do police reduce crime? estimates using the alocation of police forces after a terrorist attack. The American Economic Review, 94(1):115–133.
Drezner, T., Drezner, Z., and Salhi, S. (2002). Solving the multiple competitive facilities location problem. European Journal of Operational Research, (142 (1)):138–151.
Galvao, R., Espejo, L., and Boffey, B. (2000). A comparison of lagrangean and surrogate relaxations for the maximal covering location problem. European Journal of Operational Research, 124:377–389.
Giraldo, J. (2008). Conflicto armado urbano y violencia homicida: El caso de medell´ın.Revista Latinoamericana de Seguridad Ciudadana, 5(1):99–113.
Gu, W., Wang, X., and McGregor, E. (2010). Optimization of preventive health care facility locations. Inter-national Journal of Health Geographics, pages 9–17.
Guar¨ı¿12n, A., Medina, C., and Tamayo, J. (2013). The effects of punishment of crime in colombia on deterrence, incapacitation, and human capital formation. Technical report, IDB-WP-420.
Guo, Z. and Qi, M. (2014). Modeling and simulation of emergency service facilities location problem under fuzzy environment. The Open Mechanical Engineering Journal, (8):48–52.
Jaramillo, S. and Cuervo, N. (2014). Precios inmobiliarios de vivienda en bogot¨ı¿1
2 1970-2013. Technical report, Documentos CEDE.
Karasakal, O. and Karasakal, E. (2004). A maximal covering location model in the presence of partial coverage. Computers and Operations Research, 31:1515–1526.
Kariv, O. and Hakimi, S. (1979). An algorithmic approach to network location problems, part 2: the p-medians. SIAM Journal of Applied Mathematics, (37):539–560.
Keskin, B., Li, S., Steil, D., and Spiller, S. (2012). Analysis of an integrated maximum covering and patrol routing problem. Transportation Research Part E, 48:215–232.
Kirkpatrick, S., Gelatta, C., and Vecchi, M. (1983). Optimization by simulated annealing.Science, (220):671– 680.
Levitt, S. (1998). Juvenile crime and punishment. Journal of Political Economy, 106(6):1156–85. Medina, C., Posso, C., and Tamayo, J. (2011). Costos de la violencia urbana y pol¨ı¿1
2ticas p¨ı¿ 1
2blicas, algunas lecciones de medell¨ı¿12n. Technical report, Banco de la Rep´ublica.
Metropolis, N., Rosenbluth, A., Rosenbluth, M., Teller, A., and Teller, E. (1983). Equations of state calculations by fast computing machines. Journal of Chemical Physics, (21):671–680.
Policia (2009). Manual para el comando de atenci¨ı¿12n inmediata, cai. Technical report, Policia Nacional. Posada, C. and Montenegro, A. (1994). Criminalidad en colombia. Technical report, Banco de la Rep´ublica. S´anchez, F. and nez, J. N. (2001). Determinantes del crimen violento en un pa´ıs altamente violento: el caso de
colombia. Technical report, Universidad de los Andes.
Soares, R. (2006). Welfare costs of crime and common violence: A critical review. Technical report, PUC Rio 581.
Wang, D., Ding, W., Lo, H., Morabito, M., Chen, P., Salazar, J., and Stepinski, T. (2013). Understanding the spatial distribution of crime based on its related variables using geospatial discriminative patterns. Environment and Urban Systems, 39:93–106.
Figure 1: Self-assessment of rent
Figure 2: Land Price in Medell´ın (Colombia)
Figure 3: Homicide Census
Figure 4: Homicide 2011-2012
Figure 5: Actual Covered Area
Figure 6: Potencial Crime Spots
Figure 7: Clusters
Figure 8: SA with US$100K Budget
Source: Own calculations based on information from the Medell´ın Metropolitan Police and the ECV 2011 Survey.
Figure 9: SA with US$300K Budget
Figure 10: SA with US$700K Budget
Source: Own calculations based on information from the Medell´ın Metropolitan Police and the ECV 2011 Survey.
Figure 11: SA with US$2000K Budget
Figure 12: Optimal Location with a US$100K Budget
Figure 13: Optimal Location with a US$200K Budget
Figure 14: Optimal Location with a US$300K Budget
Figure 15: Optimal Location with a US$500K Budget
Figure 16: Optimal Location with a US$700K Budget
Figure 17: Optimal Location with a US$1000K Budget
Figure 18: Optimal Location with a US$1500K Budget
Figure 19: Optimal Location with a US$2000K Budget
Figure 20: Optimal Location with a US$3000K Budget
Figure 21: Coverage vs. Budget