Efficient design and optimization of bio-photonic sensing cells (BICELLs) for label
free biosensing
Alvaro Lavin Rafael Casquel Francisco J. Sanza María Fé Laguna Miguel Holgado
A B S T R A C T
In previous works we demonstrated the benefits of using micro-nano patterning materials to be used as bio-photonic sensing cells (BICELLs), referred as micro-nano photonic structures having immobi-lized bioreceptors on its surface with the capability of recognizing the molecular binding by optical transduction. Gestrinone/anti-gestrinone and BSA/anti-BSA pairs were proven under different optical configurations to experimentally validate the biosensing capability of these bio-sensitive photonic archi-tectures. Moreover, Three-Dimensional Finite Difference Time Domain (FDTD) models were employed for simulating the optical response of these structures. For this article, we have developed an effective ana-lytical simulation methodology capable of simulating complex biophotonic sensing architectures. This simulation method has been tested and compared with previous experimental results and FDTD mod-els. Moreover, this effective simulation methodology can be used for efficiently design and optimize any structure as BICELL. In particular for this article, six different BICELL'S types have been optimized. To carry out this optimization we have considered three figures of merit: optical sensitivity, Q-factor and signal amplitude. The final objective of this paper is not only validating a suitable and efficient optical simula-tion methodology but also demonstrating the capability of this method for analyzing the performance of a given number of BICELLs for label-free biosensing.
1. Introduction
Optical biosensing has focused high interest during past years. These sensors allow the detection of a huge diversity of bioanalytes by measuring variations of refractive index induced by molecular binding. In particular, detecting non-labeled analytes [1 ] have par-ticular interest, mainly due to the simplicity of the sensing protocol, compared with labeled sensors. The most developed tools are based on surface plasmon resonance (SPR) principle broadly reported in the scientific literature [2] as well as interferometry, using for example Mach-Zehnder [3], ring resonator interferometers [4], Young interferometers [5], among many others [6] operating with a variety of waveguides for the sensing optical readout. The com-plexity of coupling the light from a fiber to these waveguides, and also for taking the bioanalyte to the sensing surface, by means of complex microfluidic circuit might be often considered to be a drawback, although promising results are continuously improving these typologies of biosensors.
In recent works [7-9] we demonstrated a transducing method-ology for label-free biosensing based on BICELLs and straight-forward vertical optical light coupling systems by performing two different immunoassays: BSA/anti-BSA and Gestrinone/anti-gestrinone. The obtained results were satisfactory, with reached limits of detection at a competitive level (2.3 ng/mL for anti-BSA detection, and 64 pg/mL for anti-gestrinone detection). Other advantages for this system are: the abovementioned light cou-pling system, the process of bio-functionalizing surfaces by simply putting a droplet of sample on the sensing surface, and the high multiplexing capability for measuring multiple analytes.
The principle of sensing for the BICELLs is the following: the device consists of a periodic lattice of micro-nano pillars built on a silicon or glass substrate with, or without, an interferometric layer chosen among SÍO2 for Si as substrate or indium tin oxide (ITO) for glass as substrate. BICELLs are square single cells with a size in the order of 100 x 100 |jim; multiple cells are fabricated on a sin-gle wafer by means of an array setup. The optical characterization is performed in our experiments by using a FTIR-vis system for obtaining reflectivity profiles.
be analyzed by spectrometry for monitoring both: the immobiliza-tion of bioreceptors onto the sensing surface and the biomolecular binding. The combination of micro-nano pillars network and the multilayer film stack offers a particular interference sensing curve, which dips and peaks shift when the sensing surface (in this case, the pillars) are covered with a biofilm (which is equivalent to the variation of their refractive index).
The optimization of BICELLs requires a study of the effect of mul-tiple input parameters on the model outputs, each one in range of values given by our experience or the limitations of the methods of fabrication of the sensitive cells. Parameters as the diameter and pitch of the pillars are studied, as long as the type of substrate and the refractive index of the pillars.
Past studies suggested that the variation of any of the design parameters of the periodic lattice has an influence in the expected shift of interference, and thus in the biosensing performance of the device [10]. The goal of this work is define this design process, by identifying which are the most important parameters and state its influence in the final performance. To do this, a novel methodology based on an analytical simplified theoretical model is presented, simulated, studied, tested and compared with experimental and alternative theoretical results. The objective is to demonstrate that this model can be used for simulating complex biophotonic sys-tems, and how this methodology can be used for optimizing these complex systems.
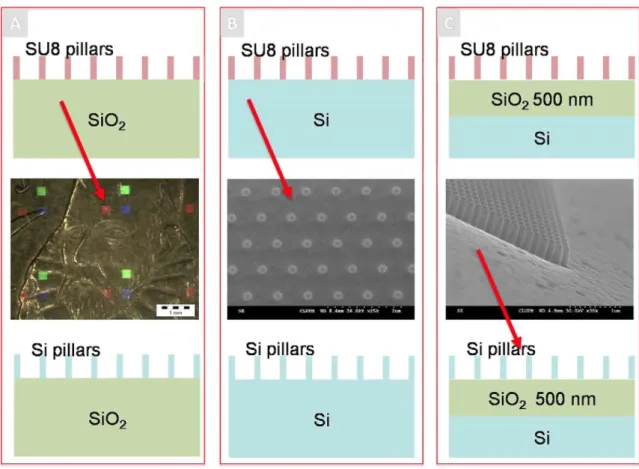
Thus, we have studied six different combinations of materials for the pillars and the underlying stratified structures in order to obtain more information about BICELLs behavior. Cases are shown in Fig. 1. These structures combine two different substrates, of silicon and glass and two different materials for the pillars (silicon and SU-8). Diameter of the pillars and lattice parameter are varied in a range of values in order to see the influence of these change in the performance of the sensor.
2. Theoretical model and simulation
2.Í. ID model explanation
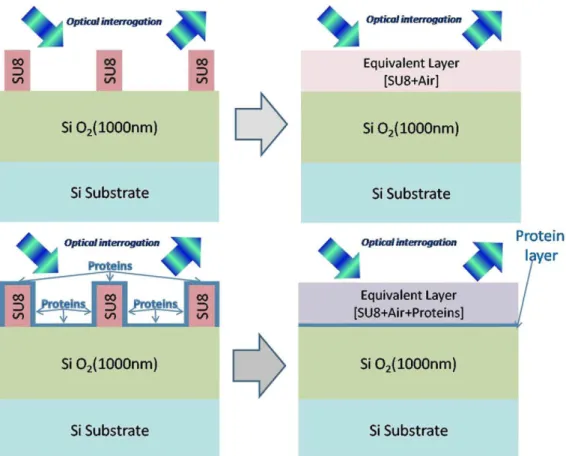
In order to perform huge amounts of simulations of the optical response of BICELLs, we have implemented a ID analytical model, based on the definition of an effective dielectric constant and an effective thickness of the pillars region. This model changes the strategy of optimization of previous works [10] in order to achieve a faster and more efficient methodology that does not imply using the complex Finite Difference Time Domain algorithm (FDTD) [11]. This analytical ID model is shown schematically in Fig. 2.
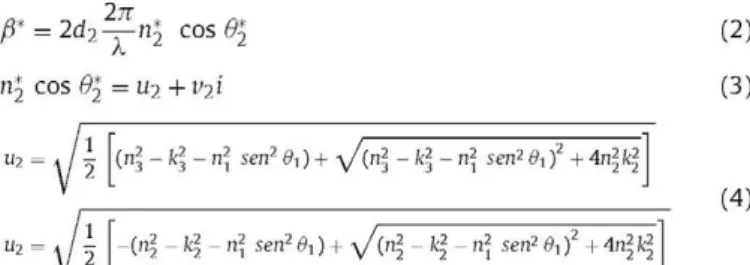
The ID analytical model operates with the classic formula that gives the reflectivity of a stratified medium of three layers [12].
rh + r23 e,P*
1 + r*ur*23 e*f>* (1)
In the last expression r|2 and r^3 are the complex Fresnel
coefficients between boundaries and fi* is given by Eqs. (2-5) where d2 is the thickness of the second layer, k is the wavelength, nl t n2,
k\, 1(2 are the real and imaginary parts of the refractive index of the first and second media and 6\, the incident angle.
p* = 2d2^ni, c o s ^ (2)
k
n*2 cos 6j = ii2 + vji
"2 = \ I ("3 - kl - "? se"2 ^) + \ An3 - kl - n\ sen2 ei )2 + 4n2 k\
(3)
(4)
-{n\ - k\ - n\ sen2 0,) + \J{n\ - k\ - n\ sen2 0, f + An\ k\
Eq. (1) can be applied to obtain the reflectivity of the bottom two materials of a stack and can be iterated up to the top layer to find the reflectivity of the entire structure. Eq. (1) has been previ-ously applied for measuring the thickness and optical properties of films in stacks using different techniques as beam profile reflec-tometry, beam profile ellipsometry or spectroscopic beam profile ellipsometry [13,14].
The heterogeneous top layer of the micro-nano pillars is replaced by two layers in the ID model. The first one is character-ized by an effective dielectric constant and an effective thickness where the effective refractive index is now obtained through a weighted mean of the dielectric constant based on volumes of pillars, air and biological layer. This effective thickness depends on the thickness of biological material anchored at the top of the columns that will be considered additively. The second one takes into account the effect of the proteins layer among pillars (see Fig. 2).
2.2. Model validation
For the purposes of validation, the ID model outputs have been carefully compared with our previous experimental and theoreti-cal models carried out. Two different sittuations are measured and calculated: a reference with no proteins on its sensing surface, and other one where the BICELL surface is completely coated with a biofilm. In particular, these experimental measurements are based on our preceding work [7]. The structure consisted of a rhombic lattice of SU-8 pillars 420 nm in height, 800 nm of lattice param-eter and 200 nm in diamparam-eter, characterized with a non polarized incident beam tilted 17° covering the spectral range from visible to near infrared (400-1100 nm). These results are also compared with previous 3D FDTD calculations, which also showed good agreement with experimental results.
Fig. 3 shows how the calculations are performed. There are two main situations: the reference structure, with the silicon substrate, the SÍO2 layer and the SU-8 pillars; this 3D sensitive cell turns into a ID model as shown in the Fig. 3, with the substrate and the SÍO2 layer, and an equivalent layer, which have a thickness equal to the height of the pillars, and a refractive index calculated as a weighted average of the dielectric constant, considering the volume of pillars and volume of air. The second step is considering the situation after a biofunctionalization process. In the experimental results, an anti-BSA/BSA immunassay was performed upon the cell; after several steps of functionalization and recognition, the surface can be con-sidered to be saturated of biological material. In this situation, both the surface of the pillars and the free SÍO2 surface between them, for optical purposes can be assumed to be covered by a single biofilm with a refractive index of 1.4 and a thickness of 16.5 nm. This turns into a model with two new equivalent layers. The first one is a layer with the same thickness of the biofilm considered (16.5 nm) [7], and its refractive index (1.4). This layer appears considering both the biological material placed over the SÍO2 surface and at the top of the pillars. There is another layer, with its thickness again equal to the height of the pillars, and in this case weigths the dielectric con-stant not only of the SU-8 and the air volume, but also the protein biolayer surrounding the lateral surface of the pillars.
Si pillars
iTTfTi 111
Si pillars
Si
s u s pillars
i I ^ ^
SiO
2500 nm
Si
Si0
2500 nm
Si
Fig. 1. Micro-nano patterning structures: (A) pillars over Si02 substrate, the optical image represents a number of BICELLs made of SU8 nano-pillars over transparent
substrate, (B) pillars over Si substrate, the SEM image is a BICELL based on SU-8 nano-pillars and (C) pillars over Si as substrate with and interference Si02 layer, the SEM
image are a corner of a BICELL based on Si nano-pillars.
spectra. For Dip2, this shift is of 12 nm (the new 1D model), 12.3 nm (3D FDTD) and 12.2 nm (Experimental).
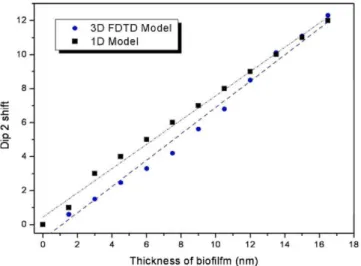
Additionally, and in order to test whether the new analytical model fits with the previously checked 3D model, we have also compared theoretically the shift of Dip2 as a function of the thick-ness of the biological layer. We have taken into account a range from 0 to 16.5nm, and calculated the optical response consider-ing increases of the biofilm thickness of 1.5 nm for both: the new ID analytical and 3D FDTD models. The increases are fitted to a linear curve, with slopes of 0.774 (3D FDTD) and 0.71329 (ID
analytical model). The conclusion for these two comparisons carried out are quite significant: firstly because the agreement between the new 1D analytical model and the available experimen-tal data is quite good, and secondly because this new model allows obtaining useful and powerful predictive time-effective results. In fact, the computing time is much more reduced compared with alternative methods, in particular with 3D FDTD calculations when a high-resolution gridding is required. For example, as an estima-tion, the calculations for Fig. 5 lasted several minutes for the new 1D analytical model, in contrast with a week of computation for the
Optical Interrogation
Pillars + Air +
[Proteins]
Stratified medium
Optical Interrogation
uivalent layer
[Proteins
Stratified medium
Si Substrate
Optical interrogation
i
Equivalent Layer [SU8+Air]
SiO
2(1000nm)
Si Substrate
Optical Interrogation
Equivalent Layer [SU8+Air+Proteins]
SiO
2(1000nm)
Si Substrate
Protein
¥ J
layer
Fig. 3. Schematic representation of the ID model, (a) Real situation and (b) equivalent model (reference and after biofunctionalization).
3D (using a high resolution gridding of 1.5 nm). Furthermore, this ID analytical model allows considering dispersion of the refrac-tive index as a function of the wavelength, feature which increases the time of simulation in the 3D FDTD model. Finally, thanks to this analytical simulation methodology, it makes suitable for per-forming huge number of simulations needed to properly optimize a given BICELLs, for example through detailed contours maps for the three figures of merit proposed in this work: sensitivity, Q-factor and amplitude, with at least six critical design parameters never before presented to the best of our knowledge.
2.3. Photonic structures optimization
The second goal of this article is to show how this model can be applied for optimizing biophotonic-sensing structures. The typical optical response in these typologies of sensor is exposed in Fig. 6. The reflectivity spectrum has several maxima and minima pro-duced by interference profile between the different layers. These interferences shift as the bioanalytes attach onto the sensing sur-face, as shown in the figure. The parameter used to evaluate the performance of the sensor is usually the total interference or res-onance shift (A.Shift) strongly connected with the sensitivity of the
biosensor. For this work, we have considered that not only A.Sh¡ft is
important, but also other aspects such as the signal amplitude and the full width at half maximum or minimum (FWHM) are important as drawn in Fig. 6.
There are several methods for theoretically calculating the per-formance of the sensor; the magnitude most commonly used is the limit of detection (LOD). For optical biosensors LOD can be cal-culated in terms of refractive index, as the minimum variation of refractive index on the surface of the sensing area that the system is able to resolve. LOD values are calculated considering the relation
between the spectral shift and the variation of refractive index, and also the uncertainty of the measurement of the spectral shift.
Thus, the usual strategy to optimize a biosensor is focusing on the maximization of this spectral shift. However, as some authors have pointed out [15], not only is important this magnitude, but also other aspects, such as the shape of the resonance, and the signal to noise ratio of the spectrum measured, among others. We have cho-sen three figures of merit that give a whole understanding of the shape of the resonances and its spectral shift, which are sensing quality factor, amplitude and full width at half maximum. Although these magnitudes are common knowledge for sensor scientists, are defined with Eqs. (5)-(7), which give information about the dip or peak signal width, signal amplitude (height) and wavelength displacement when adding a biological layer:
sensing quality factor (SQ-factor): X shift (5)
(Biolayer thickness)
amplitude factor (A-factor) = (Rmax - Rmin) x 100 (6)
quality factor (Q-factor): X resonance
FWHM (7)
For instance, in our previous work, for a biolayer of 16.5nm (BSA/anti-BSA) we reached a shift of 12.2 nm, the sensing quality factor has a value of 0.74(nm/nmbioiayer). A higher value of
SQ-factor represents a better sensing performance, and it is goal of the optimization. The values of Q-factor and A-factor for previous experiments are 108 and 49.7, respectively.
1
0.8
ce1 0.6
0.4
0.2
-Ref ID-model
- W Protein ID-Model
'600 650 7D0 750 800 850
Ref Experimental
- W Protein Experimental
1.4
1.2
1
0.8
0.6
0.4
• ' " ' • . . .
• Ref3D-Model
• W Protein 3D-Model
\ \
600 660 700 750
X(nrn)
800 850
Fig. 4. Comparative between experimental data, 3D model results and ID simplified model of equivalent layers.
i — i — | — i — | — i — | — i — | — . — | — . — | — . — |
-700 720 740 760 780 800 820 840 860 B80 900
wavelength (nm)
Fig. 6. Shift of the optical resonance when covering the sensing surface of the pillars with a biofilm.
transmission instead of reflection of light. Critical parameters in the fabrication of the cells are the diameter and the lattice parame-ter (or pitch) of the pillars. As a general rule, a higher compacting of pillars resulted on better values of LOD and sensitivity [10], but it makes also more complex the fabrication process. Finally the intro-duction of extra interferometric layers, for example of SÍO2 does not complicate the fabrication process, but can represent a gain in terms of several of the figures of merit analyzed.
Summarizing, we have studied a total of six configurations; SU-8 pillars over a glass substrate, and SU-SU-8 over silicon substrate, and SU-8 over an extra layer of 500 nm of SÍO2 over silicon. These three configurations have been replicated but using silicon pillars instead of SU-8. For each configuration, several combinations of pitch and diameter are studied.
index. With these six configurations several design parameters can be analyzed. First of all, it is the material of the pillars. Although the previous experiments with SU-8 presented good results, other materials are also interesting, in particular silicon, due to its spe-cial optical properties and also the possibility of reaching a highly compact pillars sensing cell.
Secondly, the material of the substrate also has its influence on the final results. Using glass instead of silicon wafer is a pos-sibility, which moreover allows the possibility of measuring in
Ü
1 7
IU
8
8
4
-
2-G - •
0
t
• 3D FDTD Model 1 , < ' • I D Model | , - : * '
, * > '
+
--•
••- ,'
3>/,>'' '
• •-•' s
, • - ' • ' ^*
. , • • ' ,*'
• \ y ,'
2 4 6 8 10 12 14 16 1(
Thickness of biofilfm (nm)
Fig. 5. Theoretical predictions of displacement of Dip2 versus thickness of biological material.
3. Results
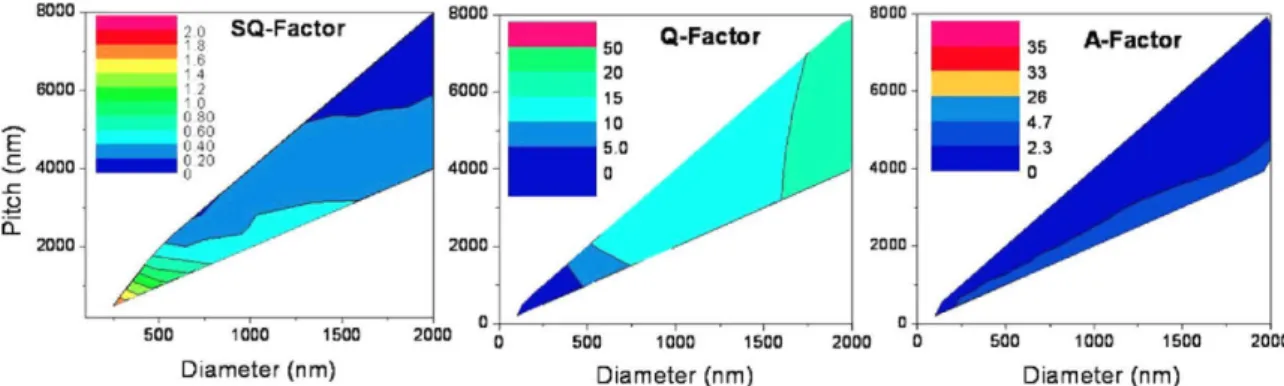
For a better understanding of the results, we have drawn con-tour maps for the three figures of merit and for each of the six configurations studied, with the pitch in the x axis and the diam-eter in y axis. These configurations can be divided into two main categories, depending on the material of the pillars used, silicon and SU-8 polymer. The height of the pillars has been considered to be related with the diameter, being the height equal to two times the diameter. Values for pitch range from 100 to 2000 nm, whereas values of pitch range from 200 to 8000 nm.
3.1. SU-8 pillars
We have simulated structures based on silicon pillars for three configurations: using a glass substrate, using a silicon substrate, and finally a silicon substrate with a 500 nm SÍO2 layer. Fig. 7 shows the results of the figures of merit for the glass substrate case. The higher values for SQ-factor are found for the highest compacting (diameter of 250 nm and pitch of 500 nm), reaching a value of 1.8. The A-factor has low values, with a maximum of 3.05 for the same configuration. This means that the resonances have in general low amplitude, due to the low reflectivity of the substrate.
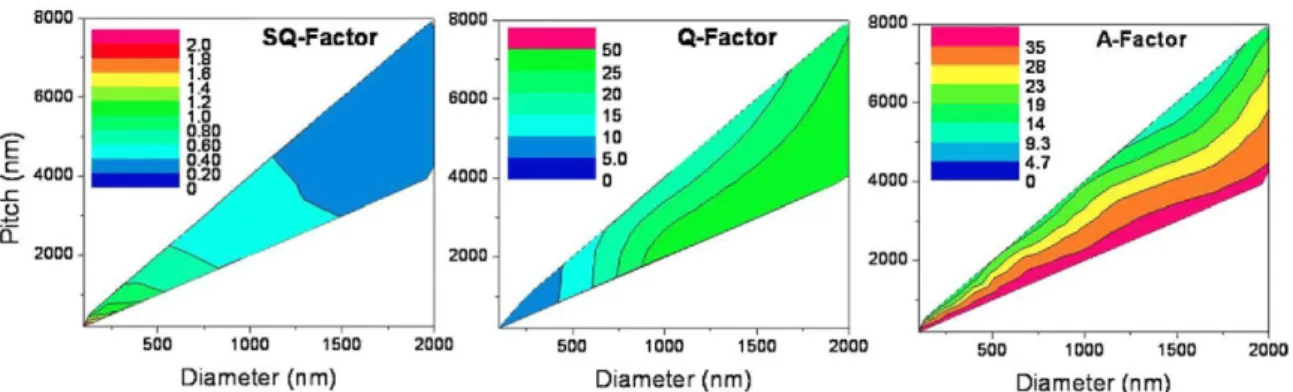
Fig. 8 shows the same calculations considering silicon substrate instead glass. In this case, both Qand A factors reach higher values. A general rule is that for more compact structures, SQ-factor is higher, whereas Q-factor reduces.
soco
I
sao 1000 1E00
Diameter (nm)
so 20 15 10 5 0 0
Q-Factor
A
^k
•
35 A-Factor ^M
"! B U U 0 5 0 0 1000 1500 2000 Diameter (nm)
Fig. 7. Maps for SU-8 pillars over a glass substrate.
500 1000 1500 D i a m e t e r ( n m )
S Q - F a c t o r
o
2000
B0DQ
2000
•
Q-Factor 50
20 15 10 5.0
0 ^ A
5 0 0 10DD 1 5 0 0
Diameter (nm)
•
•
35 A-Factor ^^k
2000 500 1000 1500 2000 D i a m e t e r ( n m )
Fig. 8. Maps for SU-8 pillars over a silicon substrate.
500 1000 1500
Diameter (nm)
8000
GOO0-500 1000 15(1»
D i a m e t e r ( n m )
2000
50 4b
411
it
Vh JO 1h 111 h II 0
Q-Factor
/
sooo
•
35 A-Factor ^d
0 .^r í ^ í - í í ^ '
50D 1D00 1500 D i a m e t e r ( n m )
500 1000 150D D i a m e t e r ( n m ) Fig. 9. Maps for SU-8 pillars over a silicon substrate and a 500 n m Si02 layer.
B00D
6000
500 1000 1500
D i a m e t e r ( n m )
2000
6000
500 1000 1500
Diameter (nm)
6000
a
500 moo 1500
Diameter (nm)
S000
000 600 1000 1500 200I
Diameter (nm)
Fig. 11. Silicon pillars over a silicon substrate.
35 28 23 19 14 9.3 4.7 0
A-Faclor
50D 1D0D 1500
Diameter (nm)
values compared with the two previous configurations; however SQ-factor decreases, from a maximum value of 1.8 and 2, to a max-imum of 1.5.
3.2. Silicon pillars
Fig. 10 shows the maps of the three figures of merit for a con-figuration of silicon pillars over a glass substrate. Both Q and A factors have higher values than in the case of SU-8 pillars over a glass substrate, whereas the values of SQ-factor are quite similar.
Fig. 11 shows the same situation as above, but with silicon sub-strate instead of glass. In this case, there is an improvement of the three figures of merit simultaneously, reaching values of SQ-factor of 2 and A-factor of 35.
Finally, Fig. 12 shows the maps for silicon pillars over a silicon substrate and with an intermediate layer of 500 nm of SÍO2. In this case, A-factor reaches its maximum for more configurations than in Fig. 11, whereas SQ-factor gets reduced.
3.3. Discussion of results
The comparison between SU-8 and silicon pillars shows that with both materials good results for the three figures of merit can be reached. SQ-factors up to two are reached for silicon pillars over silicon, representing an important improvement compared with previous results (SQ-factor of 0.74). However, with glass substrates both Q-factor and especially A-factor have low values due to the lower refractive index contrast. The resonances in these cases have low amplitude, and this makes recommendable the use of silicon substrates. An undesired increment in the signal to noise ratio of the spectral measurement can make the resonance undetectable. The same conclusion can be extracted also for SU-8 pillars over sili-con, in which, though A and Qfactors increase compared with glass
substrates, still remain too low for a proper detection. In contrast, the silicon pillars over silicon substrate configuration allows reach-ing good values for the three figures, and can be considered a good alternative to SU-8.
The introduction of a 500 nm Si02 produces an important gain
in the amplitude of the peaks of interference for SU-8 pillars, with values of A-factor of 35, but reducing also values of SQ-factor. If the thickness of this layer increases, this trend could be confirmed, with even lower values of SQ-factor and higher of A-factor, as found with previous results (0.75 and 49 for an extra layer of 1 u.m). There should be a thickness in which an optimal solution between SQ-factor and A-factor is found, and thus this is an interesting opti-mization for the future. However, for silicon pillars, there is not much improvement coming from the presence of an extra layer, and the performance even worsen, since the gain in terms of A-factor is low compared with a higher loss of SQ-factor.
A general conclusion for all the configurations is that having diameters and pitch among pillars as small as possible, results in better figures for SQ-factor, Q factor and A-factor. This is coherent with previous estimations, and must be the guideline for future BICELLs design. However, the fabrication process generally gives the limit of compacting for improving the biosensitive cell. Any advance in this field will lead to a better sensing performance. In contrast, structures with diameters and pitch up from 1.5 u.m present poor values for the six configurations.
The calculated figure maps also allow taking some other con-clusions about the BICELLs. It is not only important to obtain an optimized sensitive cell, but also achieving a robust design, in which slight changes in the dimensions of the pillars do not provoke important changes in the performance of the sensor. This has particular importance considering fabrication process of sub-micrometric pillars, in which the fabrication tolerances may be still significant with deviations from the nominal values that can be
E
£ - 4000
i
2D0Dz
2Q SQ-Factor Jk
0.80 , ^ H
0.60 . ^ H
0.40 . ^ H
0.20 . ^ H
D / ™
-2000
500 1D0O 1500
Diameter (nm)
500 1000 150D
Diameter (nm)
2000
35
73
23 19 14 9.3 4.7 0
A-Factcr
500 1000 1500
Diameter (nm)
easily in the order of 10-20%. For example, in Fig. 12 the SQ-factor reaches its maximum for a wide range of values, whereas in Fig. 8, though this maximum has a similar value, a small variation in pitch will represent a decrease of SQ-factor down to the half.
4. Conclusions
Two main general conclusions can be obtained for this work. Firstly that we have presented a simplified ID model for calcu-lating complex 3D micro-nano patterning materials, characterized vertically by spectrometry, and designed for biological sensing. This ID analytical method has presented good correlation with previous experimental results, and allows obtaining results nearly as accurate as other complex simulation methodologies, such as 3D FDTD algorithm, but with a great gain in terms of time. Sec-ondly, how this method can be applied for optimizing biophotonic sensing architectures. For this purpose, six different configurations of BICELLs are studied, in each varying diameter, pitch and height of the pillars, calculating for each of them three different figures of merit.
Several conclusions can be extracted from the optimization process. First of all, the sub-micro-nano scale increases the per-formance of the sensor, in contrast with pillars up from the micrometric scale. Moreover, reducing the pitch improves the three figures of merit. Secondly, using glass substrates is not recom-mended for both silicon and SU-8 pillars, since the amplitude of the resonances obtained is too low. In the case of SU-8 pillars, the presence of an extra interferometric layer allows increasing the amplitude of the dips, but with a cost in terms of SQ-factor val-ues; the same cannot be said for silicon pillars, where the results are better without the presence of this extra layer.
Finally, the short time of computation of the ID model pro-posed has allowed the calculation of multiple combinations of parameters. The design of an optimized biosensor is a complex pro-cess, in which other aspects must be considered; in particular the fabrication (feasible BICELLs) and the biofunctionalization (taking bioanalytes to the sensing surfaces). This tool is useful for making a complete analysis in the design process, in order to reach an opti-mized BICELL that also accomplish with requirements coming from fabrication and functionalization steps.
Acknowledgement
This work has been supported under the Project INNBIOD (REF: IPT-2011 -1429-010000) under the Spanish Ministry of Economy and Competitiveness.
References
[11 X. Fan, I.M. White, S.I. Shopova, H. Zhu, J.D. Suter, Y. Sun, Sensitive optical biosensors for unlabeled targets: a review, Analytica Chimica Acta 620 (2008) 8-26.
[2] J. Homola, Surface Plasmon resonance sensors for detection of chemical and biological species, Chemical Reviews 108 (2008) 462-493.
[3] F. Prieto, B. Sepúlveda, A. Calle, A. Llobera, C. Domínguez, A. Abad, A. Montoya, L.M. Lechuga, An integrated optical interferometric nanodevice based on silicon technology for biosensor applications, Journal of Nanotechnology 14 (2003) 907-912.
[41 C.A. Barrios, M.J. Bañuls, V. González-Pedro, KB. Gylfason, B. Sánchez, A. Griol, A. Maquieira, H. Sholstrolm, M. Holgado, R. Casquel, Label-free optical biosensing with slot-waveguides, Optics Letters 33 (2008) 708-710.
[5] M.C. Estevez, M. Alvarez, L.M. Lechuga, Integrated optical devices for lab-on-a-chip biosensing application, Laser and Photonics Reviews 6 (2012) 463-487.
[6] K. Schmitt, B. Schirmer, C. Hoffmann, A. Brandenburg, P. Meyrueis, Interfer-ometric biosensor based on optical planar waveguide sensor chips for label free detection of surface bound bioreactions, Biosensors and Bioelectronics 22 (2007)2591-2597.
[7[ M. Holgado, C.A. Barrios, F.J.Ortega, F.J. Sanza, R.Casquel, M.F. Laguna.J. Bañuls, D. Lopez-Romero, R. Puchades, A. Maquieira, Label-free biosensing by means of periodic lattices of high aspect-ratio SU-8 nanopillars, Biosensors and Bio-electronics 25(2010)2553-2558.
[8] F.J. Sanza, M. Holgado, F.J. Ortega, R. Casquel, D. López-Romero, J. Bañuls, M.F. Laguna, C.A. Barrios, R. Puchades, A. Maquieira, Bio-photonic sensing cells over transparent substrates for antigestrinone antibodies biosensing, Biosensors and Bioelectronics 26 (2011) 4842-4847.
[9] M. Holgado, R. Casquel, B. Sánchez, C. Molpeceres, M. Morales,J.L. Ocaña, Optical characterization of extremely small volumes of liquid in sub-micro-holes by simultaneous reflectivity, ellipsometry and spectrometry, Optics Express 15 (2007)13318-13329.
[10] R. Casquel, M. Holgado, F.J. Sanza, M.F. Laguna, C.A. Barrios, D. López-Romero, F.J. Ortega, M.J. Bañuls, A. Maquieira, R. Puchades, Optimization of a label-free biosensor vertically characterized based on a periodict lattice of high aspect ratio SU-8 nanopillars with a simplified 2D theoretical model, Physica Status SolidiC 8 (2011) 1087-1092.
[11] R. Scarmozzino, A. Gopinath, R. Pregia, S. Helfert, Numerical techniques for modeling guided-wave photonic devices, IEEE Journal of Selected Topics in Quantum Electronics 6 (2000) 150-162.
[12[ M. Born, E. Wolf, Principles of Optics, Pergamon Press, Oxford, UK, 1991, p. 62. [13] J.M. Leng, J.J. Sidorowich, M. Senko, J. Opsal, Simultaneous measurement of six
layers in a silicon on insulator film stack using visible near infrared spectropho-tometry and a single-wavelength beam profile reflecspectropho-tometry, Thin Solid Films 313-314(1998)270-275.
[14] J.T. Fanton, J. Opsal, D.L. Willeborg, S.M. Kelso, A. Rosencwaig, Multiparame-ter measurements of thin films using beam-profile reflectometry, Journal of Applied Physics 73 (1993) 7035-7040.
[15] I.M. White, X. Fan, On the performance quantification of resonant refractive index sensors, Optics Express 16 (2008) 1020-1028.
Biographies
Alvaro Lavin is associate professor of the Applied Physics Department at ETSII of the
Universidad Politécnica de Madrid and collaborates with the group of Micro-nano Photonics and Biophotonics of the Laser Center UPM in the design and simulation of biophotonic structures and devices since 2010.
Rafael Casquel holds Ingeniero Industrial (2004) degree from the Universidad
Politécnica de Valencia, Valencia, Spain. He moved in 2006 to continue with his thesis to the Laser Centre at the Universidad Politécnica de Madrid (UPM), where has remained working in the held of micro and nano optical biosensors, covering from the conception of the sensor, and its theoretical response, until its fabrication and biomolecular response, besides of developing applications of laser-based tech-niques to photonic chips developing and characterization. At the present moment he holds an assistant teacher position in the Applied Physics Department of the ETSII (UPM) and he is at the end of his PhD degree.
Francisco-Javier Sanza received IT engineer degree in 2008 (Universidad de
Navarra, Spain), a M.Sc. in photonics in 2009 (Universidad Autónoma de Madrid) and a M.Eng. in laser technology in 2011 (Universidad Politécnica de Madrid). He is currently research fellow and Ph.D. Student at the Laser Centre belonging to the Universidad Politécnica de Madrid since 2008. His research is focused on micro and nano-fabrication and characterization of optical biosensors.
Dra. María Fe Laguna Heras received the Ph.D. degree in chemistry (1999) at the
Polymer Institute form the Spanish National Research Council (CSIC), Madrid. She is senior research associate at the Laser Centre and associate professor at Applied Physics Department of the Technical University of Madrid. Her research interest is focused on polymer materials, surfaces modification for biological applications and development of micro-nanophotonic structures forbiosensing. She has participated in more than 15 research projects and has about 25 papers in international journals.
Dr. Eng. Miguel Holgado Bolaños received Ingeniero Industrial degree (1996) from
Universidad Politécnica de Madrid (UPM), and Doctor Ingeniero Industrial degree (Ph.D.) at the Instituto de Genua de Materiales (Spanish National Research Coun-cil - CSIC) from the same University (2000). He is currently group leader of the Micro-nano Photonics and Biohotonics at the UPM Laser Centre and associate pro-fessor at the Applied Physics Departement of ETSII (UPM). He has more than 4 years experience working in R&D in Industrial Sectors, was Spanish representative in the 5th and 6th European R&D Framework Programme as well as in other Research man-agement activities. He has lead and participated in numerous Research National and European projects. He is author/co-author of multiple publications in international journals cited more than 800 times and is author/co-author of a number of patents