Facultad de Ciencias Económicas y Empresariales
Departamento de Administración de Empresas
TESIS DOCTORAL
IMPLANTACIÓN DE TÉCNICAS DE CONTROL Y MEJORA
CONTINUA DE PROCESOS EN LAS EMPRESAS.
IMPLEMENTATION OF CONTROL AND CONTINUOUS
IMPROVEMENT TECHNIQUES IN BUSINESS PROCESS.
Autora/Author: Lidia Sánchez Ruiz
Directora/Supervisor: Beatriz Blanco Rojo
Agradecimientos
La realización de esta Tesis Doctoral ha sido una experiencia inolvidable en la que
me han acompañado muchas personas con su ánimo y su apoyo incansable.
En primer lugar, mi más sincero agradecimiento es para Beatriz Blanco, mi
directora. Gracias a ella, hace ya cinco años, tuve la oportunidad de descubrir el
desconocido mundo de la investigación. Durante todo este tiempo Beatriz ha sido más que
una directora, ha sido una compañera, una amiga, y me siento verdaderamente afortunada
por contar con su apoyo y su consejo.
Igualmente, sólo tengo palabras de agradecimiento para Juan Ramón Oreja de la
Universidad de La Laguna, Lluís Cuatrecasas de la Universidad Politécnica de Cataluña y
Ann Esain de la Universidad de Cardiff. Los tres aceptaron supervisarme durante mis
estancias de investigación, apostaron por ayudarme cuando apenas me conocían y me
hicieron sentir parte de su equipo.
Quiero dar las gracias también a los compañeros del Departamento de
Administración de Empresas, sobre todo a los jóvenes investigadores con los que he
compartido el camino, los pequeños logros y las inquietudes. Un gracias muy afectuoso para
Marta, “mi vecina”, con quien he vivido aventuras únicas en tierras holandesas.
Patricia e Inés tienen una condición especial. Empezamos siendo compañeras, pero
ahora somos amigas, puede que incluso “primas”. A ellas les agradezco hacerme el día a
día más llevadero, darle un toque de color a los días en los “zulos” y estar ahí en los
momentos duros con las terapias de grupo, especialmente tras haber sobrevivido a algún
“agujero negro”. Vosotras me entendéis. Gracias.
no tan nuevos y los que mantengo desde la infancia, porque siempre han tenido palabras de
ánimo y han entendido mis ausencias.
Para mis padres, Alfredo y Marta, sólo tengo palabras de agradecimiento. Su
confianza en mí, su apoyo incondicional, sus palabras de ánimo en los momentos más duros,
su alegría por mis logros, y por encima de todo su cariño, han hecho posible esta Tesis y
todos y cada uno de mis pequeños logros. Espero que sintáis esta Tesis como vuestra porque,
en cierto modo, lo es.
A mis queridos abuelos, Emilio y Regina, mis segundos padres, les debo todo. Su
amor incondicional, aún sin saber muy bien qué hago todo el día en el “cole”, me ha servido
de aliciente en los momentos difíciles. Por ser como sois, por todos los días y los mediodías
juntos, porque confiasteis y confiáis en mí, gracias.
Al resto de miembros de mi familia, porque para trabajar bien también hace falta
divertirse y vosotros conseguís que lo que haga en cada una de nuestras reuniones
multitudinarias, gracias.
Y por último, muchísimas gracias a Germán. Por estar ahí, por hacerme reír, por tus
abrazos, por tu ayuda, por tu comprensión, por tu paciencia, y principalmente porque me
hace feliz estar a tu lado, gracias. Este nuevo logro no sería lo mismo sin alguien como tú a
mi lado para celebrarlo.
Gracias a todos
Lidia
VII
Índice en español VII
English index XIII
Índice de tablas XIX
List of tables XXVII
Índice de gráficos XXXV
List of graphs XXXVII
Índice de ilustraciones XXXIX
List of illustrations XLI
PhD Dissertation Summary 1
PARTE I. MARCO TEÓRICO
Capítulo 1. Introducción 63
1.1. Antecedentes 63
1.2. Objetivos 64
1.3. Plan de trabajo 66
Capítulo 2. Evolución de la Dirección de Operaciones 69 Capítulo 3. Los grandes cambios de la Dirección de Operaciones 79
3.1. Cambios en el entorno 79
3.2. Nuevos sistemas de gestión 82
3.2.1. Teoría de las Limitaciones 82
3.2.2. Lean Management 83
3.2.2.1. Los orígenes del Lean Management 83
3.2.2.2. ¿Qué es el Lean Management? 85
3.2.2.3. Principios del Lean Management 87
VIII
3.3. Gestión de la calidad 90
3.3.1. ISO 9000 de calidad 94
3.3.2. Premio Deming 98
3.3.3. EFQM 99
3.3.4. Malcom Baldrige National Quality Award 102
3.4. Gestión por procesos y mejora continua 104
3.4.1. Relación con los cambios en el entorno 104 3.4.2. Relación con los nuevos sistemas de gestión 105
3.4.3. Relación con la gestión de la calidad 105
Capítulo 4. Estado del Arte 107
4.1. Evolución del estudio de la gestión por procesos 107 4.1.1. Revisión internacional de la gestión por procesos 107 4.1.2. Revisión de la gestión por procesos en la literatura hispana 111
4.2. Evolución del estudio de la mejora continua 115
4.2.1. Revisión internacional de la mejora continua 115 4.2.2. Revisión de la mejora continua en literatura hispana 119
4.3. Conclusiones del capítulo 122
Capítulo 5. La Gestión por Procesos 125
5.1. Concepto clave: proceso 125
5.2. La gestión por procesos 132
5.3. Razones para implantar la gestión por procesos 135 5.4. Obstáculos en la implantación de la gestión por procesos 136 5.5. Factores que facilitan la implantación de la gestión por procesos 136 5.6. Beneficios derivados de la implantación de la gestión por procesos 139 5.7. Metodologías de implantación de la gestión por procesos 141 5.8. Grado de desarrollo de la gestión por procesos 157
Capítulo 6. La Mejora Continua 163
IX 6.3. Obstáculos en la implantación de la mejora continua 167 6.4. Factores que facilitan la implantación de la mejora continua 169 6.5. Beneficios derivados de la implantación de la mejora continua 171 6.6. Metodologías de implantación de la mejora continua 172
6.7. Grado de desarrollo de la mejora continua 182
Capítulo 7. Herramientas asociadas 187
7.1. Herramientas de análisis 187
7.2. Herramientas de mejora y control 193
7.3. Herramientas del Lean Management 199
PARTE II. ESTUDIO EMPÍRICO
Capítulo 8. Diseño del Estudio Empírico 203
8.1. Objetivos e hipótesis 203
8.2. Identificación de la población objetivo 205
8.3. Diseño de la encuesta y cuestionarios asociados 208
8.3.1. Revisión bibliográfica 209
8.3.2. Elaboración del boceto inicial y depuración del cuestionario 209 8.3.3. Obtención de los cuestionarios finales 210
8.4. Envío del cuestionario 211
8.5. Tratamiento de los datos 213
Capítulo 9. Metodología 215
9.1. La Teoría de la Medición de Rasch (TMR) 215
9.2. La Teoría de Medición de Rasch en Administración de Empresas 218
9.3. Aplicaciones de la metodología 220
9.3.1. Dimensionalidad del constructo 220
X
9.3.3. Análisis de categorías 228
9.3.4. Jerarquización/Calibración de los ítems 229
9.3.5. Análisis DIF 232
Capítulo 10. Análisis Descriptivo 235
10.1. Descripción y representatividad de la muestra total de empresas 235 10.2. Grado de implantación de la gestión por procesos y características
de las empresas que lo practican 239
10.3. Grado de implantación de la mejora continua y características
de las empresas que lo practican 244
10.4. Análisis descriptivo del segundo bloque de la encuesta 249
Capítulo 11. Resultados Asociados a la Gestión por Procesos 253 11.1. Motivos para implantar la gestión por procesos 253 11.2. Obstáculos encontrados durante la implantación de la gestión por
procesos 264
11.3. Facilitadores encontrados durante la implantación de la gestión por
procesos 274
11.4. El proceso de implantación de la gestión por procesos 287 11.5. Grado de implantación de la gestión por procesos 293 11.6. Beneficios derivados de la implantación de la gestión por procesos 297
11.7. Otros sistemas y herramientas de gestión 302
Capítulo 12. Resultados Asociados a la Mejora Continua 303
12.1. Motivos para implantar la mejora continua 303
12.2. Obstáculos encontrados durante la implantación de la mejora
continua 313
12.3. Facilitadores encontrados durante la implantación de la mejora
continua 324
12.4. El proceso de implantación de la mejora continua 335
12.5. Nivel de desarrollo de la mejora continua 341
12.6. Herramientas utilizadas a lo largo de la implantación 343 12.7. Control y beneficios derivados de la mejora continua 356
XI
12.10. Otros sistemas y herramientas de gestión 366
Capítulo 13. Conclusiones, limitaciones y líneas futuras de investigación 369
13.1. Conclusiones 369
13.1.1. Conclusiones relativas al grado de implantación 369 13.1.2. Conclusiones relativas a la gestión por procesos 371 13.1.3. Conclusiones relativas a la mejora continua 376 13.1.4. Conclusiones relativas a la metodología 382 13.2. Limitaciones del estudio y futuras líneas de investigación 382
Chapter 13. Conclusions, limitations and future research lines 385
13.1. Conclusions 385
13.1.1. Conclusions related to the level of implementation 385 13.1.2. Conclusions related to process management 387 13.1.3. Conclusions related to continuous improvement 392
13.1.4. Conclusions related to methodology 397
13.2. Limitations and future research lines 397
Referencias 401 Anexo 1. Cuestionario 1 419 Appendix 1. Questionnaire 1 421 Anexo 2. Cuestionario 2 423 Appendix 2. Questionnaire 2 427 Anexo 3. Cuestionario 3 431 Appendix 3. Questionnaire 3 437
XIII
Spanish index VII
English index XIII
List of tables (Spanish) XIX
List of tables (English) XXVII
List of graphs (Spanish) XXXV
List of graphs (English) XXXVII
List of illustrations (Spanish) XXXIX
List of illustrations (English) XLI
PhD Dissertation Summary 1
PART I. THEORETICAL FRAMEWORK
Chapter 1. Introduction 63
1.1. Background 63
1.2. Objectives 64
1.3. Work plan 66
Chapter 2. Evolution of the Operations Management field: topics of interest 69 Chapter 3. Major changes occurred in the Operations Management arena 79 3.1. Changes in the business environment conditions 79
3.2. New management systems 82
3.2.1. Theory of Constraints 82
3.2.2. Lean Management 83
3.2.2.1. The origins of Lean Management 83
3.2.2.2. What is Lean Management? 85
3.2.2.3. Lean Management principles 87
XIV
3.3. Quality Management 90
3.3.1. ISO 9000 94
3.3.2. Deming Prize 98
3.3.3. EFQM 99
3.3.4. Malcom Baldrige National Quality Award 102 3.4. Process management and continuous improvement 104 3.4.1. Relationship with changes in the business environment 104 3.4.2. Relationship with new management systems 105
3.4.3. Relationship with quality management 105
Chapter 4. State of the art 107
4.1. Process management literature review 107
4.1.1. International process management literature review 107 4.1.2. Hispanic process management literature review 111
4.2. Continuous improvement literature review 115
4.2.1. International continuous improvement literature 115 4.2.2. Hispanic continuous improvement literature 119
4.3. Chapter conclussions 122
Chapter 5. Process management 125
5.1. Key concept: process 125
5.2. Process management 132
5.3. Reasons to implement process management techniques 135
5.4. Process management barriers 136
5.5. Process management enablers 136
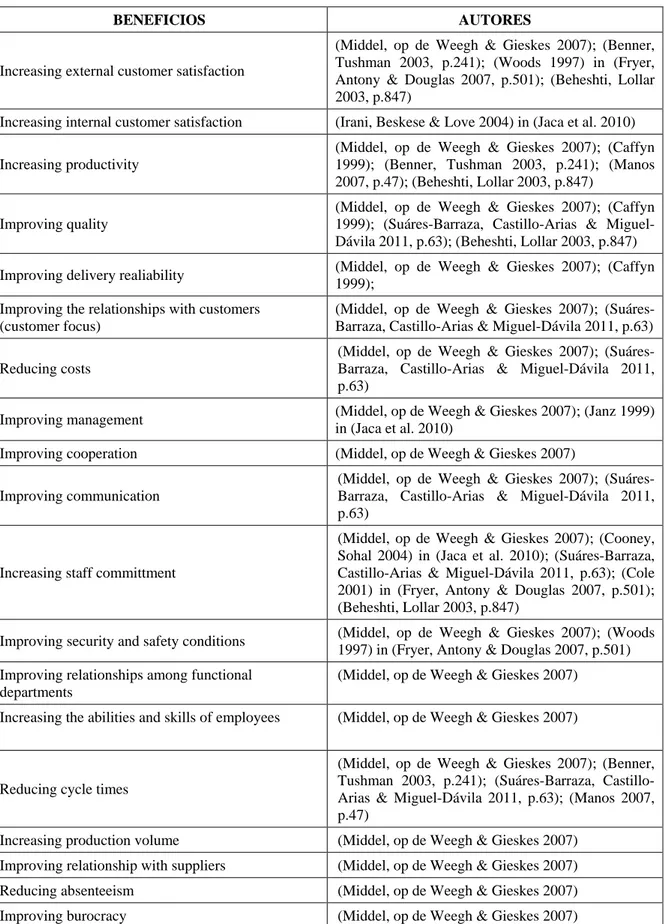
5.6. Process management benefits 139
5.7. Process management implementation methodologies 141
5.8. Process management evolutionary models 157
Chapter 6. Continuous improvement 163
XV
6.3. Continuous improvement barriers 167
6.4. Continuous improvement enablers 169
6.5. Continuous improvement benefits 171
6.6. Continuous improvement implementation methodologies 172
6.7. Continuous improvement evolutionary models 182
Chapter 7. Associated tools 187
7.1. Analysis tools 187
7.2. Improvement and control tools 193
7.3. Lean Management tools 199
PART II. EMPIRICAL STUDY
Chapter 8. Research design 203
8.1. Research objectives and hypotheses 203
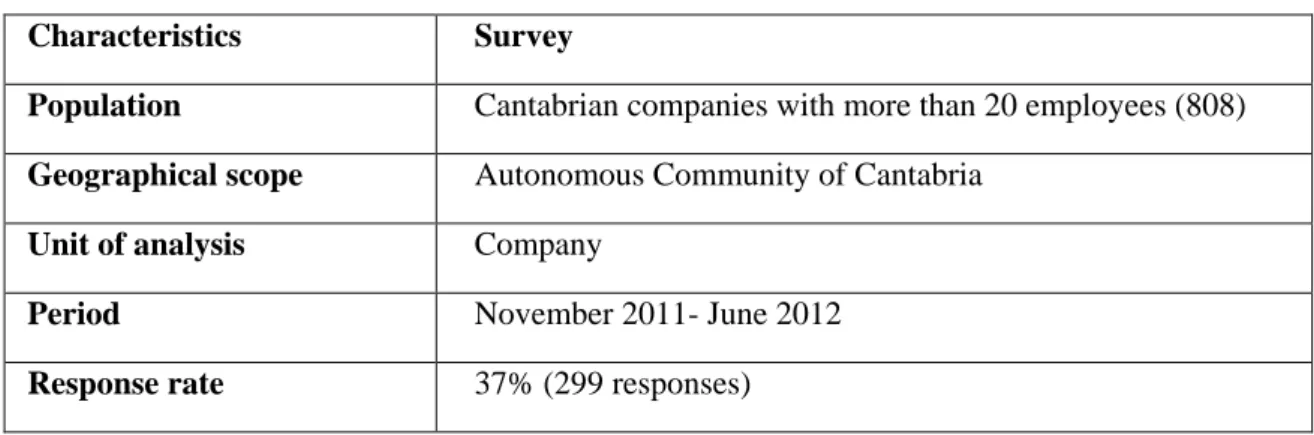
8.2. Target population definition 205
8.3. Survey design 208
8.3.1. Literature review 209
8.3.2. Draft preparation and screening 209
8.3.3. Final survey design 210
8.4. Questionnaire dispatch 211
8.5. Data treatment 213
Chapter 9. Methodology 215
9.1. Rasch Measurement Theory (RMT) 215
9.2. RMT in the Business and Management field 218
9.3. Applications of the methodology 220
9.3.1. Dimensionality analysis 220
XVI
9.3.3. Category analysis 228
9.3.4. Classification of items 229
9.3.5. Differential item functioning analysis 232
Chapter 10. Descriptive analysis 235
10.1. Sample representativeness 235
10.2. Process management level of implementation and characteristics of
the companies that practice it 239
10.3. Continuous improvement level of implementation and characteristics of
the companies that practice it 244
10.4. Descriptive analysis of the second part of the survey 249
Chapter 11. Process management results 253
11.1. Process management reasons 253
11.2. Process management barriers 264
11.3. Process management enablers 274
11.4. Process management implementation stages 287
11.5. Level of development achieved during the implementation 293
11.6. Process management benefits 297
11.7. Other management systems and tools 302
Chapter 12. Continuous improvement results 303
12.1. Continuous improvement reasons 303
12.2. Continuous improvement barriers 313
12.3. Continuous improvement enablers 324
12.4. Continuous improvement implementation stages 335 12.5. Level of development achieved during the implementation 341
12.6. Tools used during the implementation 343
12.7. Continuous improvement indicators and benefits 356
12.8. Training sessions 361
XVII Chapter 13. Conclusions, limitations and future research lines (Spanish) 369
Chapter 13. Conclusions, limitations and future research lines 385
13.1. Conclusions 385
13.1.1. Conclusions related to the level of implementation 385 13.1.2. Conclusions related to process management 387 13.1.3. Conclusions related to continuous improvement 392
13.1.4. Conclusions related to methodology 397
13.2. Limitations and future research lines 397
References 401 Appendix 1 (Spanish) 419 Appendix 1. Questionnaire 1 421 Appendix 2 (Spanish) 423 Appendix 2. Questionnaire 2 427 Appendix 3 (Spanish) 431 Appendix 3. Questionnaire 3 437
XIX Capítulo 2. Evolución de la Dirección de Operaciones 69
Tabla 2.1. Definiciones de Dirección de Operaciones 69
Tabla 2.2. Contenidos de la Agenda de Investigación en Dirección de
Operaciones en los ochenta 75
Tabla 2.3. Temas de mayor interés para las empresas en los noventa 76 Tabla 2.4. Temas de investigación de la primera década del siglo XXI 77 Tabla 2.5. Temas relacionadas con los nuevos sistemas de gestión
y la gestión de la calidad 77
Capítulo 3. Los grandes cambios de la Dirección de Operaciones 79 Tabla 3.1. Evolución y características de la calidad 92
Tabla 3.2. Criterios y subcriterios del modelo EFQM 101
Tabla 3.3. Criterios y subcriterios del Modelo Malcom Baldrige 103
Capítulo 4. Estado del Arte 107
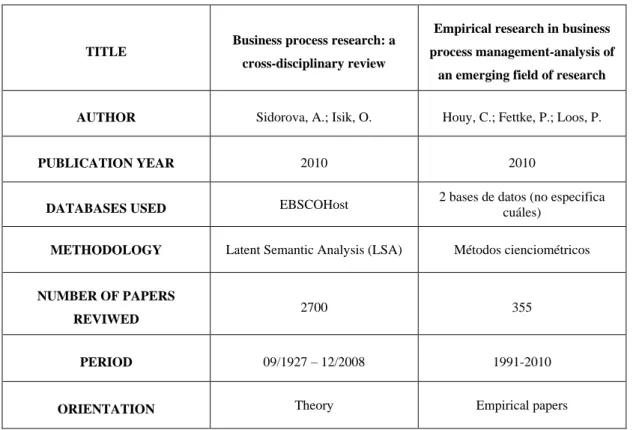
Tabla 4.1. Características de los trabajos de revisión sobre gestión por
procesos consultados 108
Tabla 4.2. Evolución del número de artículos publicados sobre GPP 108 Tabla 4.3. Distribución por países de las publicaciones empíricas sobre GPP 110 Tabla 4.4. Metodologías utilizadas en los trabajos empíricos 110 Tabla 4.5. Revistas que más publican sobre gestión por procesos 112 Tabla 4.6. Temáticas más comunes en el campo de la gestión por proceso 114
Tabla 4.7. Número de contribuciones por región 116
Tabla 4.8. Temáticas tratadas en el campo de la mejora continua 118
Tabla 4.9. Metodologías más utilizadas 118
Tabla 4.10. Sectores de estudio 119
Tabla 4.11. Temáticas tratadas en el campo de la mejora continua
(Literatura hispana) 121
Tabla 4.12. Metodologías utilizadas en el campo de la mejora continua
XX
Tabla 4.13. Sectores de aplicación de los estudios empíricos
(Literatura hispana) 122
Capítulo 5. La Gestión por Procesos 125
Tabla 5.1. Definiciones de proceso 125
Tabla 5.2. Tipos de proceso según diferentes criterios de clasificación 127
Tabla 5.3. Definiciones de gestión por procesos 132
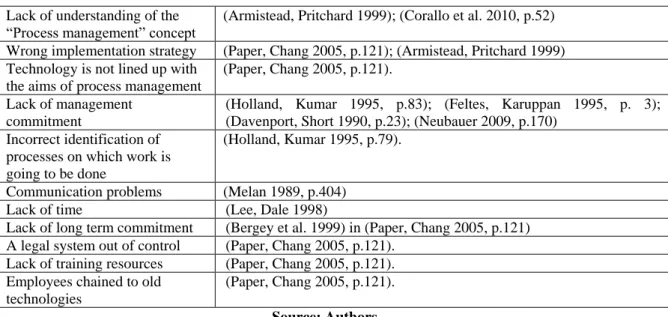
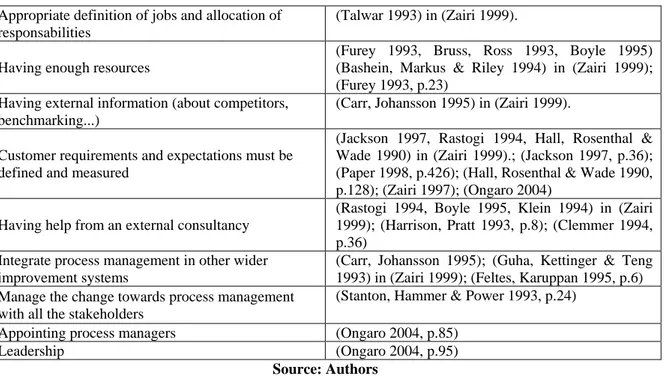
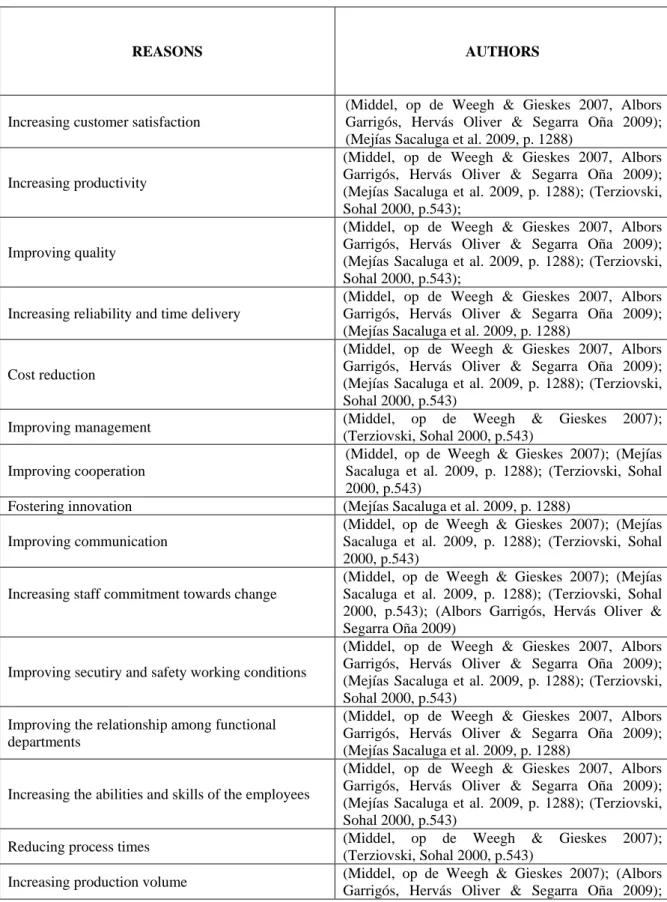
Tabla 5.4. Razones o motivos para implantar la gestión por procesos 135 Tabla 5.5. Obstáculos a la implantación de la gestión por procesos 136 Tabla 5.6. Facilitadores en la implantación de la gestión por procesos 137 Tabla 5.7. Beneficios derivados de la gestión por procesos 139 Tabla 5.8. Metodologías de implantación de la gestión por procesos 142
Tabla 5.9. Clasificación de las metodologías 156
Tabla 5.10. Modelos de madurez de la gestión por procesos 157
Capítulo 6. La Mejora Continua 163
Tabla 6.1. Definiciones de mejora continua 163
Tabla 6.2. Razones o motivos para implantar un programa de mejora continua 165 Tabla 6.3. Obstáculos a la implantación de la mejora continua 167 Tabla 6.4. Facilitadores en la implantación de la mejora continua 169 Tabla 6.5. Beneficios derivados de la mejora continua 171 Tabla 6.6. Metodologías de implantación de la mejora continua 173 Tabla 6.7. Modelos evolutivos de la mejora continua en la empresa 183
Capítulo 7. Herramientas 187
Tabla 7.1. Comparativa de los diferentes sistemas de gestión del mantenimiento 198
Capítulo 8. Diseño del Estudio Empírico 203
Tabla 8.1. Distribución de las empresas cántabras por número de
asalariados (2011) 206
Tabla 8.2. Distribución por asalariados de las empresas cántabras
XXI Tabla 8.4. Distribución por sectores de las empresas cántabras de más
de 20 empleados. Año 2011. 208
Tabla 8.5. Evolución del número de empresas cántabras por asalariados
(2008-2011) 208
Capítulo 9. Metodología 215
Tabla 9.1. Tabla de los residuales estandarizados de la varianza (autovalores) 221 Tabla 9.2. Fiabilidad y validez globales de las medidas 224
Tabla 9.3. Análisis de categorías 228
Capítulo 10. Análisis Descriptivo 235
Tabla 10.1. Ficha técnica del envío del cuestionario 1 235 Tabla 10.2. Distribución de respuestas cuestionario 1 236 Tabla 10.3. Distribución por tamaño de la población inicial y de la muestra
del cuestionario 1 237
Tabla 10.4. Representatividad de la muestra en base al tamaño de las
empresas 237
Tabla 10.5. Distribución por sectores de la población inicial y de la muestra
del cuestionario 1 238
Tabla 10.6. Representatividad de la muestra en base al sector de las
empresas 239
Tabla 10.7. Distribución por tamaño de la población y de la muestra
con GPP 240
Tabla 10.8. Distribución por sectores de la población y de la muestra
con GPP (CNAE 2009) 241
Tabla 10.9. Distribución por tipo de empresa de la muestra inicial (299) y
de la muestra de empresas con GPP 242
Tabla 10.10. Distribución por nacionalidad de la muestra de empresas
con GPP 242
Tabla 10.11. Distribución por ámbito de actuación de la muestra de
empresas con GPP 243
Tabla 10.12. Perfil de las personas que respondieron al cuestionario 1 244 Tabla 10.13. Distribución por tamaño de la población y de la muestra
con MC 245
Tabla 10.14. Distribución por sectores de la población y de la muestra
XXII
Tabla 10.15. Distribución por tipo de empresa de la muestra inicial (299) y
de la muestra de empresas con MC 247
Tabla 10.16. Distribución por nacionalidad de la muestra de empresas
con MC 247
Tabla 10.17. Distribución por ámbito de actuación de la muestra de
empresas con MC 248
Tabla 10.18. Perfil de las personas que respondieron al cuestionario 1 248
Tabla 10.19. Distribución de respuestas obtenidas 250
Tabla 10.20. Resumen de los tres escenarios planteados 251 Tabla 10.21. Tamaño muestral necesario para cada escenario 251
Tabla 10.22. Ficha técnica del cuestionario 2 252
Tabla 10.23. Ficha técnica del cuestionario 3 252
Capítulo 11. Resultados Asociados a la Gestión por Procesos 253 Tabla 11.1. Tabla resumen del proceso de selección/descarte de razones a la
implantación de la gestión por procesos 254
Tabla 11.2. Razones para implantar la gestión por procesos 255 Tabla 11.3. Tabla de los residuales estandarizados de la varianza
(Razones GPP- Caso 1) 255
Tabla 11.4. Fiabilidad y validez globales de las medidas
(Razones GPP- Caso 1) 256
Tabla 11.5. Tabla de los residuales estandarizados de la varianza
(Razones GPP- Caso 2) 258
Tabla 11.6. Fiabilidad y validez globales de las medidas
(Razones GPP- Caso 2) 258
Tabla 11.7. Análisis de categorías (Razones GPP – Caso 2) 260 Tabla 11.8. Razones para implantar la gestión por procesos ordenadas
según su importancia 262
Tabla 11.9. Resultados asociados a las hipótesis Razones para implantar
la gestión por procesos 263
Tabla 11.10. Tabla resumen del proceso de selección/descarte de obstáculos
a la implantación de la gestión por procesos 264
Tabla 11.11. Obstáculos a la implantación de la gestión por procesos 265 Tabla 11.12. Tabla de los residuales estandarizados de la varianza
(Obstáculos GPP- Caso 1) 265
Tabla 11.13. Fiabilidad y validez globales de las medidas
XXIII
(Obstáculos GPP – Caso 1) 266
Tabla 11.15. Tabla de los residuales estandarizados de la varianza
(Obstáculos GPP- Caso 2) 267
Tabla 11.16. Fiabilidad y validez globales de las medidas
(Obstáculos GPP- Caso 2) 268
Tabla 11.17. Análisis de categorías (Obstáculos GPP – Caso 2) 270 Tabla 11.18. Obstáculos a la implantación de la gestión por procesos
ordenados según su importancia 271
Tabla 11.19. Resultados asociados a las hipótesis Obstáculos para implantar
la gestión por procesos 273
Tabla 11.20. Tabla resumen del proceso de selección/descarte de facilitadores
a la implantación de la gestión por procesos 274
Tabla 11.21. Facilitadores de la implantación de la gestión por procesos 276 Tabla 11.22. Tabla de los residuales estandarizados de la varianza
(Facilitadores GPP- Caso 1) 277
Tabla 11.23. Tabla de los residuales estandarizados de la varianza
(Facilitadores GPP- Caso 2) 278
Tabla 11.24. Composición final del constructo “Facilitadores de la
implantación de la gestión por procesos” 278
Tabla 11.25. Fiabilidad y validez globales de las medidas
(Facilitadaores GPP- Caso 2) 279
Tabla 11.26. Tabla de los residuales estandarizados de la varianza
(Facilitadores GPP- Caso 3) 281
Tabla 11.27. Fiabilidad y validez globales de las medidas
(Facilitadores GPP- Caso 3) 281
Tabla 11.28. Sujetos ordenados según desajuste que presentan
(Facilitadores GPP – Caso 3) 282
Tabla 11.29. Análisis de categorías (Facilitadores GPP – Caso 3) 283 Tabla 11.30. Facilitadores de la implantación de la gestión por procesos
ordenados según su importancia 284
Tabla 11.31. Resultados asociados a las hipótesis Facilitadores para implantar
la gestión por procesos 286
Tabla 11.32. Pregunta 2, cuestionario 2 (anexo 2) 288
Tabla 11.33. Número de empresas que han participado en cada etapa 292
Tabla 11.34. Pregunta 8, Cuestionario 2 (Anexo 2) 294
XXIV
Tabla 11.36. Tabla resumen del proceso de selección/descarte de beneficios
de la implantación de la gestión por procesos 297
Tabla 11.37. Beneficios derivados de la gestión por procesos 298 Tabla 11.38. Ordenación de beneficios derivados de la gestión por procesos 300 Tabla 11.39. Resultados asociados a las hipótesis Beneficios de implantar
la gestión por procesos 302
Tabla 11.40. Número de empresas que practican cada filosofía 302
Capítulo 12. Resultados Asociados a la Mejora Continua 303 Tabla 12.1. Tabla resumen del proceso de selección/descarte de razones a la
implantación de la mejora continua 304
Tabla 12.2. Razones para implantar la mejora continua 304 Tabla 12.3. Tabla de los residuales estandarizados de la varianza
(Razones MC- Caso 1) 305
Tabla 12.4. Fiabilidad y validez globales de las medidas
(Razones MC- Caso 1) 306
Tabla 12.5. Tabla de los residuales estandarizados de la varianza
(Razones MC- Caso 2) 307
Tabla 12.6. Fiabilidad y validez globales de las medidas
(Razones MC- Caso 2) 308
Tabla 12.7. Análisis de categorías (Razones MC – Caso 2) 309 Tabla 12.8. Razones para implantar la mejora continua ordenadas
según su importancia 311
Tabla 12.9. Resultados asociados a las hipótesis Razones para implantar
la mejora continua 313
Tabla 12.10. Tabla resumen del proceso de selección/descarte de obstáculos
a la implantación de la mejora continua 314
Tabla 12.11. Obstáculos a la implantación de la mejora continua 315 Tabla 12.12. Tabla de los residuales estandarizados de la varianza
(Obstáculos MC- Caso 1) 316
Tabla 12.13. Fiabilidad y validez globales de las medidas
(Obstáculos MC- Caso 1) 316
Tabla 12.14. Tabla de los residuales estandarizados de la varianza
(Obstáculos MC- Caso 2) 318
Tabla 12.15. Tabla de los residuales estandarizados de la varianza
XXV
(Obstáculos MC- Caso 3) 319
Tabla 12.17. Análisis de categorías (Obstáculos MC – Caso 3) 320 Tabla 12.18. Obstáculos a la implantación de la mejora continua
ordenados según su importancia 322
Tabla 12.19. Resultados asociados a las hipótesis Obstáculos para implantar
la mejora continua 324
Tabla 12.20. Tabla resumen del proceso de selección/descarte de facilitadores
a la implantación de la mejora continua 325
Tabla 12.21. Facilitadores de la implantación de la mejora continua 326 Tabla 12.22. Tabla de los residuales estandarizados de la varianza
(Facilitadores MC- Caso 1) 327
Tabla 12.23. Tabla de los residuales estandarizados de la varianza
(Facilitadores MC- Caso 2) 328
Tabla 12.24. Composición final del constructo “Facilidad implantación
de la mejora continua” 328
Tabla 12.25. Fiabilidad y validez globales de las medidas
(Facilitadaores MC- Caso 2) 329
Tabla 12.26. Tabla de los residuales estandarizados de la varianza
(Facilitadores MC- Caso 3) 330
Tabla 12.27. Fiabilidad y validez globales de las medidas
(Facilitadores MC- Caso 3) 331
Tabla 12.28. Análisis de categorías (Facilitadores MC – Caso 3) 332 Tabla 12.29. Facilitadores de la implantación de la mejora continua
ordenados según su importancia 333
Tabla 12.30. Resultados asociados a las hipótesis Facilitadores para implantar
la mejora continua 335
Tabla 12.31. Mecanismos de implantación de la mejora continua más
utilizados por las empresas 336
Tabla 12.32. Número de empresas que han participado en cada etapa 339
Tabla 12.33. Etapas del Modelo de Bessant 342
Tabla 12.34. Listado de herramientas 343
Tabla 12.35. Listado de empresas según experiencia 345
Tabla 12.36. Prueba Chi Cuadrado: Uso de herramientas vs etapa Bessant 348 Tabla 12.37. Prueba Chi Cuadrado: Uso de herramientas vs experiencia 350
XXVI
Tabla 12.38. Prueba Chi Cuadrado: Uso de herramientas vs tamaño de la
empresa 352
Tabla 12.39. Prueba Chi Cuadrado: Uso de herramientas vs tipo de empresa 354 Tabla 12.40. Beneficios identificados e indicadores propuestos 356
Tabla 12.41. Indicadores propuestos 358
Tabla 12.42. Composición de los equipos de mejora 366
Tabla 12.43. Número de empresas que practican cada filosofía 367
Capítulo 13. Conclusiones, limitaciones y líneas futuras de investigación 369 Tabla 13.1. Razones para implantar la gestión por procesos ordenadas
según su importancia 371
Tabla 13.2. Obstáculos a la implantación de la gestión por procesos
ordenados según su importancia 372
Tabla 13.3. Facilitadores de la implantación de la gestión por procesos
ordenados según su importancia 373
Tabla 13.4. Razones para implantar la mejora continua ordenadas
según su importancia 376
Tabla 13.5. Obstáculos a la implantación de la mejora continua
ordenados según su importancia 377
Tabla 13.6. Facilitadores de la implantación de la mejora continua
XXVII
LIST OF TABLES
Chapter 2. Evolution of the Operations Management field: topics of interest 69
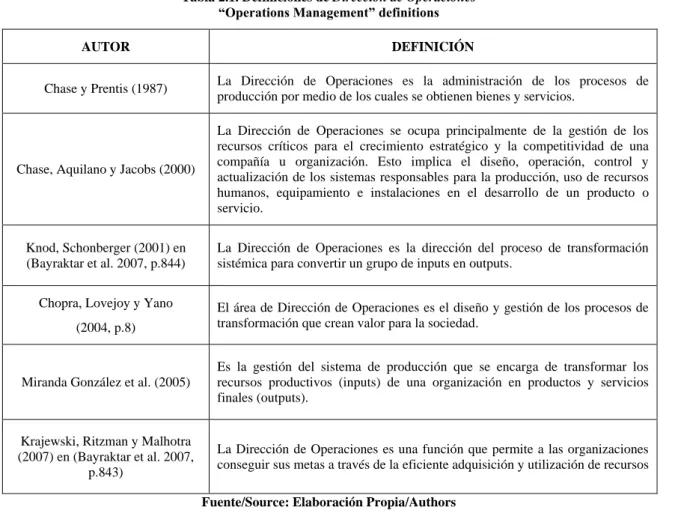
Table 2.1. “Operations Management” definitions 69
Table 2.2. Content of the Eighties Operations Management Research Agenda 75 Table 2.3. Most interesting topics for companies in the nineties 76 Table 2.4. Main topics in the first decade of the XXI century 77 Table 2.5. Topics related with new management systems and quality
Management 77
Chapter 3. Major changes occurred in the Operations Management arena 79 Table 3.6. Quality management evolution and characteristics 92
Table 3.7. EFQM Model Criteria 101
Table 3.8. Malcom Baldrige Excellence Model Criteria 103
Chapter 4. State of the art 107
Table 4.9. Main characteristics of the international process management
reviews 108
Table 4.10. Evolution of the number of papers about process management
published 108
Table 4.11. Number of process management papers published by country 110 Table 4.4. Methodologies used in the empirical papers 110 Table 4.5. Most prolific journals about process management 112 Table 4.6. Most common topics in the process management field 114 Table 4.7. Number of continuous improvement papers published by region 116 Table 4.8. Topics in the continuous improvement field 118
Table 4.9. Most used methodologies 118
Table 4.10. Sctors studied in the empirical analysis 119 Table 4.11. Most common topics in the continuous improvement field
XXVIII
Table 4.12. Most used methodologies in the continuous improvement field
(Hispanic literature) 121
Table 4.13. Sectors studied in the empirical papers (Hispanic literature) 122
Chapter 5. Process management 125
Table 5.1. “Process” definitions 125
Table 5.2. Types of processes accorging to different criteria 127
Table 5.3. “Process Management” definitions 132
Table 5.4. Reasons motivating companies to implement process management 135
Table 5.5. Process management barriers 136
Table 5.6. Process management enablers 137
Table 5.7. Process management benefits 139
Table 5.8. Process management implementation methodologies 142
Table 5.9. Classification of the methodologies 156
Table 5.10. Process management maturity models 157
Chapter 6. Continuous improvement 163
Table 6.1. “Continuous improvement” definitions 163
Table 6.2. Reasons motivating companies to implement continuous
improvement 165
Table 6.3. Continuous improvement barriers 167
Table 6.4. Continuous improvement enablers 169
Table 6.5. Continuous improvement barriers 171
Table 6.6. Continuous improvement implementation methodologies 173 Table 6.7. Continuous improvement evolutionary models 183
Chapter 7. Associated tools 187
Table 7.1. Different maintenance management systems compared 198
Chapter 8. Research design 203
XXIX
in terms of employees 207
Table 8.3. Companies’ distribution in terms of sector (CNAE2009 classification) 207 Table 8.4. Cantabrian companies with more than 20 employees distribution in
Terms of sector (2011) 208
Table 8.5. Evolution of the number of Cantabrian companies in terms of
Employees (2008-2011) 208
Chapter 9. Methodology 215
Table 9.1. Variance components screen plot for items 221
Table 9.2. Reliability and validity of measures 224
Table 9.3. Summary of rating (or partial credit) scale structures 228
Chapter 10. Descriptive analysis 235
Table 10.1. Research technical record questionnaire 3 235
Table 10.2. Responses obtained in questionnaire 1 236
Table 10.3. Population and questionnaire 1 sample distribution in terms
of size 237
Table 10.4. Representativeness of the sample in terms of size 237 Table 10.5. Population and questionnaire 1 sample distribution in terms of
sector 238
Table 10.6. Representativeness of the sample in terms of sector 239 Table 10.7. Population and companies with process management
distribution in terms of size 240
Table 10.8. Population and companies with process management
distribution in terms of sector (CNAE 2009) 241
Table 10.9. Initial sample and companies with process management
distribution in terms of type of company 242
Table 10.10. Initial sample and companies with process management
distribution in terms of nacionality 242
Table 10.11. Initial sample and companies with process management
distribution in terms of their scope 243
Table 10.12. Respondents profile 244
Table 10.13. Population and companies with continuous improvement
distribution in terms of size 245
Table 10.14. Population and companies with continuous improvement
XXX
Table 10.15. Initial sample and companies with continuous improvement
distribution in terms of type of company 247
Table 10.16. Initial sample and companies with continuous improvement
distribution in terms of nacionality 247
Table 10.17. Initial sample and companies with continuous improvement
distribution in terms of their scope 248
Table 10.18. Respondents profile 248
Table 10.19. Responses distribution 250
Table 10.20. Scenarios established 251
Table 10.21. Sample size needed in each scenario 251
Table 10.22. Research technical record questionnaire 2 252 Table 10.23. Research technical record questionnaire 3 252
Chapter 11. Process management results 253
Table 11.1. Summary of the selection/removal process of reasons to implement
process management techniques 254
Table 11.2. Reasons to implement process management techniques 255 Table 11.3. Variance Components screen plot for items (Reason PM –Case 1) 255 Table 11.4. Reliability and validity of measures (Reasons PM – Case 1) 256 Table 11.5. Variance Components screen plot for items (Reason PM –Case 2) 258 Table 11.6. Reliability and validity of measures (Reasons PM – Case 2) 258 Table 11.7. Summary of rating (or partial credit) scale structures
(Reasons PM – Case 2) 260
Table 11.8. Classification of rasons to implement process management
techniques 262
Table 11.9. Hyphothesis related to reasons to implement process management 263 Table 11.10. Summary of the selection/removal process of barriers to implement
process management techniques 264
Table 11.11. Barriers to implement process management techniques 265 Table 11.12. Variance Components screen plot for items (Barriers PM –Case 1) 265 Table 11.13. Reliability and validity of measures (Barriers PM – Case 1) 266 Table 11.14. Persons ordered according to their misfit (Barriers PM- Case 1) 266 Table 11.15. Variance Components screen plot for items (Barriers PM –Case 2) 267
XXXI Table 11.17. Summary of rating (or partial credit) scale structures
(Barriers PM – Case 2) 270
Table 11.18. Classification of process management barriers 271 Table 11.19. Hyphothesis related to barriers to implement process management 273 Table 11.20. Summary of the selection/removal process of enablers to
Implement process management techniques 274
Table 11.21. Enablers to implement process management techniques 276 Table 11.22. Variance Components screen plot for items (Enablers PM –Case 1) 277 Table 11.23. Variance Components screen plot for items (Enablers PM –Case 2) 278 Table 11.24. Final selection of Enablers to implement process management
techniques 278
Table 11.25. Reliability and validity of measures (Enablers PM – Case 2) 279 Table 11.26. Variance Components screen plot for items
(Enablers PM –Case 3) 281
Table 11.27. Reliability and validity of measures (Enablers PM – Case 3) 281 Table 11.28. Persons ordered accosting to their misfit (Enablers PM –Case 3) 282 Table 11.29. Summary of rating (or partial credit) scale structures
(Enablers PM – Case 3) 283
Table 11.30. Classification of process management enablers 284 Table 11.31. Hyphothesis related to process management enablers 286 Table 11.32. Question 2, questionnaire 2 (Appendix 2) 288 Table 11.33. Companies that have taken part in each stage 292 Table 11.34. Question 8, questionnaire 2 (Appendix 2) 294 Table 11.35. Number of companies that have chosen each option 295 Table 11.36. Summary of the selection/removal process of benefits derived from
process management techniques 297
Table 11.37. Benefits derived from process management techniques 298 Table 11.38. Classification of benefits derived from process management
techniques 300
Table 11.39. Hypothesis related to benefits derived from implementing
XXXII
Table 11.40. Number of companies that practice each management
philosophy 302
Chapter 12. Continuous improvement results 303
Table 12.1. Summary of the selection/removal process of reasons to implement
continuous improvement techniques 304
Table 12.2. Reasons to implement continuous improvement techniques 304 Table 12.3. Variance Components screen plot for items (Reason CI –Case 1) 305 Table 12.4. Reliability and validity of measures (Reasons CI – Case 1) 306 Table 12.5. Variance Components screen plot for items (Reason CI –Case 2) 307 Table 12.6. Reliability and validity of measures (Reasons CI – Case 2) 308 Table 12.7. Summary of rating (or partial credit) scale structures
(Reasons CI – Case 2) 309
Table 12.8. Classification of reasons to implement continuous improvement
techniques 311
Table 12.9. Hyphothesis related to reasons to implement continuous
improvement 313
Table 12.10. Summary of the selection/removal process of barriers to implement
continuous improvement techniques 314
Table 12.11. Barriers to implement continuous improvement techniques 315 Table 12.12. Variance Components screen plot for items
(Barriers CI –Case 1) 316
Table 12.13. Reliability and validity of measures (Barriers CI – Case 1) 316 Table 12.14. Variance Components screen plot for items
(Barriers CI –Case 2) 318
Table 12.15. Variance Components screen plot for items
(Barriers CI –Case 3) 319
Table 12.16. Reliability and validity of measures (Barriers CI – Case 3) 319 Table 12.17. Summary of rating (or partial credit) scale structures
(Barriers CI – Case 3) 320
Table 12.18. Classification of continuous improvement barriers 322 Table 12.19. Hyphothesis related to barriers to implement continuous
XXXIII
Implement continuous improvement techniques 325
Table 12.21. Enablers to implement continuous improvement techniques 326 Table 12.22. Variance Components screen plot for items
(Enablers CI –Case 1) 327
Table 12.23. Variance Components screen plot for items
(Enablers CI –Case 2) 328
Table 12.24. Final selection of Enablers to implement continuous
improvement techniques 328
Table 12.25. Reliability and validity of measures (Enablers CI – Case 2) 329 Table 12.26. Variance Components screen plot for items
(Enablers CI –Case 3) 330
Table 12.27. Reliability and validity of measures (Enablers CI – Case 3) 331 Table 12.28. . Summary of rating (or partial credit) scale structures
(Enablers CI – Case 3) 332
Table 12.29. Classification of continuous improvement enablers 333 Table 12.30. Hyphothesis related to continuous improvement enablers 335 Table 12.31. Implementation mechanisms used by companies to implement
Continuous improvement techniques 336
Table 12.32. Companies that have taken part in each stage 339
Tabla 12.33. Bessant Model stages 342
Table 12.34. Tools list 343
Table 12.35. Companies distribution in terms of their experience 345 Table 12.36. Chi Square analysis. Tools usage vs. Bessant stages 348 Table 12.37. Chi Square analysis. Tools usage vs. experience 350 Table 12.38. Chi Square analysis. Tools usage vs. company size 352 Table 12.39. Chi Square analysis. Tools usage vs. company type 354 Table 12.40. Identified benefits and proposed indicators 356
Table 12.41. Proposed indicators 357
XXXIV
Table 12.43. Number of companies that practice each management
philosophy 367
Chapter 13. Conclusions, limitations and future research lines 385 Table 13.1. Classification of reasons to implement process management
techniques 387
Table 13.2. Classification of process management barriers 388 Table 13.3. Classification of process management enablers 389 Table 13.4. Classification of reasons to implement continuous improvement
techniques 392
Table 13.5. Classification of continuous improvement barriers 393 Table 13.6. Classification of continuous improvement enablers 394
XXXV Capítulo 3. Los grandes cambios de la Dirección de Operaciones 79
Gráfico 3.1. Total empresas certificadas en el mundo 96
Gráfico 3.2. Número de países con empresas certificadas 96
Capítulo 4. Estado del Arte 107
Gráfico 4.1. Evolución del Nº Artículos sobre gestión por procesos en Dialnet 111 Gráfico 4.2. Evolución de la publicación de artículos relacionados con la
mejora continua 116
Gráfico 4.3. Evolución en el número de artículos sobre mejora continua en
la literatura hispana 120
Capítulo 9. Metodología 215
Gráfico 9.1. Evolución Anual de las publicaciones 219
Gráfico 9.2. Evolución anual de las publicaciones (Artículos co-citados) 219
Capítulo 10. Análisis Descriptivo 235
Gráfico 10.1. Porcentaje de empresas con GPP que poseen certificados 244 Gráfico 10.2. Porcentaje de empresas con MC que poseen certificados 249
Capítulo 11. Resultados Asociados a la Gestión por Procesos 253 Gráfico 11.1. Mecanismos de implantación más utilizados por las empresas 289 Gráfico 11.2. Mecanismos de implantación más utilizados por las empresas con
menos de 5 años de experiencia 290
Gráfico 11.3. Mecanismos de implantación más utilizados por las empresas con
5 a 15 de experiencia 290
Gráfico 11.4. Mecanismos de implantación más utilizados por las empresas con
más de 15 de experiencia 291
Gráfico 11.5. Porcentaje de empresas que han participado en cada etapa 292
XXXVI
Capítulo 12. Resultados Asociados a la Mejora Continua 303 Gráfico 12.1. Mecanismos de implantación más utilizados por las empresas con
menos de 5 años de experiencia 337
Gráfico 12.2. Mecanismos de implantación más utilizados por las empresas con
5 a 15 de experiencia 338
Gráfico 12.3. Mecanismos de implantación más utilizados por las empresas con
más de 15 de experiencia 338
Gráfico 12.4. Porcentaje de empresas que han participado en cada etapa 340 Gráfico 12.5. Porcentaje de empresas en cada etapa de Bessant 342 Gráfico 12.6. Herramientas ordenadas según su porcentaje de uso 347
Gráfico 12.7. Porcentaje de uso de cada indicador 359
Gráfico 12.8. Beneficios de la mejora continua ordenados según su
importancia 360
Gráfico 12.9. Destinatarios de la formación 362
Gráfico 12.10. Horario de la formación 363
XXXVII Chapter 3. Major changes occurred in the Operations Management arena 79
Graph 3.1. Certified companies in the world 96
Graph 3.2. Countries with certified companies 96
Chapter 4. State of the art 107
Graph 4.1. Evolution of the number of papers about process management
published in Dialnet 111
Graph 4.2. Evolution of the number of papers about continuous improvement
published 116
Graph 4.3. Evolution of the number of papers about continuous improvement
in the Hispanis literature 120
Chapter 9. Methodology 215
Graph 9.1. Rasch publications annual evolution (Citing articles) 219 Graph 9.2. Publications annual evolution (Co-cited articles) 219
Capítulo 10. Análisis Descriptivo 235
Graph 10.1. Percentage of companies that practice process management
and have certificates 244
Graph 10.2. Percentage of companies that practice continuous improvement
and have certificates 249
Chapter 11. Process management results 253
Graph 11.1. Implementation mechanisms used by companies 289 Graph 11.2. Implementation mechanisms used by companies with less than
5 years of experience 290
Graph 11.3. Implementation mechanisms used by companies with 5-15
years of experience 290
Graph 11.4. Implementation mechanisms used by companies with more than
15 years of experience 291
Graph 11.5. Percentage of companies that have taken part in each stage 292
XXXVIII
Chapter 12. Continuous improvement results 303
Graph 12.1. Implementation mechanisms used by companies with less than
5 years of experience 337
Graph 12.2. Implementation mechanisms used by companies with 5-15
years of experience 338
Graph 12.3. Implementation mechanisms used by companies with more than
15 years of experience 338
Graph 12.4. Percentage of companies that have taken part in each stage 340 Graph 12.5. Percentage of companies in each Bessant stage 342 Graph 12.6. Tools ordered according to their percentage of use 347
Graph 12.7. Percentage of use of each indicator 359
Graph 12.8. Classification of continuous improvement benefits 360
Graph 12.9. Training recipients 362
Graph 12.10. Training schedule 363
XXXIX
ÍNDICE DE ILUSTRACIONES
Capítulo 3. Los grandes cambios de la Dirección de Operaciones 79 Ilustración 3.1. Principios básicos del Lean Management 88
Ilustración 3.2. Modelo EFQM de excelencia 100
Ilustración 3.3. Criterios de excelencia del Modelo Malcom Baldrige 103
Capítulo 4. Estado del Arte 107
Ilustración 4.1. Evolución de los trabajos teóricos y empíricos sobre GPP 109
Capítulo 5. La Gestión por Procesos 125
Ilustración 5.1. Elementos de un proceso 131
Capítulo 6. La Mejora Continua 163
Ilustración 6.1. El ciclo PDCA de Ishikawa 175
Capítulo 9. Metodología 215
Ilustración 9.1. Continuo lineal 217
Ilustración 9.2. Gráfico de cargas de los residuales 223 Ilustración 9.3. Componentes principales. Contraste de residuales. 223 Ilustración 9.4. Sujetos ordenados según desajuste que presentan 227
Ilustración 9.5. Tabla de desajustes del sujeto 227
Ilustración 9.6. Mapa de variables 231
Ilustración 9.7. Medida de los ítems 231
Ilustración 9.8. Análisis DIF dos a dos 233
Ilustración 9.9. Análisis DIF grupal 233
Capítulo 11. Resultados Asociados a la Gestión por Procesos 253 Ilustración 11.1. Sujetos ordenados según desajuste que presentan
XL
Ilustración 11.2. Ítems ordenados según desajuste que presentan
(Razones GPP – Caso 2) 259
Ilustración 11.3. Mapa de variables (Razones GPP – Caso 2) 261 Ilustración 11.4. Gráfico de cargas de los residuales (Obstáculos GPP – Caso 2) 268 Ilustración 11.5. Ítems ordenados según desajuste que presentan
(Obstáculos GPP – Caso 2) 269
Ilustración 11.6. Mapa de variables (Obstáculos GPP – Caso 2) 271 Ilustración 11.7. Componentes principales. Contraste de residuales
(Facilitadores GPP – Caso 1) 277
Ilustración 11.8. Sujetos ordenados según desajuste que presentan
(Facilitadores GPP – Caso 2) 280
Ilustración 11.9. Mapa de variables (Facilitadores GPP – Caso 3) 284
Capítulo 12. Resultados Asociados a la Mejora Continua 303 Ilustración 12.1. Sujetos ordenados según desajuste que presentan
(Razones MC – Caso 1) 306
Ilustración 12.2. Ítems ordenados según desajuste que presentan
(Razones MC – Caso 2) 309
Ilustración 12.3. Mapa de variables (Razones MC – Caso 2) 311 Ilustración 12.4. . Sujetos ordenados según desajuste que presentan
(Obstáculos MC – Caso 1) 317
Ilustración 12.5. Componentes principales. Contraste de residuales
(Obstáculos MC – Caso 2) 318
Ilustración 12.6. Mapa de variables (Obstáculos MC – Caso 3) 321 Ilustración 12.7. Sujetos ordenados según desajuste que presentan
(Facilitadores MC – Caso 2) 329
XLI Chapter 3. Major changes occurred in the Operations Management arena 79
Illustration 3.1. Lean Management principles 88
Illustration 3.2. EFQM Excellence Model 100
Illustration 3.3. Malcom Baldrige Excellence Model Criteria 103
Chapter 4. State of the art 107
Illustration 4.4. Evolution of the number of theoretical and empirical papers
about process management 109
Chapter 5. Process management 125
Illustration 5.1. Process elements 131
Chapter 6. Continuous improvement 163
Illustration 6.1. Ishikawa PDCA model 175
Chapter 9. Methodology 215
Illustration 9.1. Lineal continuum 217
Illustration 9.2. Principal components/contrast plot of tiems loadings 223 Illustration 9.3. Items principal components/Contrast analysis of residuals 223 Illustration 9.4. Persons ordered according to their misfit 227
Illustration 9.5. Item misfitting responses 227
Illustration 9.6. Variable map 231
Illustration 9.7. Item measures 231
Illustration 9.8. Differential item functioning pairwise 233 Illustration 9.9. Differential item functioning DIF bias/interaction analysis 233
Chapter 11. Process management results 253
Illustration 11.1. Persons ordered according to their misfit
XLII
Illustration 11.2. Items ordered according to their misfit
(Reasons PM – Case 2) 259
Illustration 11.3. Variable Map (Reasons PM – Case 2) 261 Illustration 11.4. Principal Components/contrast plot of item loadings
(Barriers PM – Case 2) 268
Illustration 11.5. Items ordered according to their misfit
(Barriers PM – Case 2) 269
Illustration 11.6. Variable Map (Barriers PM – Case 2) 271 Illustration 11.7. Item principal components/contrast analysis of residuals
(Enablers PM – Case 1) 277
Illustration 11.8. Persons ordered according to their misfit
(Enablers PM – Case 2) 280
Illustration 11.9. Variable Map (Enablers PM – Case 3) 284
Chapter 12. Continuous improvement results 303
Illustration 12.1. Persons ordered according to their misfit
(Reasons CI – Case 1) 306
Illustration 12.2. Items ordered according to their misfit
(Reasons CI – Case 2) 309
Illustration 12.3. Variable Map (Reasons CI – Case 2) 311 Illustration 12.4. Persons ordered according to their misfit
(Barriers CI – Case 1) 317
Illustration 12.5. Item principal components/contrast analysis of residuals
(Barriers CI – Case 2) 318
Illustration 12.6. Variable Map (Barriers CI – Case 3) 321 Illustration 12.7. Persons ordered according to their misfit
(Enablers CI – Case 2) 329
PhD DISSERTATION SUMMARY
“IMPLEMENTATION OF CONTROL AND
CONTINUOUS IMPROVEMENT
2
SUMMARY INDEX
Chapter 1: Introduction 4
Chapter 2: Evolution of the Operations Management field: topics of interest 5 Chapter 3. Major changes occurred in the Operations Management arena 7 3.1. Changes in the business environment conditions 7
3.2. New management systems 8
3.2.1. Theory of Constraints 8
3.2.2. Lean Management 9
3.3. Quality Management 9
3.4. Process management and continuous improvement 10
Chapter 4. State of the art 11
4.1. Process management literature review 11
4.2. Continuous improvement literature review 12
Chapter 5. Process management 13
Chapter 6. Continuous improvement 22
Chapter 7. Associated tools 31
Chapter 8: Research design 32
8.1. Research objectives and hypotheses 32
8.2. Target population definition 34
8.3. Survey design 35
8.4. Questionnaire dispatch 35
8.5. Data treatment 36
Chapter 9. Methodology 36
9.1. Rasch Measurement Theory 36
9.2. Applications of the methodology 37
Chapter 10: Descriptive analysis 38
3
11.1. Process management reasons 41
11.2. Process management barriers 42
11.3. Process management enablers 43
11.4. Process management implementation stages 44
11.5. Level of development achieved during the implementation 46
11.6. Process management benefits 46
Chapter 12: Continuous Improvement results 47
12.1. Continuous improvement reasons 48
12.2. Continuous improvement barriers 48
12.3. Continuous improvement enablers 50
12.4. Continuous improvement implementation stages 51 12.5. Level of development achieved during the implementation 52
12.6. Tools used during the implementation 53
12.7. Continuous improvement indicators and benefits 55
12.8. Training sessions 55
12.9. Improvement teams 56
4
CHAPTER 1: INTRODUCTION
The constant, and sometimes radical, changes that are taking place in the business environment demand that companies develop more agile mechanisms and management systems that enable them to adapt and, above all, to be competitive.
In recent decades, globalization has led to changes in market conditions. Thus, now companies have to deal with more dynamic environments characterized by a fierce competition, better informed and more demanding customers, greater importance of the product/service quality, or greater awareness on environmental and social issues they face, inter alia.
All this means that companies must be able to continuously and quickly adapt to change. In order to do this they need to develop agile and flexible structures. The traditional functional structures that, even today, still exist in many companies do not meet these requirements. In this type of organization hierarchy and departmental distribution acquire vital importance, which is precisely the opposite of what businesses need today.
Process management and continuous improvement are two of the mechanisms that arise to meet these new needs, giving the company the flexibility to develop their business in today's competitive environment.
The importance of process management and continuous improvement in the business world has been reflected in the academic world, where many studies have examined these mechanisms from multiple perspectives (definition of the concept, enablers, barriers, benefits ...). However, the international and national literature review conducted showed that research related to these concepts in Spanish-speaking countries, specifically in Spain, is still scarce.
Therefore, the objectives of this Thesis are multiple. First, determining the level of implementation of process management and continuous improvement achieved in Cantabria, a region in the north of Spain. Secondly, analysing the main characteristics of the process followed by companies when implementing process management and continuous improvement. To achieve these objectives a survey was conducted among companies from Cantabria. The survey was integrated, in turn, by three questionnaires. The first questionnaire was about general characteristics of the company, the second about process management and the third one about continuous improvement.
Overall, the structure of this Doctoral Thesis is as follows. After this brief introduction which integrates chapter one, in the second chapter the evolution of the Operations Management discipline identifying, concurrently, the changes that have been happening in the business world on the one hand, and the main research topics on the other, is presented. The
5 third chapter delves into three of the biggest events of the last decades (changes in the business environment, new management systems and changes in quality management) to conclude that process management and continuous improvement are emerging as a potential mechanism to respond to all of them. In the fourth chapter, a literature review of both concepts is performed to determine if it is appropriate to do research about them and, if so, to identify the most appropriate topics. Once the suitability of the study was confirmed, in the fifth, sixth and seventh chapters the theoretical concepts of process management, continuous improvement and associated tools are explored respectively. The eighth chapter describes the research objectives and the design of the empirical study, introducing the ninth chapter in which the methodology used for data processing, the Rasch Measurement Theory, is described. The tenth, eleventh and twelveth chapters present the results of the study into two three sections: descriptive analysis, process management results and continuous improvement results. Finally, the thirteenth chapter includes the main conclusions of the study, its limitations and some future research lines.
CHAPTER 2. EVOLUTION OF THE OPERATIONS
MANAGEMENT FIELD
Operations Management is a discipline with a long and rich history whose origins, according to some authors, date back to the eighteenth century when the Industrial Revolution took place. From that moment the development of the discipline was spectacular and contributions followed one after another, both in the business and in the academic world.
Among all the developments, those caused by the changes occurred in the production systems were probably the most important ones. Thus, the transition from craft production to mass production generated major changes not only in the society of the time, but also on the central topics of research. Following the emergence of mass production, that was a more complex system than the previous craft production, scholars of the time tried to respond to the needs that were raised as, for instance, resource optimization and efficiency. Everything responded to the reality of the time in which the demand far exceeded the supply.
This situation lasted until well into the century, specifically, until the eighties. At that time new management systems that purported to be an alternative to mass production appeared. This change was not voluntary but necessary. The business environment conditions were quickly changing (global competition, better informed and more demanding customer, shortening ot the product life cycle, quality relevance...). Flexibility and customer adaptation
6
had become key variables of management and consequently mass production did not seem to be as efficient as it was earlier in the century.
As a result, two new management systems emerged: the Toyota Production System (TPS) from Japan and the Total Quality Management (TQM) movement introduced in the U.S. by Deming (1982) and Juran (1990). These topics were so important that many academic works of the time focused on the Just in Time (JIT) philosophy, one of the basic pillars of the TPS (Bayraktar et al. 2007, p.847). Additionally, at that time, there was also a significant increase in the number of publications related to Process Design, the impact of new information technologies and the new Operations Management philosophies (Álvarez Gil 1996).
Throughout the nineties, topics like management and quality control, selection of processes and systems of planning, and control of production remain important (Malhotra, Steele & Grover 1994, p.210).
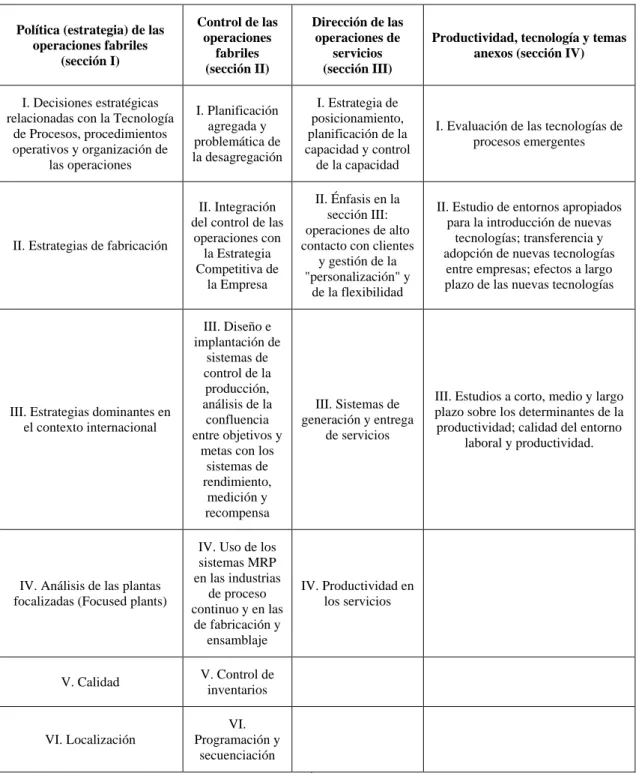
Finally, in the first decade of the XXI century, the main research topics treated, according to Pilkington and Meredith (2009) and Taylor and Taylor (2009) studies, were the following (Table 2.4):
Table 2.4. Main topics in the first decade of the XXI century1 PERIOD: 2000-2006
(Pilkington, Meredith 2009)
PERIOD: 2003-2009
(Taylor, Taylor 2009) Manufacturing Strategy Supply Chain Management
Quality and its metrics Operations Strategy Statistical methods Performance Management
Process design Service Operations Services Lean Methods Flexibility Resouce planning systems Qualittative methods Quality Management
Supply chains Product Design/Development Product/Service innovation
Measures/Balanced Scorecad Inventory Control
Source: Authors
Overall, from the eighties, those topics related to new management systems and quality management techniques seem to have a greater interest among academics. Taking this into consideration in Chapter 2 three of the main phenomena occurred during the last decades are deeply analysed: changes in the business environment conditions, the emergence of new management systems and the increasing importance of quality management.
1
7
CHAPTER 3. MAJOR CHANGES OCCURRED IN THE
OPERATIONS MANAGEMENT ARENA
Throughout this chapter the origins and consequences of three phenomena occurred since the eighties will be analysed: changes in the business environment conditions, the emergence of new management systems and the increasing importance of quality management.
3.1. CHANGES IN THE BUSINESS ENVIRONMENT CONDITIONS
As it was already noticed in the historical review of the Operations Management field in the previous chapter, the business environment conditions have changed significantly since the beginning of the century, being especially remarkable the changes occurred since the late seventies and throughout the eighties. In the following lines, the main changes in the global landscape will be discussed.
Global markets: over the last decades, open borders and free trade have favored the phenomenon of globalisation. Companies no longer compete in a local market but they should be alert to any world event. The benefits for companies are undoubted (greater number of potential customers, more and better supply chances...), but also new challenges appear, for instance, the increased competition. In addition, the basis of competition has gone from being cost and quality to also include time as a key variable (Bayraktar et al. 2007, p.851).
Technological advances: Without a doubt, the greatest advance occurred in recent decades has been the emergence of the Internet. The network has dramatically increased the amount of information available to both businesses and consumers. Similarly, the improvement of telecommunications has favored and accelerated the number and the speed of transactions. From a business standpoint, new management tools have appeared such as Customer Relationship Management (CRM), Supplier Chain Management (SCM) or Knowledge Management (KM) (Bayraktar et al. 2007), among others.
More demanding and better informed customers: The above mentioned technological advances, especially those applied to communications, have contributed to a better informed customer. With more and better information, the customer is able to know and compare the existing supply of goods and services, not just in their local market, but globally. As a result, customers are now more demanding and have greater bargaining power. This, along