Consequences of estuarine sand dredging and dumping on the
Urdaibai Reserve of the Biosphere (Bay of Biscay): the case of
the “Mundaka left wave”
Consecuencias del dragado y vertido de arena estuarina en la Reserva de la
Biosfera de Urdaibai (Golfo de Bizkaia): el caso de la “ola izquierda de Mundaka”
M. Monge-Ganuzas
1, A. Cearreta
1, E. Iriarte
21Departamento de Estratigrafía y Paleontología, Facultad de Ciencia y Tecnología, Universidad del País Vasco/EHU,
Apartado 644, 48080 Bilbao, Spain
e-mail: mrmonge001@ikasle.ehu.es; alejandro.cearreta@ehu.es
2Departamento de Ciencia e Ingeniería del Terreno y los Materiales, E.T.S. Ingenieros de Caminos, Canales y Puertos,
Universidad de Cantabria, Avenida de los Castros s/n, 39005 Santander. Spain. e-mail: eneko.iriarte@unican.es
Received: 30/03/07 / Accepted: 10/07/07 Abstract
In the spring of 2003, 240,000 m3 of sand were dredged from the main channel of the lower Oka estuary (Urdaibai Reserve of the Biosphere) and dumped on the southern area of Laida beach located at the estuary mouth. After few months, strong erosion of the deposited sediments occured as a consequence of the northwards migration of the final meander of the main estuarine channel before it reached the estuary inlet. At the same time, the estuarine inlet abandoned its original position near the rocky western margin and migrated eastwards cutting and eroding the sandy ebb delta (Mundaka sand bar). This caused a change in the way the incident wave broke as it reached the shallow water of the ebb tidal delta and beach and made surfing impossible under the same optimal conditions previously enjoyed due to the production of a wave that gradually broke from right to left as it reached shallow water, the so called “Mundaka left wave”. As a consequence, the Billabong Pro surf championship was cancelled in 2005.
This paper describes the results obtained during a study of the outer estuary carried out during the period May 2005-April 2006 to characterize the processes operating on the most dynamic area of the estuary throughout the year and to evaluate the influence that the anthropogenic activities in the estuary had on the wave characteristics.
No corrective measures were taken in the outer estuary during the study period and the environment recovered its normal morpho-logical features naturally. This natural restoration it is hoped will be more stable, long lasting and reliable to ensure the continuing future of the “Mundaka left wave”.
Keywords: morpho-dynamical study, ridge and runnel, tidal currents, sand transport, wave action, surf activities, lower Oka estuary
Resumen
En primavera del año 2003, la necesidad de mayor calado condujo a la realización de un dragado con la extracción de aproxima-damente 240.000 m3 de arena del canal principal del estuario inferior del Oka (Reserva de la Biosfera de Urdaibai) y su vertido en la zona supramareal sur de la playa de Laida situada en la desembocadura del mismo. Desde la finalización de este vertido, se observó en la zona una fuerte erosión debido a la migración lateral del último meandro del canal estuarino antes de su desembocadura. Pa-ralelamente, se produjo una variación morfológica del canal de desembocadura, con el paulatino abandono de su posición original
216 Monge-Ganuzas et al. / Journal of Iberian Geology 34 (2) 2008: 215-234
Hence the name of “Mundaka left wave” as when viewed from the sea it breaks progressively from right to left. The most favourable conditions to form breakers suitable for surfing occur around low tide due to the smaller depth of water over the sand bar. Essentially, the formation of the famous “left wave” requires moderate to intense wave conditions (typical of the autumn-winter), low tide (if possible during spring tides) and southerly or westerly winds.
The quality of the surfing depends upon changes of the sand bar morphology over the year, with the optimum conditions occuring immediately after the summer, then deteriorating slowly throughout the winter.
The attraction of large numbers of surfers each year is an important source of income for the surrounding com-munities and, consequently, there was much local con-cern because of the loss of wave-quality for surfing. A morphodynamical study of the Oka estuarine mouth was carried out with the purpose of establishing the factors controlling the pattern of wave-breaking in the area and to discuss possible corrective measures to adopt in case environmental conditions changed and did not return quickly to the normal situation (Cearreta et al., 2006).
2. Methods and Results
2.1.Wave climate
Data used to characterize the external wave regime af-fecting the study area were supplied by the ODIN pro-gramme (SMC) and obtained from the Bilbao external buoy records (Spanish Port Network; http://www.puer-tos.es/).
Waves propagating from the northwest, may be grouped into two main types: “swell” waves with large periods, and “sea” waves with short periods. All other directions of propagation supply only waves of the “sea” type.
1. Introduction
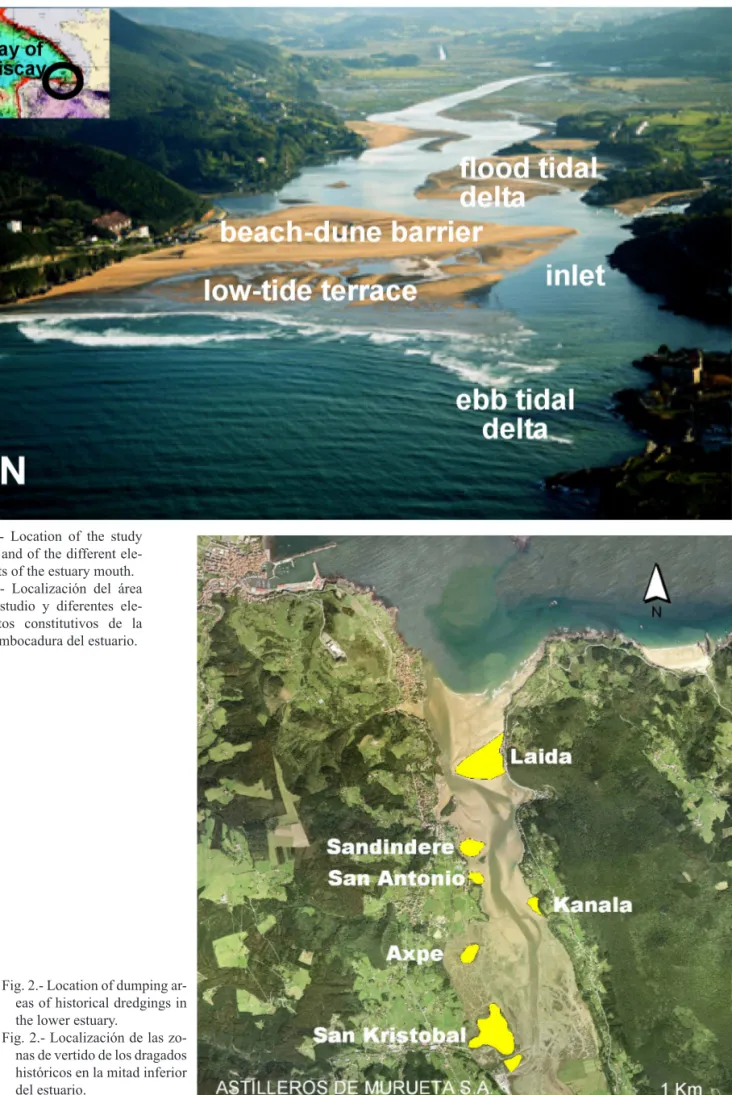
The Oka estuary is located on the southeastern Bay of Biscay and, together with its hydrographic basin, was declared in 1984 as a Reserve of the Biosphere by UNESCO. The estuary mouth is under the combined ac-tion of waves, tidal currents and winds, and it exhibits different sedimentary elements with their morphology and locations controlled by a dynamic equilibrium (Fig. 1).
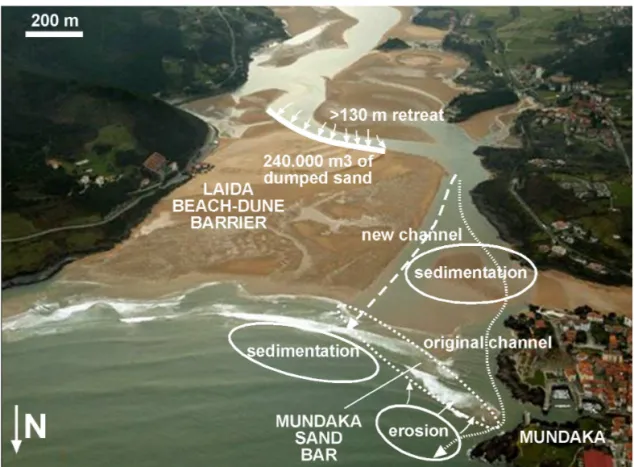
Since 1973, and approximately every succeeding five years, the shipyard company Astilleros de Murueta SA, located on the central estuary, has carried out dredging of the main estuarine channel and this sand has been dumped in different areas of the lower estuary. At present, these sedimentary dumps appear as large supratidal sandy ar-eas (Fig. 2).
In 2003, 240,000 m3 of sands were dredged and dumped
on the southern area of Laida beach adjacent to the estu-ary mouth. After few months there was strong erosion of the deposited sediments (160,000 m3 in December 2004)
as a consequence of the northwards migration of the final meander of the main estuarine channel before it reached the estuarine mouth (Cearreta et al., 2004). Concurrently, on the external area, the estuarine inlet abandoned its original position on the western flank of the estuary and migrated eastwards, cutting and eroding the sandy ebb delta to a new position on its western flank (Mundaka sand bar) (Fig. 3). This provoked a variation in the wave-breaking pattern, which had made the surfing at this loca-tion famous with the surfing community.
Under normal conditions, waves break on a sand bar (ebb tide delta) produced by the tidal currents at the Oka estuary mouth. The wave fronts arrive close to the Mundaka port from a mainly NW direction. In general, the Mundaka sand bar presents an oblique slope to the approaching waves and this induces the eastwards pro-gressive breaking of the wave for approximately 400 m.
junto al margen rocoso oeste de la ría y la aparición de un canal alternativo hacia el este que seccionaba el delta de reflujo (barra arenosa de Mundaka). Esta variación provocó un cambio en las características del oleaje incidente imposibilitando la práctica del surf en las condiciones idóneas que se disfrutaban hasta entonces y obligando a la cancelación en 2005 de una de las pruebas de surf más importantes del mundo, el Billabong Pro.
Este trabajo muestra una síntesis de los resultados obtenidos en el estudio de la zona más externa del estuario del Oka durante el período Mayo 2005-Abril 2006 con el fin de caracterizar los procesos que operan durante todo el año en la zona más dinámica de este estuario y evaluar la influencia que el dragado efectuado tuvo sobre la rotura del oleaje.
Como consecuencia de no haber adoptado ninguna medida correctora en la zona exterior de la desembocadura, el propio sistema sedimentario y sus diferentes elementos constitutivos consiguieron de modo natural unas características morfológicas similares a las habituales en esa zona. Esta restauración natural será previsiblemente mucho más estable, duradera y segura de cara a garantizar el futuro de la “ola izquierda de Mundaka”.
Palabras clave: estudio morfodinámico, corrientes mareales, transporte de arena, actividad del oleaje, surf, estuario inferior del
Fig. 1.- Location of the study area and of the different ele-ments of the estuary mouth. Fig. 1.- Localización del área
de estudio y diferentes ele-mentos constitutivos de la desembocadura del estuario.
Fig. 2.- Location of dumping ar-eas of historical dredgings in the lower estuary.
Fig. 2.- Localización de las zo-nas de vertido de los dragados históricos en la mitad inferior del estuario.
218 Monge-Ganuzas et al. / Journal of Iberian Geology 34 (2) 2008: 215-234
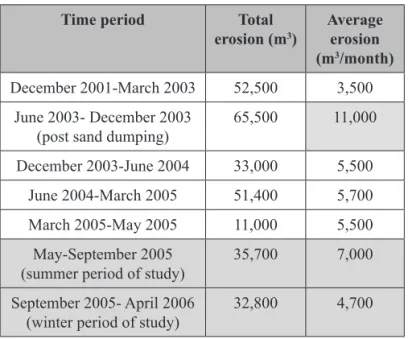
Fig. 3.- Study area and sedimentary processes involved between June 2003 (sand dumping)-May 2005 (beginning of this study). Fig. 3.- Zona de estudio y procesos sedimentarios involucrados entre Junio 2003 (vertido de arena)-Mayo 2005 (inicio de este estudio).
Using the seasonal data from the Bilbao buoy for the period 1990-2003, Cearreta et al., (2006) observed that the wave climate can be divided in two different periods. In the summer, sea waves are dominant with a maximum period of approximately 9 s (periods higher than 10 s do not occur more than 25% of the time); waves are charac-teristically low, with significant heights higher than 2 m occurring only 10% of the time. However, in winter, long period swell is dominant, with maximum periods around 13 s with waves of periods shorter than 10 s occurring less than 20% of the time. These waves are usually high, with heights exceeding 2 m more than 50% of the time. In spring and autumn intermediate values occur.
The local wind intensity and direction, during the peri-od May-October, are essentially from the north and from the south, reaching average daily velocities of 1-2 m/s. Occasionally within this period, isolated peaks with ve-locities up to 6 m/s occur. On the other hand, the period November-April is characterized by predominance of northerly winds with an average daily velocity of around 4 m/s or higher; the maximum monthly values can reach up to 10 m/s (Cearreta et al., 2004).
2.2. Morphological evolution of the outer estuary Eleven monthly bathymetric surveys were carried out on the outer parts of the estuary (May 2005-April 2006)
using the bottom tracking tool of an Acustic Doppler Cur-rent Profiler (ADCP Winriver RDI 1200) with a Trimble GPS located on board a small vessel (4 m long). Data were corrected using the nearby Bilbao tide gauge record and bathymetric maps were produced using the Surfer 8 software. Additionally, topographic measurements of the Laida beach intertidal area were made every two months using a Leyca 5010 total station, located on several fourth-order points around the beach, in order to com-plete the bathymetric picture.
Under summer conditions, on the low intertidal area north of Laida beach, there is a continuous migration to the southwest (N220º) of various sand bars (Fig. 4). These ridges are the result of sand being transported from the northeastern bay area to the beach and estuarine inlet. In this way, a typical summer beach profile, characterized by ridges and runnels in the intertidal area is created. The formation of a steep slope on the front of the berm sepa-rating the intertidal and supratidal sections of the beach was also characteristic during this period.
The new “anomalous” inlet at the eastern side of the estuary which had been generated by the sandy accumu-lation at its mouth (Fig. 3) disappeared between July and August 2005 due to both the landward migration of the intertidal sand ridges and to the sand transport produced by the ebb currents. These processes reinforced the de-velopment of the Mundaka sand bar and returned the inlet
channel to its former position close to the rocky western margin.
From October 2005 to April 2006 (winter conditions), sand ridges which had formed during the summer on the intertidal area of Laida beach were eroded. Sand was transported towards the estuarine inlet from where some was carried into the estuary and the remainder was moved to the proximal area of the Mundaka sand bar leaving merely a wide intertidal area (low-tide terrace) character-ized by a flat rippled surface free of ridges (Fig. 4). Fur-thermore, the beachface of Laida beach was cut back and steepened, and developed a typical winter profile. During this period, the erosion of the berm was particularly ac-tive towards the west.
During summer conditions the Mundaka sand bar re-treated southward with respect to its normal position and its zero bathymetric line was cut by channels (Fig. 5). As time passed, this morphological framework was modi-fied until August 2005, when a return to almost its nor-mal configuration occured. Surf conditions improved in September 2005 with deepening of the estuarine inlet and an important sand accumulation on the northwestern area of the Mundaka sand bar. This produced a more uniform sand bar with a steeper slope with the bathymetric lines converging to generate conditions similar to those of nor-mal although it was slightly displaced landwards (around 30 m) with respect to its former location. From the sum-mer onwards, the eastern part of the sand bar re-aligned in a more north-south direction and, consequently, was orientated more obliquely to the direction of predominant wave approach. Sediment accumulated on the proximal
area of the sand bar, reduced the inlet cross-section and thus increased the mean velocity of the ebb currents. Consequently, a small lateral migration of the inlet and a progressive deepening between the proximal and distal areas of the sand bar were produced from October 2005 to March 2006. Since April 2006 the inlet channel increased its cross-sectional area and migrated to the west filling the erosional depression previously created (Fig. 5). 2.3. Temporal evolution of southern area of Laida beach
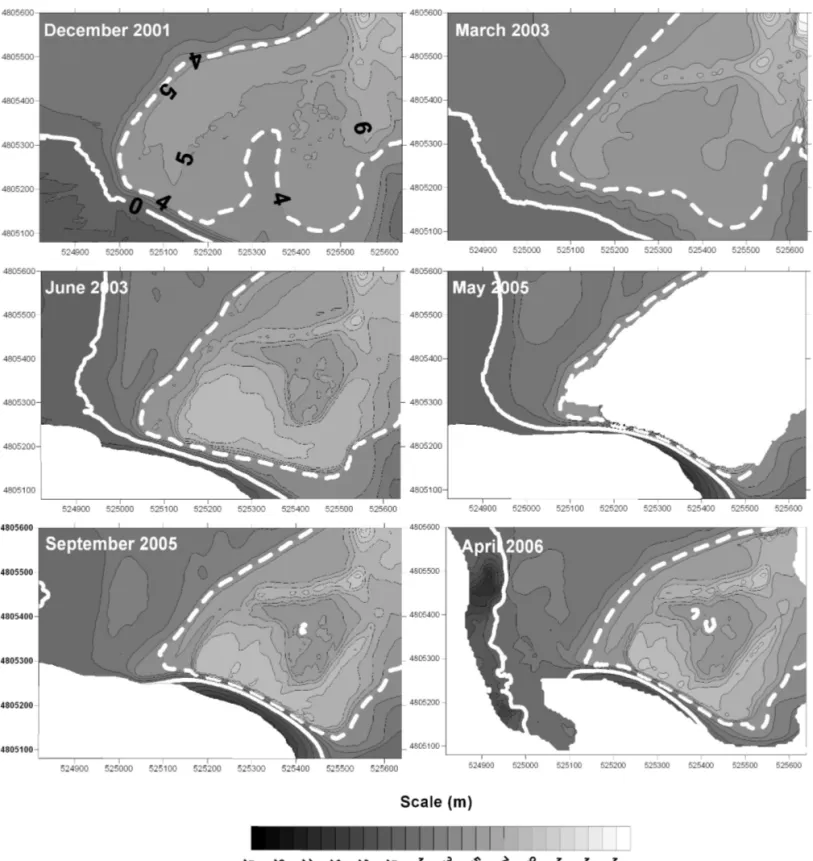
Analysis of the temporal evolution of the southern landward margin of Laida beach has been divided into four different time periods. Firstly, the situation previous to the sand dumping (December 2001-March 2003); sec-ondly, the period after the sand dumping (June 2003-May 2005); thirdly, the summer period of this study (May-Sep-tember 2005); and finally, the winter period of this study (September 2005-April 2006). Comparison of the topo-graphic measurements obtained at the beginning and the end of these periods allows a calculation of the changes of sediment volume with time (Cearreta et al., 2006).
All these periods were characterized by erosion in this area although sediment depletion was quantitatively dif-ferent during each analyzed time interval (Fig. 6). Be-fore the sand dumping, erosion was unimportant and was concentrated on the landward and northwestern areas of Laida beach close to the inlet of the estuary as a conse-quence of the lateral migration of the final meander pro-moted by tidal currents (Table 1). Since the last dumping of sand, the volume of eroded sediment per time unit in-creased enormously (11.000 m3/month) and introduced a
huge amount of sand into the mouth of the estuary; this was deposited in the inlet closing it and modifying its normal disposition (Fig. 3). Since then, the rate of erosion has decreased significatively (Table 1).
During the period of study, this erosion continued dur-ing the summer although it became progressively less during winter, but without reaching the levels of the minimum erosion rates recorded previous to the last sand dumping in 2003 (Table 1, Fig. 6).
2.4. Waves and currents in the outer estuary
A total of eight campaigns of current and wave meas-urements were carried out in the estuary mouth, using three 808 Valeport currentmeters (4 campaigns in sum-mer, May 2005) and 730D Valeport currentmeters (4 campaigns in winter, January 2006). These currentmeters are electromagnetic instruments equipped with sensors to measure current velocity and direction, conductivity,
Table 1.- Sand erosion on the southern part of Laida beach (December 2001-April 2006).
Tabla 1.- Volumen de arena erosionado en el margen sur de la playa de Laida (Diciembre 2001-Abril 2006).
Time period Total
erosion (m3) Average erosion (m3/month)
December 2001-March 2003 52,500 3,500 June 2003- December 2003
(post sand dumping) 65,500 11,000 December 2003-June 2004 33,000 5,500
June 2004-March 2005 51,400 5,700 March 2005-May 2005 11,000 5,500
May-September 2005
(summer period of study) 35,700 7,000 September 2005- April 2006
220 Monge-Ganuzas et al. / Journal of Iberian Geology 34 (2) 2008: 215-234
Fig.4.- Monthly bathymetries of the Oka estuary mouth. May, July, September, October and December 2005, February and April 2006 include also topographic information of the intertidal areas. Solid white line represents LWM (low water mark, 0 m) and dashed black line represents HWM (high water mark, 4 m). Blank areas were unsurveyed.
Fig. 4.- Batimetrías mensuales de la desembocadura del estuario del Oka. Los meses de Mayo, Julio, Septiembre, Octubre y Diciembre de 2005, Febrero y Abril 2006 incluyen además la información topográfica de las zonas intermareales. La línea negra contínua representa el NB (nivel de bajamar, 0 m) y la línea blanca discontínua representa el NP (nivel de pleamar, 4 m). Las zonas blancas no fueron estudiadas.
222 Monge-Ganuzas et al. / Journal of Iberian Geology 34 (2) 2008: 215-234
Fig. 5.- (this page and the next one) Detailed monthly bathymetries of the Mundaka sand bar (years 2005-2006). Blank areas were unsurveyed. Fig. 5.- (esta página y la siguiente) Detalle de las batimetrías mensuales en la barra arenosa de Mundaka (años 2005-2006). Las zonas blancas
224 Monge-Ganuzas et al. / Journal of Iberian Geology 34 (2) 2008: 215-234
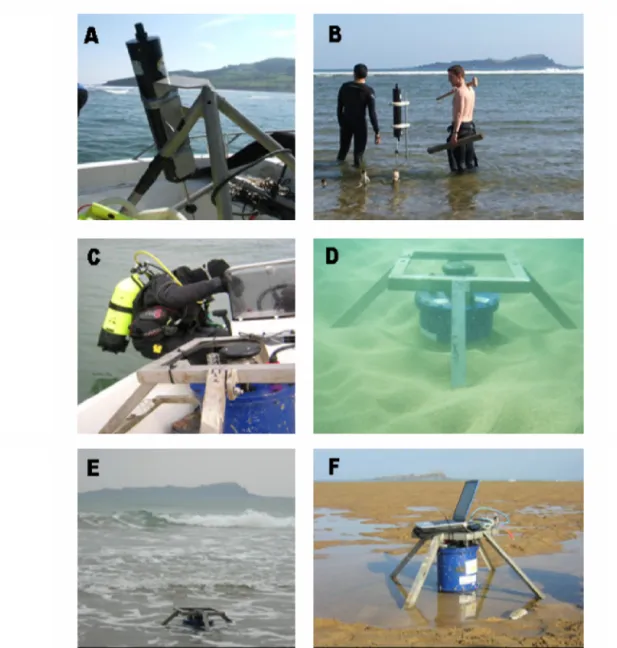
temperature, turbidity and pressure (Fig. 7).
Instruments were located at different positions, in an attempt to cover completely the estuarine mouth area and the possible variations on both tidal range (spring, inter-mediate and neap tides) and longitudinal and transversal morphological elements of the environment.
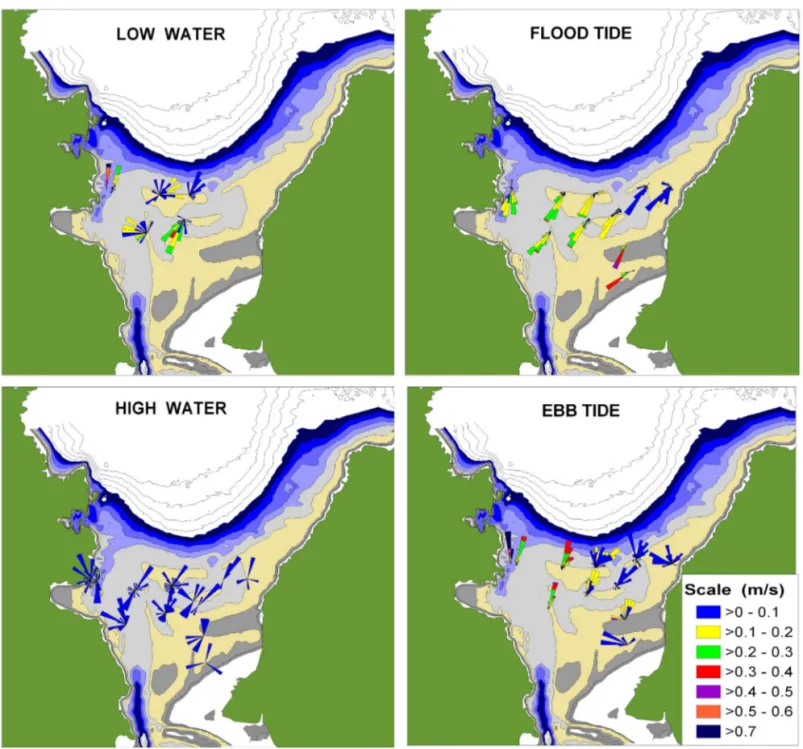
Under summer conditions, maximum currents were observed close to the west margin of the estuary mouth (Mundaka port) during ebb tide and low water. The delay of the tidal wave during the ebb was approximately 1 hour on the Mundaka sand bar area. These currents exceeded 0.8 m/s during spring tides and decreased rapidly
east-Fig. 6.- Temporal evolution of the southern part of Laida beach (December 2001-April 2006). Solid white line represents LWM (low water mark, 0 m) and dashed white line represents HWM (high water mark, 4 m). Blank areas were unsurveyed.
Fig. 6.- Evolución temporal de la zona sur de la playa de Laida (Diciembre 2001-Abril 2006). La línea blanca contínua representa el NB (nivel de bajamar, 0 m) y la línea blanca discontínua representa el NP (nivel de pleamar, 4 m). Las zonas blancas no fueron estudiadas.
ward, being almost zero on the low-tide terrace of Laida beach. In the area where the anomalous inlet was locat-ed during the winter of 2004 the currents were less than 0.4 m/s during the ebb. On the contrary, during the flood tide current directions were very uniform throughout the whole area and were directed towards the inlet, increas-ing their values from 0-0.1 m/s (on the northwestern mar-gin) to 0.3-0.4 m/s (on the intertidal area of Laida beach), and being practically zero around high water (Fig. 8).
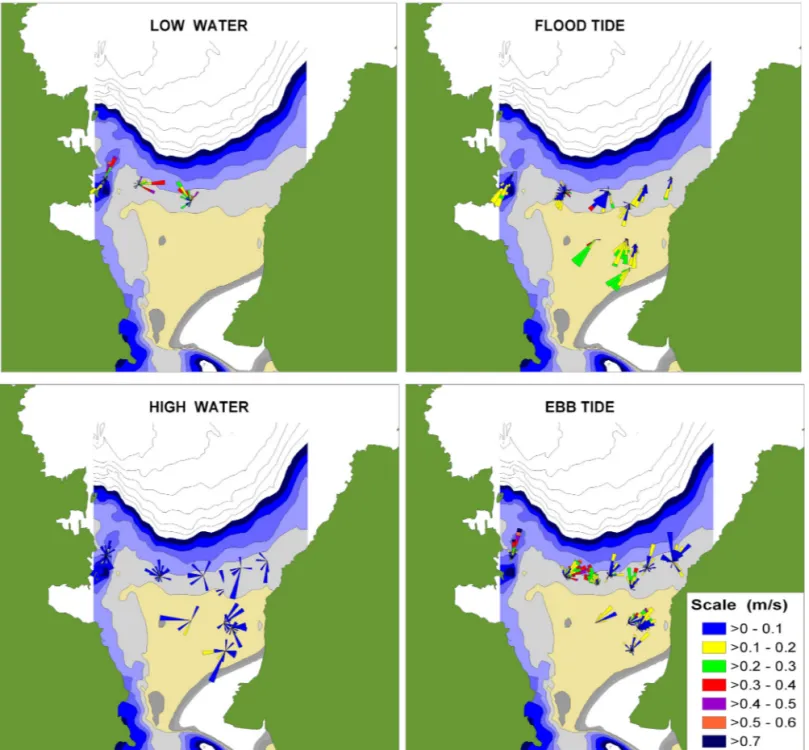
Under winter conditions, the maximum ebb tide and low-water currents flowed out of the inlet, in a seaward direction and were converged along the external parts of the low-tide terrace. These currents attained 0.7 m/s. On the contrary, during the flood tide current directions were very uniform throughout the whole area and were
direct-ed towards the inlet increasing from 0.1-0.2 m/s (on the northwestern margin) to 0.2-0.3 m/s (on the southwestern shallower areas), and were practically zero around high-water (Fig. 9).
2.5. Currents and sedimentary transport in the estuary inlet
Transverse transects under spring and neap tide condi-tions during both summer (May 2005) and winter (No-vember 2005) periods were carried out in the internal parts of the inlet using ADCP and GPS instruments. The ADCP allows the measurement of current direction and velocity in the water mass by the Doppler effect. At the same time, a bottom tracking of the inlet was performed
Fig. 7.- Valeport currentmeters campaigns. A: detail of Valeport 808; B: Valeport 808 on Laida beach; C: Position-ing of Valeport 730D in the inlet; D: Valeport 730D under the water; E: incident waves on Valeport 730D; F: Data discharge from the Valeport 730D.
Fig. 7.- Campañas de correntímetros Valeport. A: Detalle del Valeport 808; B: Valeport 808 en la playa de Laida; C: Colocación del Valeport 730D en el canal de desembocadura; D: Valeport 730D bajo el agua; E: Oleaje incidente sobre el Valeport 730D; F: Descarga de datos del Valeport 730D.
226 Monge-Ganuzas et al. / Journal of Iberian Geology 34 (2) 2008: 215-234
and the amount of sediment transported in suspension and near the bed within the water mass was qualitatively estimated by back-scattering techniques. Sediment sam-ples were collected using a Niskin bottle (capacity: 1.8 l). It was observed that the sediment in the water column was mainly sand. Furthermore, the analyzed backscatter profiles clearly showed that this sediment, both the in-coming and outgoing, came from the eastern margin of the channel close to Laida beach. Bearing in mind that a great amount of sediment is transported through the inlet channel as bed-load and also that the ADCP backscatter is unable to identify the sediment transported within the bottom 10 cm of the water column, due to ringing
proc-esses. In order to produce the backscatter calculations, the ADCP divides the vertical water column into 15-cm cells, and then calculates a current velocity and direction for each cell, assigning a value in decibels (dB) based on the amount of solids present. The addition of the back-scatter values, with respect to the incoming and outgo-ing flows, allows a comparison to be made, in percentage terms, of the amount of sediment that enters or leaves the estuary during a certain period of time and to assess the sedimentary balance in the inlet throughout an annual cy-cle. Consequently, succesive transects during a complete tidal cycle (12 h and 30 min) permitted the determination of the variation and evolution of the above mentioned
pa-Fig. 8.- Distribution and velocity of currents during the summer campaign at different stages of the tidal cycle.
Fig. 9.- Distribution and velocity of currents during the winter campaign at different stages of the tidal cycle. Arrows indicate merely seaward/lanward flux and they are not exact directions.
Fig. 9.- Distribución y velocidad de la corriente durante las campañas de medición invernales en diferentes fases del ciclo mareal. Las flechas indican solamente el flujo hacia dentro/fuera del estuario y no representan direcciones concretas.
rameters during this time interval.
During the summer and under low water, spring tide conditions, current velocities were low; they oscillated around 0-0.7 m/s, and showed a dominant seawards di-rection. During flood tide lower velocities (0-0.5 m/s) occured along the inlet margins than in the central part (1-1.8 m/s) which were the highest values obtained dur-ing the whole tidal cycle. The flow of water was clearly landwards although eddies flowing in the opposite direc-tion were observed on the eastern margin of the inlet. During high-water, the velocities were very low, between 0-0.4 m/s, and in contrast were dominantly landwards.
Finally, during the ebb tide, velocities of 0.5-1 m/s with a clear northwesterly direction occured. During neap tides, currents were similar except that the magnitudes of the measured parameters were lower.
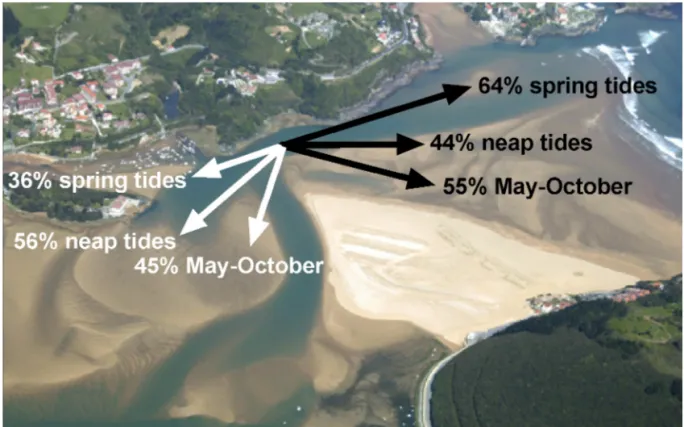
During the summer period, when there was little sig-nificant wave activity, sediment transport to seawards was slightly dominant (55%) over the amount that moved landward into the estuary (45%) (Fig. 10). Probably, this export of sediment was due to the erosion of the land-ward part of the Laida beach-dune ridge; which provided an easily available source of sand for transport through the inlet to outside the estuary during ebb tides. When
228 Monge-Ganuzas et al. / Journal of Iberian Geology 34 (2) 2008: 215-234
different tidal conditions are analyzed, it is clear that dur-ing neap tides the transportation of sediment landwards into the estuary was dominant compared to the seaward outflow, whereas during spring tides sediment transport seaward out of the estuary, was dominant.
On the contrary, during the winter period, characterized by strong wave activity, sediment transport landwards into the estuary was dominant (69%) over the amount of sediment exported to seawards (31%) (Fig. 11). This was due to the erosion of the seaward flank of Laida beach which released sediment into the estuary through the inlet during the flood tide at high water. The landward movement of sand into the estuary during neap tides is very dominant as compared to the amounts moved to sea-wards. The same is true during spring tides but with the same process operating at a lower intensity.
3. Discussion
3.1. Temporal evolution of the bottom morphology Sediment accumulation and erosional processes in the mouth of the Oka estuary were studied at different tem-poral scales (bimonthly and seasonal) by analysis of the bottom morphology at the beginning and at the end of
each considered period (Fig. 12).
During the summer, on the eastern area of the open bay seaward of the Laida beach-dune barrier an eastward mi-gration of sand ridges occured (55,000 m3, zone 1)
si-multaneously with erosion on the seaward parts of Laida beach (-80,500 m3, zone 2). Between July-September
2005, sediment accumulated on the proximal (54,000 m3,
zone 3) and distal (24,000 m3, zone 4) areas of the
Mun-daka sand bar (Fig. 12).
In contrast, during winter, important erosion occured in the zone within the subtidal and intertidal areas of the inlet. Deposition of the eroded sediment occured in deep-er areas located furthdeep-er north to seawards, such as in the area below the base level of wave erosion (55,300 m3,
zone 1a) and also on the low-tide terrace and beach face of the eastern area of Laida beach (47,500 m3 zone 1b).
Intense erosion on the beach occured in the eastern area between February-April 2006 (-115,000 m3 zone 2) and
in the northwestern area between November-December 2005 (-23,000 m3 zone 3). Other sediment returned into
the bay by the ebb-tidal currents and redirected to the dis-tal and proximal areas of the Mundaka sand bar (94,000 m3, zone 4). Erosion took place on the shallower distal
area of the Mundaka sand bar and supplied sediment to the subtidal area located at its base to seaward (43,000
Fig. 10.- Percentages of transported sediment during a tidal cycle under spring tide conditions, neap tide conditions, and the summer period (May-October 2005). Arrows indicate merely seaward/lanward flux and they are not exact directions.
Fig. 10.- Porcentaje de sedimento transportado durante un ciclo mareal bajo condiciones de mareas vivas, bajo condi-ciones de mareas muertas y durante el período estival (Mayo-Octubre 2005). Las flechas indican solamente el flujo hacia dentro/fuera del estuario y no representan direcciones concretas.
m3, zone 5) (Fig. 12).
When the Mundaka sand bar area is analyzed in detail (Fig. 13), it is clear that the proximal (zone 1) and distal (zone 2) areas experienced sand deposition during sum-mer (July-August 2005). Simultaneously, the inlet located at the western side of the Mundaka sand bar (zone 3) be-came deeper and the previous tidal delta at the mouth of the new (anomalous) inlet channel disappeared (zone 4). On the other hand, in winter (October-December 2005), sedimentation occured on the proximal area of the Mun-daka sand bar (zone 1). Sand accumulated on the break of slope of the distal area of the Mundaka sand bar (zone 2) and erosion of the distal area (zone 3) of the Mundaka sand bar occured between October-December 2005 and January-February 2006 when important gales were expe-rienced. Furthermore, a channel separating the proximal and distal sand bar areas deepened during October 2005-February 2006 (zone 4), and important erosion occured at the proximal area of the base of the sand bar (zone 5). 3.2. Morphodynamical development of the outer estuary
Under summer conditions (May-October), which were characterized by the absence of gales and the presence of low intensity wave action, Laida beach received sediment from sand ridges that migrated from the northeastern area of the open bay, mostly due to the current action gener-ated by the breaking waves and secondarily due to tidal
currents. Up to three sand ridges were formed and moved landward across the intertidal area to build a beach profile and depositing a large volume of sand on the beachface, thus favoring the development of a wide berm. These sand ridges had crests with two different directions: to the southwest (on their west side) and to the south-east (on the south-east side), together with sand mega-ripples moving along the runnels, indicating the combined ac-tion of breaking waves and their variaac-tion of height and tide currents (funnelling effect). The Mundaka sand bar was fed by the tidal currents that, in the absence of gales, deepened the inlet channel and deposited the sediment on the bar after the expansion of flow (jet effect) (French, 1960; Mota-Oliveira, 1973).
During winter (November-April), as a consequence of the increased wave energy, the Laida beach was eroded and sand was transported both to the subtidal areas (Fig. 14), away from the area dominated by wave action but always within the –25 m bathymetric contour, which rep-resents the theoretical seaward boundary of the estuarine system (Iberinsa, 1992), and to the inner estuary. This process produced a very pronounced slope on the sea-ward part of Laida beach. However, the intertidal zone (low-tide terrace) exhibited a flat rippled bottom mor-phology. Wave and tidal activity in this period eroded the Mundaka sand bar and modified its morphology.
For any one tidal cycle, during the ebb tide, tidal cur-rents were dominant and reached their maximum
inten-Fig. 11.- Percentages of transported sediment during a tidal cycle under spring tide conditions, neap tide conditions, and the winter period (November 2005-April 2006).
Fig. 11.- Porcentaje de sedimento transportado durante un ciclo mareal bajo condiciones de mareas vivas, bajo condiciones de mareas muertas y durante el período invernal (Noviembre 2005-Abril 2006).
230 Monge-Ganuzas et al. / Journal of Iberian Geology 34 (2) 2008: 215-234
sity at mid-tide. These currents transported the sand de-posited by the waves, and moved it to the outer estuary and deposited it on the Mundaka sand bar. The ebb tide decelerates progressively northwards and generated a new inlet on the western margin, where the wave heights are lower. Initially (May 2005), sand accumulated within the former inlet due to the supply from the intense ero-sion of the dumped material landward of Laida beach. This situation changed during the study period with the deepening of the former inlet and the transportation of sand to the Mundaka sand bar in the outer estuary. At low water, the wave activity was concentrated on the Mun-daka sand bar to the west and on the outer limit of the in-tertidal beach (low-tide terrace) to the east, eroding these areas and transporting the sediment towards the beach.
During the flood tide, the water passes through the inlet and currents are convergent and this flood supplied sand to the levee bordering the inlet on its eastern flank and together with wave action rebuilt the beach profile. Once the flooding tidal waters passed through the inlet, it ex-pands to produce the flood-delta by the deposition of the transported sand.
Based on the wave modelling produced previously (Cearreta et al., 2006), the interaction between the tidal currents and waves modifies their mutual characteristics. Wave propagation changed depending upon the tidal ac-tivity. During the ebb tide supplementary wave refrac-tion occured. Tidal currents flowing against the direcrefrac-tion of the wave propagation causes a decrease in its velocity and wavelength (Dean and Dalrymple, 1984). In this way,
Fig. 12.- Seasonal (summer and winter) sedimentary budget (accumulation/erosion) between May 2005 and April 2006 on the outer estuary. May-October 2005: 1 (migrating bars, 55,000 m3); 2 (Laida beach, -80,500 m3); 3 (proximal Mundaka sand bar, 54,000 m3) and 4 (distal Mundaka sand bar, 54,000 m3). October 2005-April 2006: 1a (area below base level of wave activ-ity, 55,300 m3); 1b (area in front of Laida beach, 47,500 m3); 2 (eastern area of Laida beach, -115,000 m3); 3 (western area of Laida beach, -23,000 m3); 4 (proximal Mundaka sand bar, 94,000 m3) and 5 (distal Mundaka sand bar, 43,000 m3). Solid black line represents LWM (low water mark, 0 m) and dashed black line represents HWM (high water mark, 4 m) at the end of each season. Blank areas were unsurveyed.
Fig. 12.- Balance sedimentario (deposición/erosión) semestral (verano e invierno) entre los meses de Mayo 2005 y Abril 2006 para la zona exterior del estuario. Mayo-Octubre 2005: 1 (barras migratorias, 55,000 m3); 2 (playa de Laida, -80,500 m3); 3 (zona proximal de la barra de Mundaka, 54,000 m3) y 4 (zona distal de la barra de Mundaka, 54,000 m3). Octubre 2005-Abril 2006: 1a (zona bajo el nivel de base del oleaje, 55,300 m3); 1b (zona frente a la playa de Laida, 47,500 m3); 2 (zona este de la playa de Laida, -115,000 m3); 3 (zona oeste de la playa de Laida, -23,000 m3); 4 (zona proximal de la barra de Mundaka, 94,000 m3) y 5 (zona distal de la barra de Mundaka, 43,000 m3). La línea negra contínua representa el NB (nivel de bajamar, 0 m) y la línea negra discontínua representa el NP (nivel de pleamar, 4 m) al final de cada semestre. Las zonas blancas no fueron estudiadas.
the morphology of the wave fronts was modified by the ebb current and, as a consequence, also their direction of propagation. Tidal currents, that were channelized along the west margin due to the jet effect, caused the wave fronts to be concentrated by the opposing jet flow and to deform, and to break eastwards creating the famous “Mundaka left wave”.
In general, the tidal currents may also be modified by wave action. Waves make the exit of the ebb tide water difficult (Grant and Madsen, 1979). In the Oka estuary, waves approach mainly from the northwest and force the ebb current to move to the western margin where the wave heights are smaller. This process, together with the sand transport towards the inlet on the northern beach area, is responsible for the westward displacement of the new “anomalous” inlet to its former position, contribut-ing in this way to the restoration of the normal conditions in the estuary mouth.
The morphodynamical evolution of the Mundaka sand bar during the study period documents its natural
restora-tion, departing from an initial situation (May 2005) when it was fragmented, sand starved, and not orientated fa-vourably for the formation and development of the char-acteristic “Mundaka left wave”. The additional sand sup-ply during the summer caused the rapid reconstruction of the sand bar, both horizontally and vertically. By the end of the summer its conditions were adequate for the formation of the famous surfing wave, although its break point moved slightly southward and it did not extend as far eastwards as before. During the winter, the eastern margin of the sand bar aquired a more oblique orientation to the wave approach, giving place to a more progressive wave break, and increasing in this way the length of the “surfable” line. However, the presence of the anomalous inlet across the sand bar during December 2005-February 2006 altered the breaking features of the smaller waves. Since March 2006 the inlet channel has relocated itself at the western margin of the estuary, allowing the sand bar to recover its previous morphology and magnitude and was able to generate that peculiar “left wave”.
Fig. 13.- A: Monthly sedimentary budget (accumulation/erosion) between May 2005 and April 2006 on the Mundaka sand bar area. May-October 2005: 1 (proximal area), 2 (distal area), 3 (western side) and 4 (previous tidal delta). May-October 2005-April 2006: 1 (proximal area), 2 (break of slope), 3 (distal area), 4 (channel between proximal and distal areas) and 5 (base of proximal area). Blank areas were unsurveyed.
Fig. 13.- A: Balance sedimentario (deposición/erosión) mensual entre los meses de Mayo 2005 y Abril 2006 para la zona de la barra de Mundaka. Mayo-Octubre 2005: 1 (zona proximal), 2 (zona distal), 3 (lado oeste) y 4 (delta mareal previo). Octubre 2005-Abril 2006: 1 (zona proximal), 2 (rotura de pendiente), 3 (zona distal), 4 (canal entre las zonas proximal y distal) and 5 (base de la zona proximal). Las zonas blancas no fueron estudiadas.
232 Monge-Ganuzas et al. / Journal of Iberian Geology 34 (2) 2008: 215-234
Fig. 14.- Sedimentary budget (accumulation/erosion) of a north-south profile in the central area of the outer estuary for the summer (July 2005) and winter (February 2006) periods.
Fig. 14.- Balance sedimentario (deposición/erosión) de un perfil norte-sur en el área central de la zona exterior del estuario para los periodos estival (Julio 2005) e invernal (Febrero 2006).
In summary, the general process was sediment transport from the northeast to the southwest along the rocky east-ern margin of the open bay and the northeast-ern area of Laida beach towards the estuary inlet. Whence, some sediment was introduced into the estuary to feed the flood delta, and the remainder of the sediment was transported sea-wards to restore the Mundaka sand bar (ebb delta). This process operated throughout the whole year although sea-sonally, according to the dominance of the main respon-sable process: tidal flows during the summer and wave action during the winter (Fig. 15).
The changes of the different parameters that control this situation are the cause of the natural morphodynami-cal variability of the outer estuary. This area is always constituted by the same elements (beach, inlet, ebb delta, flood delta), but in detail they exhibit great variability at different scales, from daily to yearly, although maintain-ing a dynamic equilibrium (except when interfered by anthropogenic influences).
4. Conclusions
The sedimentary equilibrium of the Oka estuary mouth is controlled by the continuous movement of sand be-tween its different morphological elements. There is a dynamic equilibrium due to the variable intensity with time of the various processes.
Since the last dumping of sand, the volume of eroded sediment on the landward of Laida beach increased sub-stantially, reaching a value of 11,000 m3/month in the
second half of 2003. This increase of the rate of erosion in such a short period of time introduced an enormous amount of sand into the inlet area. A part of this sand was deposited there, caused the cutting of a new anomalous inlet to the east and modifying the ebb delta. Later, the erosion rate decreased and almost matched the normal values before the sand dumping.
During the summer, on the intertidal area north of La-ida beach sand ridges migrate to the southwest
transport-Fig. 15.- Summary of sedimentary budget (accumulation/erosion) and sediment transport between May 2005 (beginning of the study) and April 2006 (end of study) for the outer estuary.
Fig. 15.- Resumen del balance sedimentario (deposición/erosión) el transporte de sedimento entre los meses de Mayo 2005 (comienzo del estudio) y Abril 2006 (fin del estudio) para la zona exterior del estuario.
234 Monge-Ganuzas et al. / Journal of Iberian Geology 34 (2) 2008: 215-234
ing sediment from the northeastern area of the open bay towards the beach and inlet. In this way, a typical sum-mer beach profile characterized by ridges and runnels was produced in the lower intertidal area (low-tide ter-race) and a wide berm was generated. The “anomalous” inlet, generated as a consequence of the infilling of the original inlet, disappeared in July-August 2005 due to the displacement of the sand bars discussed above and the transport of water and sediment induced by the ebb tide. These processes strengthed the development of the Mun-daka sand bar and returned the inlet to its normal position close to the western rocky margin of the estuary.
During winter, the sand ridges present on the low-tide terrace in summer disappeared and part of the sediment was introduced into the estuary and the remainder was transported to the proximal area of the Mundaka sand bar, to leave a flat rippled intertidal area. Furthermore, the slopes between the subtidal and intertidal areas and the intertidal and supratidal areas (berm) were more pro-nounced giving place to a typical winter profile.
Generally, the annual process showed a sediment trans-port from the northeast to the southwest along the east rocky margin of the open bay and the northern area of Laida beach to the estuarine inlet. From there, some sedi-ment was moved landwards into the estuary to feed the flood delta and some to seawards to feed the Mundaka sand bar (ebb delta). This process operates throughout the whole year but whereas tidal dynamics are more impor-tant during summer, incident wave dynamics are domi-nant during winter.
In summary, the extra sand introduced into the low-ermost estuarine system caused an upset in the natural processes, and these were finally accomodated by the system which after 3 years restored the situation to what it was before the dumping. No anthropogenic corrective measurements were adopted on the outer estuary during the study period and the environment recovered naturally with the restablishment of the normal morphological fea-tures. It is hoped that this natural restoration will be more stable, long-lasting and reliable in order to ensure the fu-ture of the “Mundaka left wave”.
Acknowledgements
The authors would like to record their thanks to vari-ous people. Xabier Arana, Director of the Board of the
Urdaibai Biosphere Reserve, supported decisively this research project. Michael Collins, Erwan Garel, Haris Plomarttis and Andrew Symonds (National Oceanogra-phy Centre, Southampton, UK) made possible field work with the Valeport equipment during the summer of 2005. Spanish Puertos del Estado supplied oceanographic data from the Bilbao-Vizcaya buoy and Bilbao tide gauge. The Environmental Quality Department of the Basque Government supplied meteorological data from the Mun-daka station. Adolfo Uriarte and Pedro Liria (AZTI) participated during the summer period of this research. Graham Evans (University of Southampton, UK), Mar-ia Conceição Freitas and César Andrade (University of Lisbon, P) critically reviewed and improved greatly the original manuscript. This work has been financed by a contract signed between the Environment and Land Use Department of the Basque Government and the Stratigra-phy and Palaeontology Department of the University of the Basque Country.
References
Banco de datos Oceanográficos de Puertos del Estado (www. puertos.es) Ministerio de Fomento (2003): Clima medio de
oleaje, Boya de Bilbao-Vizcaya.
Cearreta, A., Monge-Ganuzas, M., Iriarte E. (2004):
Segui-miento y evaluación sedimentológica del proyecto de regene-ración dunar en Laida (Reserva de la Biosfera de Urdaibai). Informe final (Octubre 2001-Diciembre 2004). Unpublished
Report for the Environment and Land Use Department of the Basque Government: 42 p.
Cearreta, A., Monge-Ganuzas, M., Iriarte, E. (2006):
Segui-miento morfodinámico de la desembocadura del estuario del Oka (Reserva de la Biosfera de Urdaibai) Mayo 2005-Abril 2006. Unpublished Report for the Environment and Land
Use Department of the Basque Government: 131 p.
French, J.L. (1960): Tidal flow in entrances. U.S. Army Corps of Engineers, Committee on tidal Hydraulics. Technical Bul-letin, 3.
Dean, R., Dalrymple, R.A. (1984): Water wave mechanics for
engineers and scientists. Prentice-Hall Inc: 353 p.
Grant, W.D., Madsen, O.S. (1979): Combined wave and cur-rent interaction with a rough bottom. Journal of Geophysical
Research, 84: 1797-1808.
Iberinsa (1992): Estudio geofísico marino de la costa de
Viz-caya. Unpublished Report for the Dirección General de Costas
of the Spanish Ministry of Public Works and Transport. 43 p Mota-Oliveira, I.B. (1973): Embocaduras lagunares.