(will be inserted by the editor)
Forest Fire Danger Projections in the Mediterranean using
ENSEMBLES Regional Climate Change Scenarios
J. Bedia · S. Herrera · A. Camia · J.M. Moreno · J.M. Guti´errez
Received: date / Accepted: date
Abstract We present future fire danger scenarios for the countries bordering the Mediterranean areas of Europe and north Africa building on a multi-model ensemble of state-of-the-art regional climate projections from the EU-funded project ENSEMBLES. Fire danger is estimated using the Canadian Forest Fire Weather Index (FWI) System and a related set of indices. To overcome some of the limitations of ENSEMBLES data for their application on the FWI System —recently highlighted in a previous study by Herrera et al (2013)— we used an optimal proxy variable combination. A robust assessment of future fire danger projections is undertaken by disentangling the climate change signal from the uncertainty derived from the multi-model ensemble, unveiling a positive signal of fire danger potential over large areas of the Mediterranean. The increase in the fire danger signal is accentuated towards the latest part of the transient period, thus pointing to an elevated risk of fire in the region with time. The fire-climate links under present and future conditions are further discussed building upon observed climate data and burned area records along a representative climatic gradient within the study region.
Keywords Climate Change · Fire Weather Index · Fire potential · Regional Climate Models · forest fires
J. Bedia · J.M. Guti´errez
Grupo de Meteorolog´ıa. Instituto de F´ısica de Cantabria. CSIC-Univ. de Cantabria, Avda. de los Castros, s/n, 39005 Santander, Spain
S. Herrera , Spain
Grupo de Meteorolog´ıa. Dpto. Matem´atica Aplicada y Ciencias de la Computaci´on. Univ. de Cantabria, Avda. de los Castros, s/n, 39005 Santander, Spain
A. Camia
European Commission, Joint Research Centre (JRC), Institute for Environment and Sustain-ability, Ispra, Italy
J.M. Moreno
Dpto. Ciencias Ambientales, Universidad de Castilla La Mancha. Av. Carlos III s/n, 45071 Toledo, Spain
1 Introduction
Wildfires are events highly dependent on meteorological drivers (Krawchuk et al, 2009), so much so that global fire activity can be simulated with a handful of climate variables (Pechony and Shindell, 2010). These meteorological variables are thus commonly used to build fire danger indices, which are applied to characterize and anticipate potentially dangerous conditions (e.g. Stocks et al, 1998; Williams et al, 2001). The Canadian For-est Fire Weather Index (FWI System) is applied worldwide, constituting a building block of the Canadian Forest Fire Danger Rating System (CFFDRS), established in Canada since the early 70’s (van Wagner, 1987; Stocks et al, 1989) and subsequently adopted in other regions of the world, like the Mediterranean (Viegas et al, 1999; Dim-itrakopoulos et al, 2011), nowadays becoming a reference index by the Joint Research Center to produce fire danger maps at the European level (see e.g., Camia et al, 2008). In the context of climate change, fire danger conditions are expected to increase in many regions of the world due to the projected changes in climate (Groisman et al, 2007; Seneviratne et al, 2012), being the Mediterranean among the most sensitive ar-eas to these changes (see, e.g., Mouillot et al, 2002). Therefore, reliable estimates of future fire danger are crucial for the implementation of effective adaptation strategies to these climate-dependent, disaster-prone phenomena. The state-of-the-art regional climate change scenarios for Europe were produced in the EU-funded ENSEMBLES project (van der Linden and Mitchell, 2009), building on the IPCC-AR4 Global Cli-mate Models (GCMs) and based on the principal Regional CliCli-mate Models (RCMs) developed in Europe, to produce for the first time multi-model scenarios at a 25km resolution for the SRES-A1B scenario (see van der Linden and Mitchell, 2009, for an overview).
The main goal of the present work is developing future FWI System projections based on the multi-model ENSEMBLES dataset. In the first part of this study we deal with a recently reported limitation of this dataset (Herrera et al, 2013) which precludes from a direct exploitation of the ENSEMBLES scenarios to this aim. Whereas FWI System is based on instantaneous weather variables recorded at noon (van Wagner, 1987), the ENSEMBLES database provides daily means and/or extreme daily records from the RCM outputs (e.g. minimum relative humidity, maximum temperature, etc.). Thus, in the first part of this study we analyse the possibility of using maximum temperature and minimum relative humidity (available in the ENSEMBLES database) as proxy variables of the instantaneous noon input data. To this aim, we consider a single ENSEMBLES RCM with full availability of data, obtained directly from the modelling center. In the second part of this work, we present future fire danger scenarios for the Mediterranean using the optimal proxy combination obtained from the previous analysis. To this aim, we consider a multi-model ensemble of five ENSEMBLES RCMs driven by two different GCMs.
Building upon the previous projections of the EU-funded project PRUDENCE (Christensen et al, 2007), two previous studies of FWI System-based fire danger pro-jections in the Mediterranean (Moriondo et al, 2006; Amatulli et al, 2013) point to an increment of fire danger potential, although both are based on a single RCM driven by a single GCM, thus preventing from a proper assessment of model uncertainties. Fur-thermore, in the absence of the necessary instantaneous variables —the data archive of both projects includes similar variables— the aforementioned studies used a suboptimal version of actual FWI System as it is shown in this article. For a better comparability of results, we use the same reference areas as (Moriondo et al, 2006) in this study. Our
results highlight the need of multi-model ensemble projections in order to obtain an estimation of model uncertainties and to identify those areas where the projections can be considered robust, and therefore potentially useful for planners and decision-makers. In addition, we provide a number of practical recommendations regarding the adequate indices for future fire danger assessment, in the light of the uncertainties derived from their use in climate change conditions. Finally, the actual fire-climate relationship is assessed using observed climate data and burned area records to aid in the discussion of the potential fire impacts under the calculated fire danger scenarios.
2 Data and Methods 2.1 The Fire Weather Index
The Fire Weather Index (FWI) System consists of six components rating the effects of fuel moisture content and wind on a daily basis, based on various factors related to potential fire behaviour. The combination of the different fuel moisture codes and fire behaviour indices produce the Fire Weather Index (FWI), a dimensionless index rating the potential fire line intensity given the meteorological conditions. The Daily Severity Rating (DSR, van Wagner, 1970) is calculated as an exponential function of FWI to better reflect the expected efforts required for fire suppression and also for spatial/temporal aggregation purposes. The FWI System uses as input four me-teorological variables: daily accumulated precipitation and instantaneous wind speed, relative humidity and temperature. According to the standard data recording protocol, these variables should be measured at noon local standard time (Lawson and Armitage, 2008). More details of FWI system structure are provided in the supplementary mate-rial.
We computed FWI and retained only the data corresponding to June-September (JJAS), thus focusing in the season of critical fire danger in the Mediterranean. In each case, we calculated a number of commonly used FWI-derived fire regime indices, following previous work (Bedia et al, 2012; Herrera et al, 2013; Bedia et al, 2013):
– The seasonal severity rating (SSR), by seasonally averaging the DSR (van Wagner, 1970).
– The seasonally averaged FWI. Although SSR was conceived for averaging FWI values by season, FWI mean values are often found in the literature (Moriondo et al, 2006, e.g. ), so we also computed mean FWI for a better comparability with previous studies. However, in order to analyse the consistency of this index, we did the calculation of mean FWI following two alternative approaches:
i. By directly averaging the daily FWI values obtained across areas/time periods (also termed FWI throughout the text) and
ii. By computing the FWI from the resulting SSR values applying the inverse of the DSR equation. This version of the mean FWI is referred to as SFWI in the text.
– The 90-th percentile of FWI (FWI90), to account for the extreme range of the fire danger spectrum. Note that FWI90 was computed using the JJAS series.
– The frequency-over-threshold 30 (FOT30), i.e. the number of days with FWI > 30, expressed as a percentage of the total number of days. This index is computed considering only the JJAS period. While actual fire danger may vary significantly
Table 1 Temporal aggregation of the FWI System input variables tested in this study. 12UTC correspond to instantaneous model outputs at that time. DM corresponds to daily mean val-ues, and Max/Min to maximum/minimum daily values. Precipitation is always the 24-hour accumulated value. The asterisk indicates the combination following the original definition of the FWI System (not available through the ENSEMBLES data server) whereas the remaining combinations (C1-C4) are different surrogates of C0 (the actual FWI system input definition), available in the ENSEMBLES database.
Temp. R. Hum. Precip Wind vel.
C0* 12UTC 12UTC 24h 12UTC
C1 DM DM 24h DM
C2 Max DM 24h DM
C3 DM Min 24h DM
C4 Max Min 24h DM
in different regions for the same FWI value, indices above a certain appropriate threshold are indicative of very high to extreme fire danger conditions (see, e.g. Palheiro et al, 2006; Moriondo et al, 2006). In this study we use a threshold of 30 to illustrate the behaviour of threshold-dependent indices, although similar results were obtained using other thresholds (i.e. 15 and 45, not shown).
– The length of the fire season (LOFS), defined as the number of days per year cor-responding to the fire season. The fire season is defined by the start/end according to the FWI≥15/FWI<15 threshold values respectively, maintained for two consec-utive weeks in the 7-day moving average annual FWI series. The rationale behind these values, empirically derived from previous analyses in Italy and Greece, is pro-vided by Moriondo et al (2006). Note that the computation of LOFS was done on the whole annual series, rather than on the JJAS time slice.
2.2 Regional climate change scenarios from RCMs
We focused in a subset of six ENSEMBLES RCM-GCM couplings driven by two dif-ferent GCMs (HadCM3 and ECHAM5) and a single control (20C3M) and transient (SRES-A1B) scenarios (Naki´cenovi´c, 2000): C4I RCA3.0, ETHZ CLM, HC -HadRM3, KNMI - RACMO2, MPI - REMO and SMHI - RCA.3.0 (Nomenclature follows the structure Modelling Centre - Name of the model). In the following, mod-els will be termed using the modelling centre acronyms (in bold, more details in the supplementary material). Note that two different physics schemes, Q0 and Q16, are considered for the HadCM3 model (Collins et al, 2006), the latter leading to more extreme scenarios in terms of high temperatures and dryness than the standard un-perturbed physics scheme (Q0).
The selection of these models was based on two criteria: 1) They have demonstrated a good overall performance in previous studies (see e.g. Herrera et al, 2010; Coppola et al, 2010). 2) In addition, all of them fulfil the condition of bearing all the required variables for the proxy analysis (see Sec. 2.3), and in particular minimum relative humidity, which is not common to all ENSEMBLES RCMs. It is important to remark that each RCM is treated separately throughout all the process of fire danger scenario generation, and only the resulting final values are aggregated/summarised in terms of the multi-model mean and standard deviation.
2.3 Calculation of the FWI System with proxy variables
Since the ENSEMBLES database does not store the instantaneous variables required for FWI calculation (see Sec. 2.1), in this work we consider alternative proxy variables and test their suitability. To this aim, we considered minimum daily humidity and maximum daily temperature as proxies of their noon value, assuming that they are representative of the atmospheric conditions at that time. However, for wind speed no suitable proxy variable was found and the daily mean value is used instead in all cases. We tested different combinations of wind speed and precipitation with the two proxy variables, as shown in Table 1, in order to construct the different FWI System components and the derived fire danger indices (Section 2.1). The resulting values were compared with the reference version built upon instantaneous variables at 12UTC (C0, Table 1). To this aim, we used data from the KNMI model with full data availability (including the required instantaneous data), obtained directly from the modelling center. The good performance of this RCM has been reported in different studies and for different sub-regions of Europe (e.g., Herrera et al, 2010; Kjellstr¨om et al, 2010; van Meijgaard et al, 2012).
The testing area for the proxy experiment was geographically restricted to the Iberian Peninsula, given that this is an area of pronounced climatic variability and representative of the different fire danger areas throughout the European domain of the study. For brevity, in the proxy analysis we only show the results for SSR, FWI90 and FOT30, which are representative of fire danger mean and extreme conditions, and from threshold dependent fire danger indices, respectively. In this regard, the results obtained for FWI (and SFWI) were similar to SSR, and the results corresponding to LOFS were in accordance with FOT30.
2.4 Observational reference dataset
The WFDEI dataset is based on the ERA-Interim reanalysis (see Weedon et al, 2011, for a methodological description applied to ERA-40), consisting of eight meteorological variables at 3-hourly time steps and as daily averages, for the global land surface at 0.5◦ resolution for the period 1979–2012. It has been chosen for application in this study because it allows the calculation of FWI according to its original definition and to the different proxy versions tested in this study (Table 1), and also because of the better adequacy of ERA-Interim for fire danger applications compared to ERA-40 (Bedia et al, 2012). Further comparisons against previous datasets generated in the frame The Water and Global Change EU-funded project WATCH (2007-2011, www.eu-watch.org) are provided in the supplementary material, providing further rationale on the selection of WFDEI in this study.
2.5 Computing the climate change signal
RCM projections cannot be directly used in impact studies, since they may contain significant biases inherited from the GCMs and also resulting from different physics and parametrisations involved in the formulation of the models (Christensen et al, 2008). In this regard, the “delta method” is often applied in climate research (e.g., Winkler et al, 1997) in order to extract the climate change signal from model simulations while
significantly alleviating the problems linked to model biases (e.g., R¨ais¨anen, 2007). The delta method operates by calculating the difference of the RCM values for a variable of interest in a future period (such as 2071-2100, given by the transient A1B runs) and in a control period (such as 1971-2000, given by the control 20C3M runs), working at a grid-box level. Thus, as far as all values are relative to the same RCM-GCM coupling, the effect of these biases is cancelled to a great extent. Throughout the text, the term delta will be used in the sense of anomaly of the future time slices with regard to the historical one (1971-2000). We computed the anomalies (or deltas) of the fire danger indices defined in section 2.1: SSR, FWI, FWI90, FOT30 and LOFS for the periods 2011–2040, 2041–2070 and 2071–2100. 11.15 21.51 7.18 10.36 (0.88, 1.15) 24.89 (0.19, 12.35) 4.93 (0.93, 2.25) 11.27 (0.93, 0.80) 25.47 (0.59, 8.63) 5.95 (0.94, 1.28) 10.68 (0.92, 0.86) 20.18 (0.92, 3.00) 7.51 (0.95, 0.75) 11.16 (0.87, 1.01) 16.70 (0.81, 5.90) 8.61 (0.94, 1.59) 0 4 8 12 16 0 4 8 12 16 0 10 20 30 40 43.66 49.51 12.25 30.19 (0.93, 13.47) 18.34 (0.84, 31.16) 6.24 (0.94, 6.01) 34.61 (0.94, 9.05) 28.40 (0.89, 21.12) 8.02 (0.94, 4.23) 44.09 (0.96, 2.37) 52.78 (0.97, 5.59) 12.94 (0.96, 1.43) 49.55 (0.96, 6.02) 61.63 (0.96, 12.22) 16.20 (0.96, 4.00) 0 20 40 60 80 100 0 20 40 60 80 100 0 5 10 15 20 25 30 FWI90 FO T3 0 SSR C1 C2 C3 C4 C0* C1 C2 C3 C4 C0* FWI90 FO T3 0 SSR Delta KNMI (2071-2100) KNMI (1971-2000)
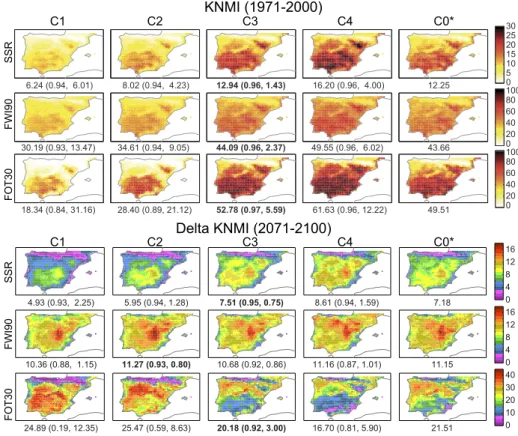
Fig. 1 Climatologies of the FWI-derived indices of fire danger according to the actual FWI (C0) and the different input proxy versions tested (C1-C4, see Table 1), using the dara from the KNMI RCM. In the upper panel, the results of the 20C3M scenario (1971-2000) are pre-sented. The lower panel displays the corresponding delta values —difference between the A1B (2071-2100) and the 20C3M (1971-2000)— for the different input proxy versions tested. The figures below each map indicate the spatial mean, and in parenthesis the Spearman’s rho cor-relation coefficient and the mean absolute error (MAE), in this order. Best proxy versions are highlighted in boldface.
C4I (0.92) WFDEI ETHZ (0.93) KNMI (0.95) MPI (0.94) HC (0.79) SMHI (0.92) Balkans France Greece Italy Portugal Spain Turkey 0 20 40 60 80 100 FWI90
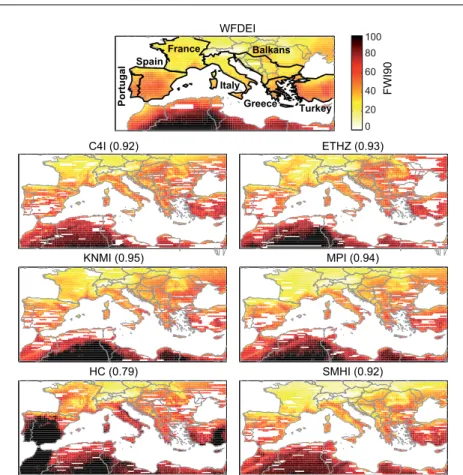
Fig. 2 FWI90 projections for the 20C3M scenario (1971-2000) according to the different EN-SEMBLES RCMs and proxy version C3, and the corresponding C3 reference calculated using the WFDEI dataset. Numbers in parenthesis indicate the Spearman’s rho spatial correlation coefficient of each RCM against WFDEI.
3 Results and Discussion
3.1 Best proxy selection for FWI calculation
For the assessment of proxy adequacy, we computed the spatial mean, Mean Absolute Error (MAE) and the spatial correlation (Spearman’s ρ) for the proxy versions of the fire indices (Table 1) with respect to the reference FWI (C0). The upper panel of Fig. 1 depicts the results for SSR, FWI90 and FOT30 for the 1971-2000 control run, showing that the combination C3 attained the best agreement with the reference values, whereas C1 and C2 notably underestimated the spatial values and C4 overestimated specially SSR and FOT30. These results are similar as those obtained with the different components of the FWI system (presented in the supplementary material). On the other hand, the high spatial correlation values attained by proxy C1 are in accordance with previous analyses (Carvalho et al, 2010; Herrera et al, 2013). However, correlation is insensitive to the bias magnitude, which is remarkable in some cases, with a high positive bias in the case of C4, and a negative bias in the case of C1 and C2.
The corresponding deltas for the period 2071-2100 are presented in the lower panel of Fig. 1. The climate change signal of FWI90 is fairly similar among the different proxy versions, being C4 and C3 the closest to the reference value. On the other hand, C3 provided the most accurate representation of C0 for the mean fire regime, represented by the seasonal severity rating (SSR), and for the threshold-dependent index FOT30. Furthermore, C3 was the only proxy version yielding high correlation values (ρ > 0.9) for all the fire danger indices. It is also noteworthy the failure of proxies C1 and C2 to represent FOT30 deltas; C2 was used by Moriondo et al (2006) in the calculation of the length of future fire season, using threshold-dependent measures similar to FOT30 (FOT15 and FOT45). Thus, the results of this previous study should be considered with caution, provided the poor performance attained by this proxy version in the case of future FOT30 projections (Spearman’s ρ = 0.59). These results align with previous findings by Herrera et al (2013), in which future projections of FOT30 built upon C1 proxy were not consistent with C0 ones, neither in magnitude, nor in their spatial pattern.
In conclusion, the most adequate proxy definition of the FWI System for future scenario development is C3, so it will be used in the following sections to produce future FWI scenarios for the Mediterranean regions. Hereafter, all maps displayed will correspond to C3 proxy version unless otherwise indicated.
3.2 Analysis of FWI Projections in Present Climate Conditions
The comparison of the mean FWI against the SFWI (defined in Section 2.1) indicates that both calculation procedures yield similar results. We obtained a very high linear relationship between FWI and SFWI, according to the linear equation F W I = 3.4452+ 0.9777 × SF W I with a R2= 0.999. Similarly, the delta values were unaffected by the FWI aggregation version used (not shown). Thus, henceforth we will use mean FWI, and will refer to it as FWI throughout the paper.
The results for present climate conditions obtained with the ensemble of RCM-GCM couplings considering the 20C3M scenario (1971-2000) highlight the spatial con-sistency of the fire danger representation, regardless of the relative magnitudes exhib-ited by the different models, resulting from their inherent biases (see Section 2.2). For conciseness, we only present the results of FWI90 (see Fig. 2), although the same con-clusions can be drawn from the analysis of the remaining fire danger indices (see the supplementary material). The geographical pattern of the FWI90 maps is consistent across the two driving GCMs (HadCM3 and ECHAM5), with the exception of the HC RCM, which yields an anomalous positive bias in the Iberian Peninsula, Morocco and Turkey. Note that even the C4I model, which is also driven by the HadCM3 GCM, but with the more extreme Q16 perturbed parametrization setting (Collins et al, 2006) is consistent with the results from the rest of models.
Using the WFDEI proxy C3, we computed spatial correlations as an adequate bias-insensitive metric for comparison. All RCMs attained high spatial correlation values with WFDEI, significantly lower in the case of the HC model (Fig. 2). This lower correlation occurred for all FWI-derived indices (not shown), and notably for FOT30 and LOFS, with correlation coefficients around 0.65. Thus, in the following, the results of the HC model will be excluded from the multi-model ensemble projections. It is worth reminding that the previous projections by Moriondo et al (2006) are based solely on the projections of the HC RCM. In this sense, these results highlight the
(%)
days
Delta Multi-Model Mean
(2071-2100) Delta Multi-Model (2071-2100) σ 0 2 4 6 8 10 12 14 16 18 0 2 4 6 8 10 12 14 16 18 0 2 4 6 8 10 12 14 16 18 0 4 8 12 16 20 24 28 32 36 0 8 16 24 32 40 48 56 64 72 FWI90 (%) days R S S 03 T OF 0 20 40 60 80 100 0 20 40 60 80 100 FWI Multi-Model Mean (1971-2000) 0 5 10 15 20 25 30 LOFS 0 10 20 30 40 50 60 70 80 0 50 100 150 200 250 300 350
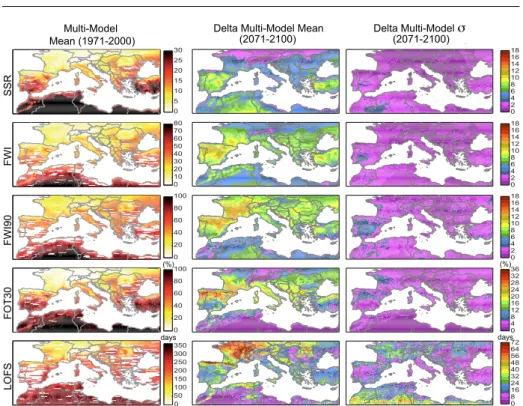
Fig. 3 Control (1971-2000) and future projections (deltas, 2071-2100) of the fire danger indices for the Mediterranean for the period 2071-2100 according to the multi-model ensemble of five RCM-GCM couplings, corresponding to the SRES A1B emissions scenario for the fire season (JJAS). Delta values (central panel) are calculated as the anomalies of the future scenario with regard to the multi-model ensemble mean of the 20C3M values (left panel). The panel on the right represents the delta spread of the multi-model (standard deviation).
importance of adopting a multi-model ensemble approach, allowing the analysis of different models in order to discard those RCMs likely to introduce large errors. It is worth mentioning other possible alternatives for ensemble model selection that have not been addressed in this article, as for instance average rankings, bias Z-scores, and elimination of the worst ranking model(s) in each category, although previous studies show that none of these approaches appear more robust or objective than any other (see Littell et al, 2011, for more details on these methods and their assessment).
The resulting 5-RCM ensemble climatologies of fire danger indices for the control run (1971-2000) are presented in the left column of Figure 3, attaining a narrow multi-model spread (shown in the supplementary material).
3.3 Future FWI Projections
The magnitude of the climate change signals for SSR, FWI, FWI90, FOT30 and LOFS are displayed in the central and right panels of Fig. 3. For brevity, only the deltas corresponding to the last part of the transient period (2071-2100) are displayed (see the supplementary material for extended information).
The vast majority of the study area exhibits a positive climate change signal, leading to increased values of the fire danger indices analysed. Remarkable increments are expected to occur for FOT30 and LOFS in areas with very low initial values (see Fig. 3), pointing to a lengthening of the fire danger season. However, both FOT30 and particularly LOFS, exhibit a large multi-model spread. The rest of fire danger indices, particularly SSR and FWI, but also FWI90 and FOT30, are projected to increase over the Mediterranean, specially SSR and FWI in the Iberian Peninsula and Turkey, and FWI90 and FOT30 in the Iberian Peninsula and southern France. Furthermore, the multimodel projections exhibit low standard deviation values, higher at those areas where the climate change signal is more intense, highlighting the robustness of these projections.
3.4 Regional Analysis of Future FWI Projections
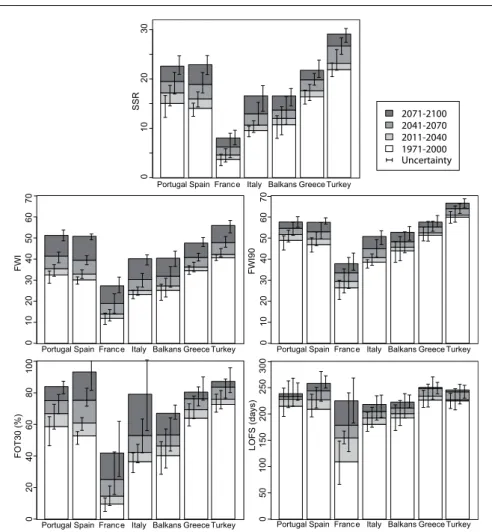
We computed spatial averages of present and future fire danger indices over selected Mediterranean areas (indicated in the top panel of Fig. 2) and the resulting deltas were successively stacked on the initial values of the baseline scenario (Fig. 4). Note that the range of the projected changes (i.e. minimum and maximum of the multi-model) is shown, rather that the standard deviation.
The deltas obtained for the different future periods using the FWI are proportion-ally similar to those of SSR, although the multi-model spread of FWI is more limited, especially in the second and third time slices (2041-2070 and 2071-2100). FWI pro-jections exhibit in all regions a clearly distinct and positive signal, as depicted by the non-overlapping vertical bars, which indicates a lower degree of uncertainty, as com-pared to SSR. Thus, FWI seems to have more desirable properties than SSR for climate change studies on account of the smaller spread of the future mean projected values. The projected future increases exhibit similar trends for all regions, with FWI means growing consistently with a non-linear law. Future fire danger scenarios elaborated for the Mediterranean by Moriondo et al (2006) also reported a similar summary by re-gions, although their results can only be partially compared with these ones, since the latter are built on a single RCM for the last time slice using a different emission sce-nario. The high multi-model uncertainty of the regional delta projections of most fire danger indices, particularly FOT30 and LOFS, warns against the use of a single RCM for projecting future fire danger conditions. In addition, the use of the multi-model en-semble approach is further supported by the fact that uncertainties (as depicted by the vertical bars) are well centred around the mean values, thus confirming the robustness of the projections.
It is worth noting that in all regions but France, the projected end-of-the-century multi-model average of FWI90 would be above 50, which is a critical level for large fires potential in Europe (see e.g. San-Miguel-Ayanz et al, 2013).
The results attained by regionally averaging FOT30 and LOFS reveal some short-comings in their use in the context of future fire danger assessment. Their multi-model spread is remarkable and for most periods analysed it is large enough to reach sig-nificantly overlaps among contiguous periods (though more moderately in the case of FOT30). Although there are also some overlaps in the case of FWI and FWI90 in some regions (e.g. France, Balkans), these are less frequent and of lesser relative magnitude. For instance, the ranges of LOFS projections in 1971-2000 significantly overlap with the 2071-2100 ranges in Portugal, Italy, the Balkans, Greece and Turkey and in all
these cases the overlap with 2041-2070 is such to render the projections substantially undistinguishable. The steep increase of the projected LOFS in France compared to the moderate to negligible increase in the other countries/regions, might suggest a sat-uration effect which would tend to grow more in areas with lower starting values and reduce the increments when getting around 200 days. It is also an indication that fu-ture climate conditions will induce a “mediterranean-type” fire danger season in areas that are currently under the Atlantic influence. On the other hand the quite strong inter-regional variability observed for FOT30 projected trends, and the absence of any comparable pattern in the other indices, would rather indicate a problem of stability of this index. We consider similar concerns to be applicable to any FWI threshold used, i.e. to any FOT-like, threshold-dependent index applied to FWI future projections.
3.5 Fire-Climate Relationship
In order to illustrate the potential application of the above results to estimate future fire impact, we analysed the actual link between fire danger conditions (as represented by FWI90) and fire impact (burned area), calculated using the observational data from the WFDEI dataset (Sec. 2.4) and the burned area data from the European Fire database of the European Forest Fire Information System (EFFIS, Camia et al, 2010). The obtained results are shown in Fig. 5, where each of the regions represents a spatially continuous climatic (2001-2012) gradient encompassing a representative range of fire danger conditions (Fig. 4). The figure shows how and increase in FWI90 leads to larger burned areas, both along the whole FWI90 gradient —considering the 10-year averages of the different regions (full circles)—, and for the local FWI90 gradients within each particular region —coloured crosses—. Similar results are also found using different indices (particularly FOT30, FWI and SSR). It is therefore expectable an increased severity of fire impacts in the Mediterranean regions in the forthcoming decades, especially in those areas where the magnitude of projected changes is larger. In this sense, it must be also acknowledged the evidence that fire in resource-limited ecosystems, such as those in the most arid and hotter Mediterranean areas, is not so dependent on fire danger conditions but instead driven by fuel amount and structure (Krawchuk and Moritz, 2010; Pausas and Paula, 2012). This is reflected in the weak links attained in the hotter and drier regions with highest FWI90 records in Fig 5c, posing the question of how climate-induced changes in ecosystem properties will affect future fire regimes as a result of climate-vegetation feedbacks, an important subject out of the scope of this study.
4 Conclusions
Our results indicate that proxy version C3 (minimum relative and the rest daily mean values) was the best proxy to actual FWI, outperforming C2 (maximum temperature and rest of daily mean values), the former being positively biased and the latter nega-tively with respect to actual FWI. Besides, proxy version C4 (combining both minimum humidity and maximum temperature) lead to a larger positive bias of fire danger esti-mates. Input combinations C3 and C2 gave upper and lower bounds of the actual FWI projections respectively, although C2 was outperformed by C3 in the representation of FOT30 deltas. Overall results show that C3 is the best proxy in order to give realistic
estimates of fire danger scenarios using the ENSEMBLES RCMs in current climate, and also a realistic estimation of the climate change signal.
A consistent positive signal in terms of fire danger potential over large areas of the Mediterranean was unveiled, accentuated in the latest part of the transient period. The degree of model uncertainty was particularly low in the case of FWI, highlighting the usefulness of this index for the assessment of future fire danger scenarios, regardless of the a priori best suitability of SSR to this aim. In addition, we found no significant differences between mean FWI and SFWI scenarios, neither in spatial pattern nor in magnitude. On the other hand, the use of threshold-dependent indices related to fire season length, often applied in impact studies (i.e. FOT30 and LOFS), is not recommended in the context of future impacts assessment, due to the particularly high uncertainty associated to their future projections.
We undertook a robust assessment of future fire danger projections by applying a multi-model ensemble approach. By comparison with previous studies (Moriondo et al, 2006) we found that the multi-model uncertainty (we considered 5 RCMs, but a single scenario) is even larger than the scenario uncertainty, highlighting the importance of adopting a multi-model ensemble approach. Moreover, the existing link between fire danger and fire impacts (burned areas in this study) evidences the potential applica-bility of the future fire danger scenarios for decision-making in those areas in which forest fires represent a relevant conditioning factor.
Acknowledgements The research leading to these results has received funding from the EXTREMBLES project (CGL2010-21869) funded by the Spanish R&D programme and from the European Union’s Seventh Framework Programme (FP7/2007-2013) under grant agree-ment 243888 (FUME Project). The authors acknowledge the RCM data sets from the EU-FP6 project ENSEMBLES (http://ensemblesrt3.dmi.dk) and would also like to thank Erik van Meijgaard from the Royal Netherlands Meteorological Institute (KNMI) for making available ENSEMBLES RACMO2 climate model output verifying at 12:00 UTC. We are also grateful to Jes´us Fern´andez and three anonymous reviewers for their insightful comments that greatly contributed to the improvement of the original manuscript.
References
Amatulli G, Camia A, San-Miguel-Ayanz J (2013) Estimating future burned areas under changing climate in the EU-Mediterranean countries. Sci Total Environ 450– 451:209–222
Bedia J, Herrera S, Guti´errez J, Zavala G, Urbieta I, Moreno J (2012) Sensitivity of Fire Weather Index to different reanalysis products in the Iberian Peninsula. Nat Hazards Earth Syst Sci 12:699–708
Bedia J, Herrera S, San Mart´ın D, Guti´errez J, Koutsias N (2013) Robust projections of Fire Weather Index in the Mediterranean using Statistical Downscaling. Climatic Change 120:229–247
Camia A, Amatulli G, San Miguel-Ayanz J (2008) Past and future trends of forest fire danger in Europe. Tech. Rep. EUR 23427 EN - 2008, Institute for Environment and Sustainability, JRC, European Comission, Ispra, Italy
Camia A, Durrant TH, San-Miguel-Ayanz J (2010) The European Fire Database: De-velopment, Structure and Implementation. In: 6th International Conference on Forest Fire Research, A20
Carvalho A, Flannigan MD, Logan KA, Gowman L, Miranda AI, Borrego C (2010) The impact of spatial resolution on area burned and fire occurrence projections in Portugal under climate change. Clim Change 98:177–197
Christensen J, Boberg F, Christensen O, Lucas-Picher P (2008) On the need for bias correction of regional climate change projections of temperature and precipitation. Geophysical Research Letters 35:L20,709
Christensen JH, Carter TR, Rummukainen M, Amanatidis G (2007) Evaluating the performance and utility of regional climate models: The PRUDENCE project. Cli-matic Change 81:1–6
Collins M, Booth BBB, Harris GR, Murphy JM, Sexton DMH, Webb MJ (2006) To-wards quantifying uncertainty in transient climate change. Climate Dynamics 27(2-3):127–147
Coppola E, Giorgi F, Rauscher SA, Piani C (2010) Model weighting based on mesoscale structures in precipitation and temperature in an ensemble of regional climate mod-els. Climate Research 44:121–134,
Dimitrakopoulos A, Bemmerzouk A, Mitsopoulos I (2011) Evaluation of the Canadian fire weather index system in an eastern Mediterranean environment. Meteorol Appl 18:83–93
Groisman PY, et al. (2007) Potential forest fire danger over Northern Eurasia: Changes during the 20th century. Global and Planetary Change 56:371–386
Herrera S, Fita L, Fern´andez J, Guti´errez J (2010) Evaluation of the mean and extreme precipitation regimes from the ENSEMBLES regional climate multimodel simula-tions over Spain. J Geophys Res 115
Herrera S, Bedia J, Guti´errez J, Fern´andez J, Moreno JM (2013) On the projection of future fire danger conditions with various instantaneous/mean-daily data sources. Climatic Change 118:827–840
Kjellstr¨om E, Boberg F, Castro M, Christensen H, Nikulin G, S´anchez E (2010) Daily and monthly temperature and precipitation statistics as performance indicators for regional climate models. Clim Res 44:135–150
Krawchuk M, Cumming S, Flannigan M (2009) Predicted changes in fire weather sug-gest increases in lightning fire initiation and future area burned in the mixedwood boreal forest. Clim Change 92:83–97,
Krawchuk MA, Moritz MA (2010) Constraints on global fire activity vary across a resource gradient. Ecology 92(1):121–132
Lawson B, Armitage O (2008) Weather guide for the Canadian Forest Fire Danger Rating System. Tech. rep., Nat. Resour. Can., Can. For. Serv., Edmonton, Canada Littell JS, Elsner MM, Mauger GS, Lutz E, Hamlet AF, Salath E (2011) Regional climate and hydrologic change in the northern US rockies and pacific northwest: internally consistent projections of future climate for resource management. Tech. rep., University of Washington, College of the Environment,
Moriondo M, Good P, Durao R, Bindi M, Giannakopoulos C, Corte-Real J (2006) Potential impact of climate change on fire risk in the Mediterranean area. Clim Res 31:85–95
Mouillot F, Rambal S, Joffre R (2002) Simulating climate change impacts on fire fre-quency and vegetation dynamics in a Mediterranean-type ecosystem. Global Change Biology 8(5):423–437
Naki´cenovi´c N (2000) Greenhouse Gas Emissions Scenarios. Technological Forecasting and Social Change 65:149–166
Palheiro P, Fernandes P, Cruz M (2006) A fire behaviour-based fire danger classification for maritime pine stands: Comparison of two approaches. Forest Ecol Manag pp 234S, S54
Pausas J, Paula S (2012) Fuel shapes the fireclimate relationship: evidence from mediterranean ecosystems. Global Ecology and Biogeography (21):10741082 Pechony O, Shindell DT (2010) Driving forces of global wildfires over the past
millen-nium and the forthcoming century. P Natl Acad Sci USA 107:19,167–19,170 R¨ais¨anen J (2007) How reliable are climate models? Tellus A 59:2–29
San-Miguel-Ayanz J, Moreno J, Camia A (2013) Analysis of large fires in european mediterranean landscapes: Lessons learned and perspectives. Forest Ecology and Management 294:11–22
Seneviratne S, et al. (2012) Changes in climate extremes and their impacts on the natural physical environment. In: Field C, Barros V, Stocker T, Qin D, Dokken D, Ebi K, Mastrandrea M, Mach K, Plattner GK, Allen S, Tignor M, Midgley P (eds) Managing the Risks of Extreme Events and Disasters to Advance Climate Change Adaptation, Cambridge University Press, Cambridge, UK, and NY, USA, pp 109– 230
Stocks B, Fosberg M, Lynham T, Mearns L, Wotton B, Yang Q, Jin JZ, Lawrence K, Hartley G, Mason J, McKenney D (1998) Climate change and forest fire potential in Russian and Canadian boreal forests. Clim Change 38:1–13
Stocks B, Lawson B, Alexander M, Van Wagner C, McAlpine R, Lynham T, Dube D (1989) The Canadian Forest Fire Danger Rating System - An Overview. For Chron 65(6):450–457
van der Linden P, Mitchell J (2009) ENSEMBLES: Climate change and its impacts: Summary of research and results from the ENSEMBLES project. Tech. rep., Met Office Hadley Centre, Exeter, UK
van Meijgaard E, van Ulft L, Lenderink G, de Roode S, Wipfler L, Boers R, Tim-mermans R (2012) Refinement and application of a regional atmospheric model for climate scenario calculations of Western Europe. Climate changes Spatial Planning Report KvR 054/12, KNMI, TNO and Wageningen UR
Viegas D, Bovio G, Ferreira A, Nosenzo A, Sol B (1999) Comparative study of various methods of fire danger evaluation in southern Europe. Int J Wildland Fire 9:235–246 van Wagner CE (1970) Conversion of William’s Severity Rating for use with the Fire Weather Index. Information Report PS–X–21, Canadian Forestry Service, Ontario, Canada
van Wagner CE (1987) Development and structure of the Canadian Forest Fire Weather Index. Forestry Tech. Rep. 35, Canadian Forestry Service, Ottawa, Canada Weedon G, et al. (2011) Creation of the WATCH forcing data and its use to assess global
and regional reference crop evaporation over land during the Twentieth Century. J Hydrometeorol 12:823–848
Williams A, Karoly D, Tapper N (2001) The sensitivity of Australian fire danger to climate change. Clim Change 49(1-2):171–191
Winkler JA, Palutikof JP, Andresen JA, Goodess CM (1997) The Simulation of Daily Temperature Time Series from GCM Output. Part II: Sensitivity Analysis of an Empirical Transfer Function Methodology. Journal of Climate 10:2514–2532
2071-2100 2041-2070 2011-2040 1971-2000 Uncertainty y e k r u T n i a p S France tIaly BalkansGreece Portugal y e k r u T n i a p S France tIaly BalkansGreece Portugal y e k r u T n i a p S France tIaly BalkansGreece Portugal y e k r u T n i a p S France tIaly BalkansGreece Portugal y e k r u T n i a p S France tIaly BalkansGreece Portugal SSR 01 0 20 30 01 0 20 30 40 50 60 02 0 40 60 80 10 0 01 00 15 0 25 0 50 200 300 70 01 0 20 30 40 50 60 70 FWI FWI90 FOT30 (%) LOFS (days)
Fig. 4 Mean values of the fire danger indices in different countries/regions of the Mediter-ranean, for the 20C3M scenario (1971-2000) and the three future periods of the A1B emission scenario (2011-2040, 2041-2070 and 2071-2100). Vertical lines indicate the minimum and max-imum values of the four periods analysed, in ascending order from left to right. See Fig. 2 (top left panel) for country/region area definition.
15 20 25 30 35 40 45 2.6 2.8 3.0 3.2 3.4 3.6 3.8 -12 -10 -8 -6 -4 log(FWI90) log(RBA) r2= 0.58 y= 5.944x −28.038 r2= 0.34 . r2= 0.58 ** r2= 0.49 * r2= 0.84 *** r2= 0.44 * r2= 0.31 . r2= 0.65 ** r2= 0.81 *** r2= 0.28 ns r2= 0.49 * 0.000 0.001 0.002 0.003 0.004 0.005 0.006
RBA
FWI90
(a ) (b ) (c )Fig. 5 (a) Climatological mean of 90th percentile of FWI (FWI90) averaged by EU-Med
regions according to the WFDEI dataset (see Sec. 2.4) for the period 2001-2012. (b) Mean relative burned area (RBA) of each of the EU-Med regions (in ha) for the same period. (c) Relationship between (log-transformed) FWI90 and RBA. Full circles indicate the FWI90 vs. RBA means as represented in (a) and (b). Small crosses correspond to the annual values for each region (n = 10 years). Bluish symbols correspond to French regions, reddish for Italian and greenish for Greek. Dashed lines represent the regional, inter-annual linear fits (their r2 and significance are indicated using the same colors in the left-hand side of the panel). Global linear fit is indicated by the grey straight line. All data displayed correspond to the fire danger season (JJAS) and the period 2001-2012. Signif. codes: ***P < 0.001; **P < 0.01; *P < 0.05; .P < 0.1; ns, non-significant.