Construction of a high anchored wall at highway
EX-A1 (Spain)
Construction d’un mur avec ancrages dans une autoroute
A. Gómez1, A. Soriano2, E. Carrera3 and A. Soriano-Martínez41 Consejería de Fomento, Vivienda, Ordenación del Territorio y Turismo, Gobierno de Extremadura, Spain 2 Universidad Politécnica de Madrid, Madrid, Spain
3 Inco S.L., Madrid, Spain 4Ingeniería del Suelo S.A., Madrid, Spain
ABSTRACT Highway EX-A1, near the Spain-Portugal border, crosses a Tertiary formation of weak marly rocks that are affected by high tectonic stresses that had created a good number of failure planes within the rock. During the past geologic times, some large landslides had taken place. They are now covered by Quaternary soils. The design of high cuts in this type of rock formation is somewhat troublesome. The paper indicates one of the solutions that have been implemented to stabilize one of the main highway cuts.
RÉSUMÉ L’autoroute EX-A1, près de la frontière entre l’Espagne et le Portugal, traverse une formation tertiaire de roches marneuses faibles avec des contraintes tectoniques élevées qui ont provoqué de nombreuses surfaces de rupture dans la roche. Au cours des temps géologiques passés, des grands glissements ont eu lieu et ils se retrouvent maintenant couverts par des sols quaternaires. Le projet d’excavations de grande hauteur dans cette formation rocheuse est généralement problématique. L’article décrit la solution qui a été mise en œuvre pour stabiliser un des principaux déblais de l’autoroute.
1 INTRODUCTION
Highway EX-A1 has a length of about 100 km, is situated in the western part of Spain and goes from Navalmoral de la Mata (Spain) to the Spain-Portugal border. The wall described in this paper is situated near the city of Coria, at the Alagón River valley.
General geologic maps of the site indicate the presence of a deep substratum formed by metamorphic rocks (greywackes) that are covered by a thick deposit of Miocene marls.
The lowering of the course of the Alagón River, during the Quaternary times, caused large slides of the Tertiary deposits that created, within the marly rocks, a good number of sheared planes of weakness.
Quaternary deposits of soils, mostly red sandy gravels, with a considerable amount of silts and clays, are today covering the Miocene marls. The contact between Quaternary sols and Miocene marls is very irregular.
Three different geotechnical units of interest were defined for this site: the Quaternary soils, the Miocene soft rock and a “transition” formed by somewhat weathered marls.
The geotechnical report written for this area gives some geotechnical characteristics for the three different geological units previously mentioned. A summary of the main data is included in Table 1.
Table 1.- Main ground characteristics
Notes:
(1) Strength parameters are recomended design values based
(2) Strength parameters of miocene soft marls are thougth to
increase with depth. Higher values indicated in Table I would correspond to depths of about 40 m.
For the Miocene soft marls, unconfined uniaxial compression test were performed (33 data) to obtain the data plotted in Figure 1.
Figure. 1.- Compressive strength of the soft marls
Examination of the relation between the depth of the sample and the qu value indicates no a clear correlation.
Phreatic levels are, in this zone, quite high but not clearly defined. Some perched water is expected to exist. In any case, both formations (soils and soft Miocene rocks) are quite impervious.
2 CUT SLOPES ACCORDING TO THE
ORIGINAL DESIGN
The cut under consideration had a height, at the time of design, of 14 m and the cut slope defined in the original design had an inclination of 45º and horizontal intermediate berms, 2 m wide, at 5 m depth intervals.
The excavation of this cut resulted unstable. A clear scarp appeared behind the upper part of the slope and the vertical movement of the sliding mass amounted to more than 1 m near the crest of the slide. The picture included in Figure 2 was taken a few months after the failure.
A scheme of the possible failure surfaces is indicated in Figure 3.
Figure 2.- Observed failure during construction
Figure 3.- Scheme of the observed failure surfaces. Geotechnical report after sliding. Translated from the original drawing made by Rodríguez Ortiz and Rodríguez Jurado, 2010
3 BACK ANALYSIS OF THE FAILURE
After the failure, some more geotechnical investigations were carried out to further investigate the geotechnical characteristics of the reddish gravelly soils and also the Miocene soft rocks.
A somewhat larger soft weathered rocks (transition) and a somewhat lower thickness of reddish gravelly soils seem to exist at this particular point but not significant changes for the strength of this two materials were found.
The phreatic level, as was indicted previously, was difficult to be defined due to the high impermeability of these materials.
In order to explain the observed failure two main aspects of the design hypothesis had to be updated:
- The friction angle of the “transition marls” had to be lowered.
The angle of friction at the sliding surface (transition soft rock) was supposed to be about = 15º. For this strength value, the pore water pressures needed to explain the failure had to be as high as that indicated by a pore pressure factor ru = 0.25. Some other combination of these two parameters (larger
with larger ru or lower with lower ru) could also explain the failure but no easy way was found to measure pore pressure and no reasonable testing could be done on the actual strength at the failure surface due to the difficulty of testing soils at this particular location. The angle of friction used for this purposes seems reasonable for the residual strength of the low to medium plasticity clays that exist at this place.
These strength data together with the associated pore water pressure, giving a factor of safety F = 1 for the situation when actual failure took place, has been used to estimate sliding factors of safety for possible future situations.
4 DEFINITION OF A SOLUTION
Several alternatives were analyzed in order to select the most adequate to obtain the desired excavation.
The most natural solution, mostly based on flattening the excavated slope, has a clear limit. There was no possibility to extend property limits much beyond the crest of the slide.
Drainage system, on the other hand, was difficult to implement due to the low permeability of the soils and soft rocks that exist at this place.
There was a need for mechanical support by means of anchored walls. At the same time, it was considered quite convenient to place the anchored wall behind the crest of the slide so the main part of the wall would be excavated in ground that had not experienced movement during the recent sliding.
A consideration was also given to the need of reducing the volume of excavated soils since additional disposals of soils was quite difficult in the surroundings of this place.
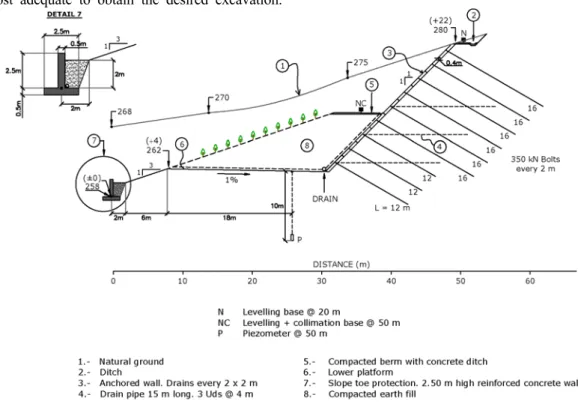
Details of this solution are given in Figure 4. They consist of:
Anchored wall with a high of 18 m. Reinforced concrete, 40 cm wide, that was to be executed as the excavation progresses.
Anchors consist of standard corrugated steel bars
32 mm, grouted to the ground and preloaded to a tensile load of 200 kN.
Perforated drains drilled into the ground behind the wall.
Concrete gravity wall at the toe of the cut.
Final fill with the product of excavations of other near cuts.
A monitoring system was designed in order to know the movements of the crest of the wall and pore pressures at some depth below the cut. A procedure to measure anchored loads was also available.
The type of expected failure, in case the ground strength is lower than that used for calculation is indicated in Figure 5. This particular situation corresponds to the phase of construction immediately before the placement of the final fill and with a water table situated at the medium expected level. For this situation, which is the more critical during construction, the resulting factor of safety, for the highest reasonable water table, is F = 1.1. For long term condition the expected factor of safety being F ≥ 1.3.
Figure 5.- Type of failure for a particular design situation
5 EXECUTION OF THE ANCHORED WALL
The staged construction procedure of the concrete anchored wall required to excavate first a wall of a height of 2 m, all along the cut. No more than 60 m of wall could be under execution beyond the place where anchors had been finished, tested and preloaded.
A new wall could be excavated underneath the previous one, again 2 m high. It should be excavated
in the same manner but it could be initiated only when the higher wall is already finish at least 10 m ahead. Those limitations of excavation are indicated in Figure 6.
Figure 6.- Sequences of anchored wall execution
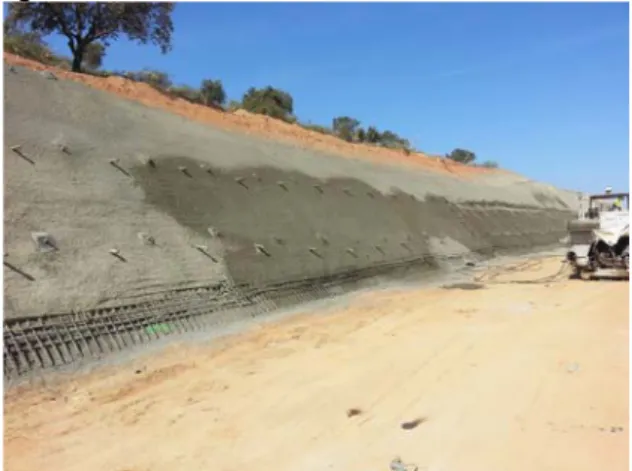
The photograph included as Figure 7 shows a view of the wall when it had a height of 4 m; that its two wall strips, each one 2 m high.
At this situation, when only the upper 4 m of the wall were finished, the excavation near the toe of the cut was initiated in order to reach the final explanation level for the highway. This was aimed to advance the general construction schedule. But this excavation reactivate the sliding of the ground between the anchored wall and the future highway as indicated in Figure 8.
Figure 7.- Anchored wall wader execution
Figure 8.- Scheme of the landslide front of the anchored wall during
construction
planes; that is, planes of weakness could exists at any depth within the marls. From this analysis, a piezometric line was obtained that is consistent with the indicated residual shear strength of the ubiquitous sliding surface ( = 15º) and with the fact that the observed slide did happened (F = 1). No more new hypothesis were needed to explain this new failure.
The review of the factors of safety of the proposed solution that was under execution indicated some lower values of the factor of safety that were not convenient. Some changes were introduced in the solution in order to consider the consequences of this sliding that took place during construction.
Two changes were made in order to improve the stability of the solution that was under execution. - Increase the length of the anchors of the two lower
rows of the wall from 12 m to 16 m.
- Substitution of the concrete wall that was to be built at the toe of the cut by a second anchored wall 4 m high built with the same procedure as the main anchored wall.
During the construction of the lower part of the main wall and during the construction of the lower anchored wall, the structure of the soft Miocene marls was examined. Figure 9 indicates a fine layered clayey stratum near a separation surface (old sliding plane) where a few millimeters thick layer of clays exist and is thought to be the cause of the initial slide of this excavation as well as the second slide that took place during the execution of the solution, front of the upper anchored wall.
Figure 9.- Detail of a fossil sliding plane
Excavations were completed with no other major incidents. Figure 10 includes a view of the situation of the walls (upper and lower anchored walls) when all excavations were finished and the final fill placement is under execution.
Figure 10.- View of upper and lower anchored valls
6 OBSERVED MOVEMENTS
Data of most interest in order to assess the stability of the cut were thought to be the movements of the anchored walls and the piezometric elevation of groundwater. In order to obtain this information, landmarks were placed along the crest of the upper and lower walls, at 20 m intervals. Some piezometers were placed within the marls, as indicated in Figure 11.
All piezometers used for this particular cut (a total of nine units) indicate pore-pressures much lower than those that could be obtained by other observations. Drains placed at the toe of the upper wall, as well as those of the lower wall, were draining some small flow of water. These observed facts indicate that the piezometric level, at the central section of the cut, should be at a position similar to the one indicated in Figure 11.
Figure 11.- Scheme of the observation of movements and pore
Movement of the crest of the upper and lower walls until the end of construction (May 2014) was less than 1 cm in any direction.
During the month of June 2014 and due to the final transitory excavations needed to prepare the highway platform, some movement took place at the crest of both walls as indicated in Figure 12, for the central section of the lower wall. For other sections movements were quite similar. The maximum observed movements are quite low and mainly due to the final excavation process.
Figure 12.- Observed movements at the central section of the lower
anchored wall
Movements are, nowadays, stabilized when all works are already finished at this place.
7 CONCLUSIONS
This paper gives some geological and geotechnical data of a site at the western part of Spain, located at the basin of the Alagón River (tributary of the well know Tajo River).
One of the cuts of highway EX-A1 failed when it was being excavated. This failure led to somewhat enlarge the geological and geotechnical data for this part of the highway.
Values of strength given in the geotechnical report written for this area were based on testing a good number of samples as well as the needed interpretation made by the rules of the good general practice that today exists in Spain for geotechnical design.
No explanation of the observed failure could be given only with the report geotechnical data. Either the
phreatic levels had to be much higher or the ground shear strength much lower.
Stability analysis made by the authors indicates that the friction angle at some pre-existing weak planes has to be about ’ = 15º, much lower than any value of strength mentioned in the geotechnical report. Furthermore these planes of weakness had to be assumed to exist at great depths in order to explain the observations of landslides that took place at this site.
A regular geotechnical report is not enough to detect these small anomalies that, on the other hand, have such a large influence on slope stability.
In order to excavate a high cut on this type of ground, the staged construction of an anchored concrete wall seems to be and adequate solution, together with a close observation of ground movements during construction.
REFERENCES
Gómez Gutiérrez, A., López Alonso, J.A. and Roncero Rodríguez, V. July 2007. Proyecto de Construcción de “Autovía Autonómica EX-A1, de Navalmoral de la Mata a Portugal”. Tramo Coria - Moraleja Este. Anejo Geotécnico.
Rodríguez Ortíz, J.M. and Rodríguez Jurado, J. November 2010.