Modelling of corrosion-induced cover cracking in reinforced concrete
by an embedded cohesive crack finite element
Santiago Guzman
3, Jaime C. Galvez
a*, Jose M. Sancho
bA B S T R A C T
Corrosion of a reinforcement bar leads to expansive pressure on the surrounding concrete that provokes internal cracking and, eventually, spalling and delamination. Here, an embedded cohesive crack 2D finite element is applied for simulating the cracking process. In addition, four simplified analytical models are introduced for comparative purposes.
Under some assumptions about rust properties, corrosion rate, and particularly, the accommodation of oxide products within the open cracks generated in the process, the proposed FE model is able to estimate time to surface cracking quite accurately. Moreover, emerging cracking patterns are in reasonably good agreement with expectations.
As a practical case, a prototype application of the model to an actual bridge deck is reported.
1. Introduction
In reinforced concrete (RC) structures, the alkaline environment of concrete (pH of 12-13) implies a passive film around the reinforcement bars that provides steel with corrosion protection. However, phenomena such as carbonatation or chloride attack may lead this film to be destroyed, once the pH drops below nine or the chloride content in the re-bar surrounding exceeds a critical value. If sufficient moisture and oxygen are available, oxidation of steel begins and rust products are gen-erated, which occupy much greater volume (about four-six times) than the original steel consumed. Subsequently, tensile forces are generated and concrete cover cracking (and eventually, spalling and delamination) appears much earlier than the point at which a significant reinforcement cross-section reduction takes place [1].
Historically, in addition to empirical approaches [17], analytical models based on the thick-walled cylinder approach have been widely used. In function of geometry, material properties and, especially, the constitutive equation for the non-linear behaviour of concrete after cracking, time to cover cracking once the corrosion process begins, is predicted. In spite of their simplicity and shortcomings [7], these models have been successfully adopted in previous works (e.g., [15,3,4,10]). For reference, certain analytical models will be presented here as well.
Nomenclature
b+ s u m of shape function gradient for nodes affected by displacement j u m p
b/(x) shape function gradient for node I c concrete cover
D diameter
D2 ideal combined diameter of reinforcement plus corrosion products, free expanded
D, initial (nominal) diameter of t h e reinforcement bar
Df diameter of t h e reinforcement bar reduced by corrosion process dc radial displacement at r = Rt + d0
d0 so-called porous zone of finite thickness around t h e reinforcement bar
E tensor of elastic moduli
Ec concrete Young's modulus
£ci concrete Young's modulus in t h e cracked zone (after cracking)
Ec2 initial concrete Young's modulus (before cracking) Eef effective concrete Young's modulus
Es steel Young's modulus F Faraday constant
fc compressive strength of concrete fa concrete tensile capacity
f[w) classical softening function for m o d e I
Gf specific fracture energy
H(x) heaviside j u m p function icor annual m e a n corrosion rate js loss of steel mass
kp rust production parameter MFE atomic weight of iron
n ionic valence n normal vector
N,(x) traditional shape function for node I pr uniform pressure on t h e re-bar
r radius
R2 ideal combined radius of reinforcement plus corrosion products, free expanded Rc radius of the crack front at which t h e tensile capacity of the concrete is reached Rt initial (nominal) radius of t h e reinforcement bar
R,* radius of the reinforcement bar reduced by corrosion process
R0 distance from re-bar centre to concrete surface s re-bar spacing
t time t traction vector
u(r) radial displacement at radius r uc radial displacement at radius r = Rc us radial displacement at radius r = R2 u' nodal displacement
w crack opening
w crack displacement vector
Wo, crack opening threshold value for crack adaptability w equivalent crack opening
Wr amount of rust products per unit length of the reinforcement generated by the corrosion process Ws amount of steel per unit length of the reinforcement consumed by the corrosion process A re-bar radius increment due to free expansion of corrosion products
e" apparent strain tensor
ec continuous part of the strain tensor
(iv ratio of volume of expansive corrosion products to the volume of steel consumed Hw ratio of molecular weight of iron to the molecular weight of the corrosion products vc concrete Poisson's ratio
vci concrete Poisson's ratio in the cracked zone (after cracking)
vc2 initial concrete Poisson's ratio (before cracking) vs steel Poisson's ratio
a stress tensor
ojj) radial stress at radius r
Offj) circumferential stress at radius r <p creep parameter
Abbreviations
CST constant strain triangle
E-FEM elemental enrichment-finite element method FE finite element
RC reinforced concrete
SDA strong discontinuity approach
X-FEM nodal enrichment-finite element method
Both of t h e m have been successfully c o m p l e m e n t e d in t h e last years by t h e application of t h e so-called Strong Disconti-nuity Approach (SDA, [25]) by means of both elemental (E-FEM) or nodal (X-FEM) enrichments. These t w o methods provide t h e s a m e qualitative and quantitative results for sufficiently refined meshes, with relative computational cost X-FEM/E-FEM growing linearly with t h e n u m b e r of modelled cracks [20]. Based on t h e E-FEM approach, an e m b e d d e d cohesive crack 2D finite element [22-24] is chosen here to analyse t h e concrete fracture process. In order to facilitate t h e localisation of t h e cracks, t h e geometric model avoids t h e classical central s y m m e t r y condition w i t h respect to t h e bar axis and a contact algo-rithm is employed to reproduce t h e oxide-concrete interface.
In addition, t h e proposed procedure does not require "crack tracking" to avoid crack locking phenomena, as in t h e cases of most SDA practical implementations. No crack continuity is enforced or crack exclusion zone defined, but a certain a m o u n t of crack adaptability within each e l e m e n t is introduced. The model has been successful w h e n applied to t h e fracture of con-crete and only requires standard properties of t h e material, measured by standardised methods.
Due to t h e particularities of t h e adopted element, some theoretical aspects will be examined before t h e exposition of an application case based on some experimental data by Liu [13].
2. Analytical m o d e l s
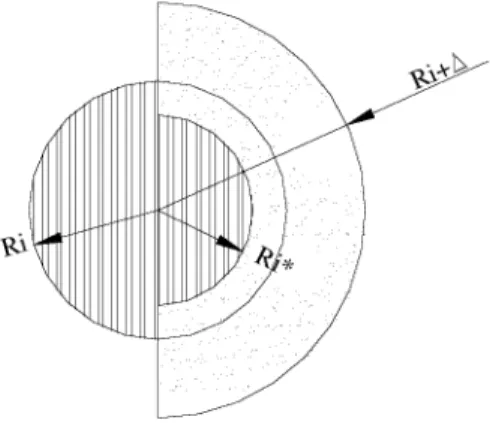
Most widely used analytical models for reproducing concrete cover cracking d u e to corrosion of t h e reinforcement bars are based on t h e thick-walled cylinder approach. According to Fig. 1, t h e internal circular boundary at t h e interface of t h e reinforcement and t h e concrete is displaced to a c c o m m o d a t e t h e expansive corrosion products [2]. The initial radius of t h e reinforcement bar is Rt and c is t h e clear concrete cover to t h e reinforcement. Rc represents t h e radius of t h e crack front at which t h e tensile capacity of t h e concrete is reached. Once Rc becomes R0 = Rt + c; t h e concrete cover is assumed to be fully cracked.
Following Liu and Weyers [15], a so-called "porous" zone of finite thickness d0 around t h e reinforcement bar is included to account for voids at t h e interface steel-concrete that allow a first diffusion of corrosion products w i t h no contribution to t h e pressure exerted on t h e concrete.
Basic assumptions are the following:
1. The corrosion process around the reinforcement bar is uniform and can be described through a radial displacement. An axi-symmetric condition is then considered.
2. For the sake of simplicity, a two-dimensional approach with isotropic materials is proposed. A plane strain formulation is employed to account for the bulk concrete of the structural element around the reinforcement bar.
3. Both the initiation and the rate (in terms of oxide production) of corrosion are known. 4. No other stresses apart from the expansion of corrosion products are considered. 5. No amount of the corrosion products accommodate within the open radial cracks.
Four analytical models are developed mainly in function of post-cracking behaviour of concrete. In spite of their simplic-ity and inconsistencies [7], they will be useful to delimitate times to cover cracking, as shown below. Appendix A provides detailed information for each model.
2.1. Model 1: linear elastic concrete
Only the concrete cylinder around the reinforcement bar is considered. The two basic parameters are Ec (Young's
mod-ulus) and vc (Poisson's ratio). With respect to the elastic modulus, generally speaking, it refers to the effective modulus,
i.e. considering a creep parameter cp, according to the expression:
E e f = ^ - ( 1 )
; 1 + (p W
This assumption is controversial when used in accelerated corrosion tests [7], though it is widely accepted in the litera-ture for describing the elastic concrete behaviour in real long term situations.
Boundary conditions are given by the displacement dc in r = R, + d0 and null radial stress in r = R0. The well-known elastic
solution yields the relation:
" ( r ) = y + - (2)
where u(r) means the radial displacement at any radius r. The constants A and B are given by:
dcR20(Ri+d0) AR20
B = TT, " —-Z 7-Vf = T?I T ^ T (3)
[^ + ( l - 2 v
c) ( i ?
i +d
0)
2] 2 ( 1 - 2 v
c)
The corresponding radial and circumferential stresses arise immediately
err(r) =
<Je{r) = ~ 1 + vc _
Ec
\
1 +v
cA K
2 ( l - 2 vc) ~ r 2
(4)
2 ( 1 - 2 vc) r
It should be noted that this is only a theoretical model with the purpose to give results for reference. Since steel is not explicitly considered, the radius increment A of the reinforcement bar equals to the sum of dc+d0.
In the inner border of the concrete block:
-Ecdc(R20-{Ri + dof)
ar(R, + d0) = -Pr = -r-. ^ - ^ — (5)
(1 + v
c) [R
20+ (1 - 2v
c)(R, + d
0)
2J(R, + d
0)
Finally, the radius of the crack front Rc at which the tensile capacity fct of the concrete is reached, is obtained as follows:
Pr
(R, + d
0f¥
0lf
ct(Rt -(R, + d
0)
2) -p
r(R,+ d
0)
The same equation is obtained by Bhargava et al. [3], but through the plane stress hypothesis
R< = \L,^ " ' 2 " ° , ^
2(
6)
2.2. Model 2: linear elastic concrete and steel
Steel and corrosion products are introduced as an only linear and elastic material defined by the parameters Es and vs. The
Fig. 2. Sketch of the corrosion process in the reinforcement bar.
and us = -R2 + R, + d0 + dc in r = R2; where R2 represents the ideal combined radius of reinforcement plus corrosion products,
i.e. the combined radius that would be reached if no restriction by the surround concrete were considered (see Fig. 2). The bar is subjected to a uniform pressure. Then:
CES
-Pr (7)
2 ( l + vs) ( l - 2 vs)
where C is evaluated immediately through pr value. This time, the radius increment A of the reinforcement bar equals the
sum of dc+d0-us, with us = C R2\2 and R2 = Rt + A. The following expression arises:
dc
R2 - {Rt + d0)
ECR2{\ - 2vs){\ + vs) R20-(R, + d0)2
(8)
•s(l + oc)(R, + d0) [Rl + (1 - 2vc)(Rt + d0)2]
2.3. Model 3: cracked concrete with no residual strength and linear elastic steel
The linear elastic behaviour of concrete is limited up to the tensile strength fct. After cracking, the residual strength of
concrete is considered null. New boundary condition appear, ae=fct in r = Rc while oy=0 in r = R0 is maintained. Due to
the fact that Rc is unknown, an additional equation is required and obtained through the conservation of volume (equivalent
to adopt a Poisson's ratio which tends to 0.5): ucRc = dc (R,+d0), where uc = ur (Rc). Therefore:
dc= - R2 - {Rt + d0)
EcR2(l-2vs)(l + vs) R20-R2)(Ri + d0)
(9)
EsRi (l+vc)(Rl+R2(l-2vc)
2.4. Model 4: cracked concrete with residual strength and linear elastic steel
This model is similar to the previous one, though it takes into account some residual strength of concrete once cracking appears. A process of tension softening is considered. The elastic modulus for concrete in zone 2 (without cracking) is main-tained equal to the original one, i.e. Ec2 = Ec; whereas, for the zone 1 (cracked zone), the secant slope of the descending branch
of the stress-strain curve defines the value of £cl.
Relation between dc and uc is as follows:
dc
where
uc
uc[R2C + (R, + d0)2(l - 2ocl)] uc{\ + i)rt)(l - 2DCI)(R20 -R2C) [(R, + d0)2 - R2C]EC2
2Rc(R, + d0)(l - ort) 2Rc(Ri + d0) [tf2 + R2C{\ - 2vc2)](1 + vc2)(l - vcl)Ecl
Rc(l + Vc2)[R2(l-2vc2)+Rl\fct
-Rl\EC2
(10)
Generally speaking, iteration procedures are required to solve the problem. A finite difference method is proposed by Pan-tazopoulou and Papoulia [21] who also take into account the anisotropy of cracked concrete. In fact, a significant shortcom-ing of the description above is treatshortcom-ing cracked concrete as an isotropic material. However, the four analytical models presented here aim only to obtain a first approach to the problem, based on their simplicity. A thorough and consistent anal-ysis is to be developed through a finite element with cohesive embedded crack, as described hereafter.
3. Finite element with cohesive embedded crack
Numerical implementation of cohesive crack model used in the present paper was performed by Sancho et al. [23]. Some basics of the finite element formulation are extracted next, with special emphasis given to crack angle orientation and adaptability.
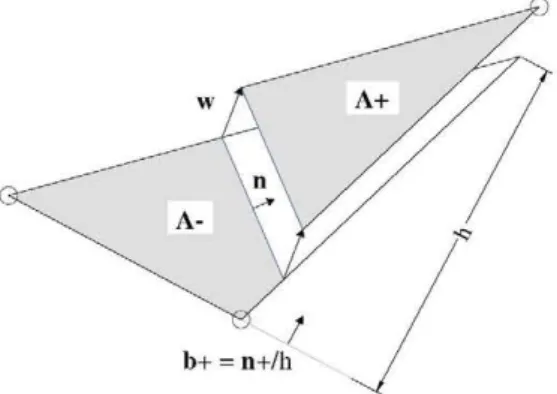
Consider an arbitrary 2D finite element, with a straight crack inside. The element is split into two sub-domains A* and A~, separated by a displacement jump w, as shown in Fig. 3, where a CST triangle is introduced.
According to the strong discontinuity approach (e.g. [19]), the approximated displacement field within the element can be written as:
u(x) = J2N,{x)u' + [H{x) - N+{x)]w (12)
(A)
where N£x) is the traditional shape function for node /, u' the corresponding nodal displacement and H(x) the Heaviside jump function across the crack plane. Moreover:
N+(*)= ]TN,(x) (13)
(leA+)
The strain tensor is obtained from the displacement field as a continuous part plus a Dirac's <5 function on the crack line. The continuous part is given by:
sc{x)=sa{x)-[b+{x)is>wf (14)
where e" (the apparent strain tensor) and b* are obtained as follows:
£fl(X) = ]T[fc,(X)®u'f
{A) (15)
ft» = ]Tft,(x)
with b£x) = gradN/(x) and superscript s indicating symmetric part of a tensor.
Regarding cohesive cracking, a simple generalisation of the cohesive crack to mixed mode is used which assumes that the traction vector t transmitted across the crack faces is parallel to the crack displacement vector w (central forces model). To address the possibility of unloading [22,23]:
tJ-Bv, (16)
where/(w) is the classical softening function for pure opening mode (Fig. 4) and w is an equivalent crack opening defined as the historical maximum of the magnitude of the crack displacement vector.
A f.
Fig. 4. Sketch of softening curve for the cohesive crack model.
Outside the crack line, an elastic and linear behaviour is assumed. The traction vector is given, from Eqs. (14) and (16), and local equilibrium t = a • n:
^ - w = £ : [sa - (b+ <g> wf] • n
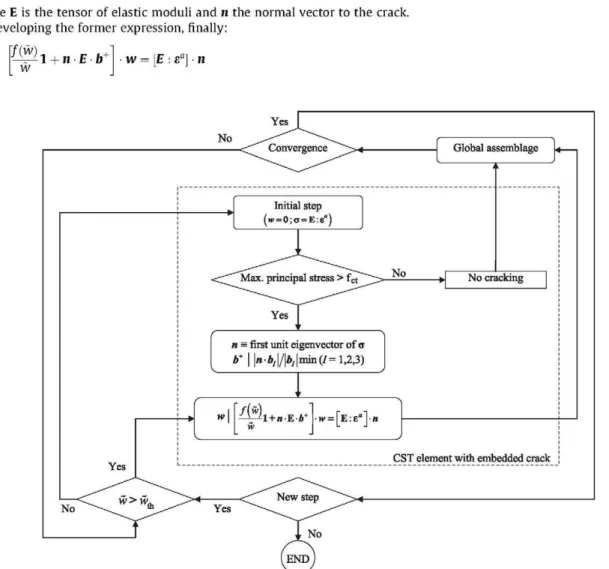
where E is the tensor of elastic moduli and n the normal vector to the crack. Developing the former expression, finally:
~/(w)
1 + n E b+ • w = \E -. sa] • n
(17)
(18)
Yes
Initial step
(w = 0;a = E:e")
n = first unit eigenvector of a b* | |«-6,|/|ft/min(/= 1,2,3)
= [E:E°]-«
Global assemblage *
-J No cracking
CST element with embedded crack
Yes
where 1 is the second order unit tensor.
This equation is solved for w using the Newton-Raphson method given the nodal displacements (and so s") once the crack is formed and thus n and b* are also given.
The process is as follows (see Fig. 5). Within each element, initially, w = 0 and linear elastic behaviour is assumed. If max-imum principal stress exceeds the tensile strength, then a crack appears perpendicular to the corresponding direction and n is computed as a unit eigenvector of a = E:sa. Limiting the analysis to CST elements, a node is selected so that the side
oppo-site to it is as parallel as possible to the crack [22,23,5]. Then, vector b* can be determined (see Fig. 3).
After solving Eq. (18), to avoid locking after a certain crack growth, the opportunity of crack adaptability within each ele-ment is provided, allowing the crack to adapt itself to the later variations in principal stress direction while its opening is small. Threshold value wth must be related to the softening properties of the material. Values around 0.1-0.2 GF//Ct, where
GF corresponds to specific fracture energy, are usually satisfactory [22,23]. Having exceeded these threshold values, crack
is considered consolidated and the crack direction becomes fixed.
The Finite Element code FEAP [26] is employed for numerical simulations. Plane strain formulation and exponential soft-ening curve are considered.
4. Application example
The numerical model should be contrasted with experimental results (refer to [12]). In the present paper, the reference will be the slab specimen L2 subjected to accelerated corrosion tests developed by Liu [13]. Table 1 summarises main exper-imental data and Fig. 6 sketches the geometry of the problem.
For the sake of simplicity, the mechanical properties of oxide products are adopted as the steel ones, in accordance with the assumption by Bhargava and Ghosh [2]. The FE model is represented in Fig. 7, with a characteristic element length in the steel-concrete interface of 0.1 mm. As remarked in Section 1, a contact element in the steel (oxide)-steel-concrete interface is necessary to localise cracking and to avoid tensile stress in the reinforcement bar [11]. A perfect sliding contact was chosen here.
Oxide production is modelled as a fictitious increment of temperature in the rebar section, as usually adopted in the lit-erature. The initial radius of steel bar Rt is reduced to R*, while corrosion products would reach a radius Rt + A if not
con-strained by concrete (see Fig. 2). As presented before, uniform corrosion around the bar is considered and the plane strain condition is taken into account. In addition, an exponential function for the softening curve with an estimated value of GF=100N/m is used.
Loss of steel mass js is related to the annual mean corrosion rate icor using Faraday's law:
Js=-MFJCO nF
where MFE is the atomic weight of iron (55.9 g/mol), n the valence of the reaction (typically, n =
be assumed here) and F the Faraday constant (96,500 C/mol).
Table 1
Experimental data of slab specimen L2 [13].
(19)
2 or 3; a value of n = 2.0 will
Parameter Symbol Value Unit
Initial rebar diameter
Clear cover to the reinforcement Rebar spacing
Annual mean corrosion rate Compressive strength of concrete Modulus of elasticity of cover concrete Tensile strength of concrete Poisson's ratio of concrete
Creep coefficient for the concrete cover
Thickness of porous zone around steel-concrete interface
A fc Ec fa Vc 9 do 16 70 200 1.79 31.5 27,000 3.3 0.18 2.0 0.0125 mm mm mm uA/cm2 MPa MPa MPa
~u~
46.5"Fig. 7. FE model of slab specimen L2 [13].
On the other hand, the amount of steel per unit length of the reinforcement consumed by the corrosion process Ws is
gi-ven by:
It is necessary to define the ratio of volume of expansive corrosion products to the volume of steel consumed \iv:
_(Di + 2A)2-Df
Developing the former expressions, the following emerges, relating t with A:
Ws ps
t(A)
7iDj's 4DJs(jiv-\) [(D
i + 2A)2-Df]
(20)
(21)
(22)
Knowing the ratio of molecular weight of iron to the molecular weight of the corrosion products fiw, the density of rust
can be evaluated through the following expression:
Pr
VwVv (23)
Then, the amount of rust products Wr equals Ws divided by jiw. The relationship between jiw and jiv, by Bhargava et al. [4],
is used here:
80
60
?
_E 40
20
0
*s£y'^
*
1
'
\
X —
f
' "
--"
I
*
1
*
2 3
t (years)
M1 - - - M 3
- X - Experimental, Liu (1996)
M2
1 M4 (Ec1=0.5Ec2; vd=0.30)
]iv = 10.60138 - 12.6787/(w + 1.50424/4 (24)
Considering a density of rust pr = 3,600 kg/m3 [15] and a steel density ps = 8,000 kg/m3; /(w = 0.5596 and /!„ = 3.9774
result.
From Eq. (19), if the amount of current icor is assumed constant (not always applicable, especially in a highly varying
aggressive environment; [6]), the rate of the loss of steel mass js and, consequently, through ^ parameter, the rate of rust
production are constant. However, some authors (e.g., [15]) consider that the rate of rust production is not unchanging but inversely proportional to the amount of corrosion products, i.e., decreasing with time. These models are based on a time-invariant parameter kp used to fit experimental data, but differing by more than one order of magnitude among the proposed
values in the literature. In this analysis, the rate of rust production is set constant and expressed by means of the Faraday's law; in order not to underestimate the rate of steel loss caused by corrosion [10].
Table 2
Correspondence between times and radial expansion due to rust production, in slab specimen L2 [13].
A{%) A(m) D2(m) Wr (kg/m) Wr(d0) (kg/m) Ws + Ws(d„)(kg/m2 t (year) 0.20
0.40 0.60 0.80
0.016 0.016 0.016 0.016
0.016032 0.016064 0.016096 0.016128
0.003871 0.007750 0.011637 0.015532
0.003024 0.003024 0.003024 0.003024
0.077 0.120 0.163 0.207
0.47 0.73 1.00 1.26
(a)
(c)
Fig. 9. Crack pattern in slab specimen L2 by FE model (in green, cracks with opening more than 0.1 mm): (a) 0.47 years; (b) 0.73 years; (c) 1.00 years; and
Additionally, a porous zone (in fact, an especially porous zone, due to voids in the steel-concrete interface) is considered to take into account that corrosion products accumulating around the reinforcement bar do not exert any pressure on the surrounding concrete until they fully fill these voids between steel and concrete. According to Liu and Weyers [15] this por-ous thickness is equal to 12.5 urn, which implies an increment in time to cracking of around 75 days, by substituting in the expression:
t(A = d0) , Psd0
"Js(/^-l)
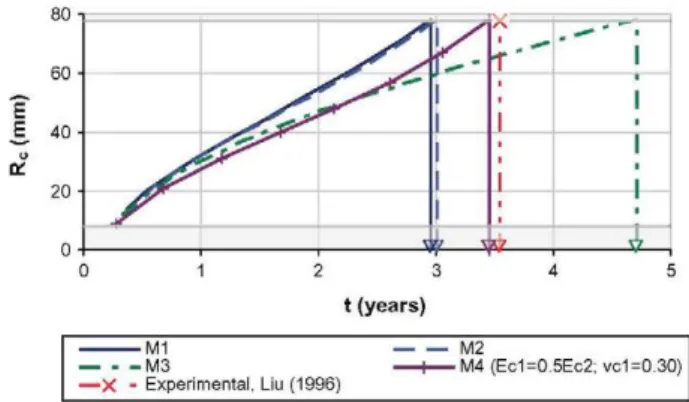
(25)As a first approach to the application example, the four analytical models presented in Section 2 are used. Input data are summarised in Table 1 and the main experimental results to reproduce are 3.54 years to cover cracking and 0.579 mg/ mm2 for the corresponding amount of steel consumed [13].
In Fig. 8 the experimental time to cover cracking is delimited by the numerical models, from 2.9 to 4.7 years. The corre-sponding values of Ws are between 0.48 and 0.77 mg/mm2, respectively. Then, in spite of their simplicity, the proposed
ana-lytical models are able to delimitate the experimental values.
As seen from Fig. 8, the predicted time to cover cracking from Model 3 is the highest one. This is because Model 3, where no residual strength is considered, implies a minimum stiffness. Conversely, both Models 1 and 2 imply a very fast transmis-sion of hoop stresses. Considering a fixed time t, Model 2 leads to a value of Rc slightly less than that predicted by Model 1,
due to external pressure on reinforcement bar, which hinders its free expansion. Finally, Model 4 appears as an intermediate case. In the figure, elastic parameters defining the cracked concrete behaviour are assumed constant. However, a smooth transition from the first values to the final ones is expected.
Hence, the main conclusions offered by Bhargava et al. [3,4] are corroborated, this time under plane strain assumption and oxide rate production linear with time.
Analytical models suppose a first simple approximation to the problem, through simplifying assumptions such as the cen-tral symmetry with respect to the reinforcement bar axis, the use of isotropic materials even under cracking and not taking into account the fill of cracked space by oxide products once the special porous zone around the bar is fully occupied.
The use of a finite element with an embedded cohesive crack model appears as a more consistent method, as indicated before. Table 2 reproduces the relationship between time (years) and radius increment A (%) and Fig. 9, the corresponding crack pattern for each time.
From Fig. 9a, the corresponding value of Rc at very early age as obtained through analytical models is confirmed. A
multi-ple diffuse crack scenario around the reinforcement bar is clearly shown. However, once some localisation of discrete cracks appears, crack patterns are progressively moving away from those expected through axially symmetric analytical models. Estimation of time to surface cracking leads to lower values than experimental ones but, once again, it must be taken into
Table 3
Parameters used for bridge deck practical case.
Parameter Symbol Value Unit
Initial rebar diameter
Clear cover to the reinforcement Rebar spacing
Compressive strength of concrete Modulus of elasticity of cover concrete Tensile strength of concrete Poisson's ratio of concrete
Creep coefficient for the concrete cover
Thickness of porous zone around steel-concrete interface Specific fracture energy
A
c s
fc Ec
fc, Vc
9 do
CF
1 6 40 200 44 31,700 3.7 0.2 2.0 0.0 110
mm mm mm MPa MPa MPa
mm N/m
(a)
(c)
(e)
(9)
(i)
Fig. 11. Upper slabs bridge deck. Cracking patterns due to rebar corrosion: (a) A = 8 urn; (b) A = 16 Lim; (c) A = 24 Lim; (d) A = 32 Lim; (e) A =40 Lim; (f)
account that no amount of corrosion products has been accommodated within the open cracks during the progress of crack-ing. In fact, steel losses indicated in Table 2 do not reach by far the experimental value of 0.601 mg/mm2. If we consider
the volume of only consolidated cracks in Fig. 9d, approximately 15 mm2 due to maximum crack width around 0.16 mm
(i.e. rust amount of 0.053 kg/m), an additional time to cracking of 3.6 years corresponds. Hence, experimental values can be tallied.
Coming back to crack patterns, as the corrosion process progresses, cracks tend to localise in the horizontal plane between reinforcement bars, in accordance with experimental results. Contrary to other application cases (e.g. [6,12]), early vertical cracks do not appear firstly on the top surface. This is due to the thicker concrete cover considered here. If concrete cover is reduced, a slightly different evolution of crack pattern arises, as shown below.
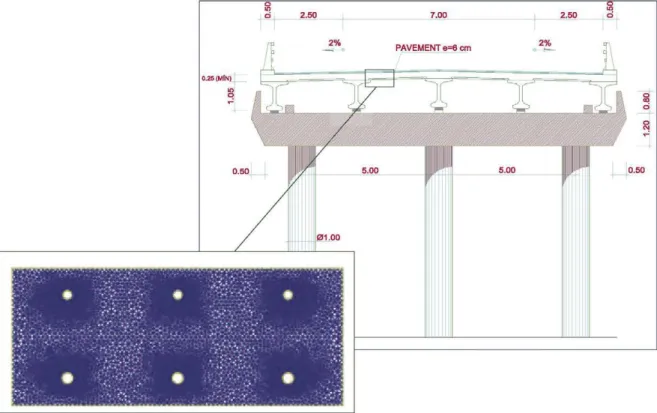
5. Upper slab in bridge deck
As a practical application of the previous model, a bridge deck upper slab exposed to chloride attack is analysed. A 2D finite element mesh is extracted from actual bridge as shown in Fig. 10. The main parameters used in the calculation are indicated in Table 3. However, service life prediction is fully dependent on two basic variables not usually precisely known: the threshold chloride concentration and the corrosion rate. Major conclusions are then referred to the achieved cracking patterns, which matches experimental results in accelerated corrosion tests (e.g. 18). In Fig. 11, cracks with width greater than 0.1 mm are shown in green. In fact, maximum width around 0.25 mm is reached in Fig. l l j .
6. Conclusions
This paper develops a corrosion-induced cover cracking model based on an embedded cohesive crack finite element. The proposed model is focused on the localisation of discrete cracks and avoids the classical assumption of axi-symme-try around the reinforcement bar. Time to surface cracking and the corresponding amount of steel loss are predicted quite reasonably, according to experimental data and based on Faraday's law. Nevertheless, it is necessary to make some assumptions about the consideration of an especially porous zone around the steel-concrete interface and, particularly, the accommodation of corrosion products within the open cracks generated in the process. Likewise, major limitations refer to the quantitative estimation of corrosion rate and the possible influence of rust mechanical properties around the steel re-bar.
Some simple analytical models, under plane strain formulation, are also presented. It is concluded that, in spite of their limitations and inconsistencies, they are useful for comparative purposes. However, the E-FEM approach provides a more robust solution, capable of being extended to real and practical cases, where complex geometries and effects such as the de-gree of confinement of the reinforcement bar, are involved. As an example, cracking patterns obtained by the application of the model to actual bridge decks match expectations. It is shown that, as the corrosion process progresses, cracks tend to localise in the horizontal plane between reinforcement bars.
Acknowledgements
The authors gratefully acknowledge the financial support for the research provided by the Spanish Ministerio de Ciencia e Innovacion under grants IPT-42000-2010-31, and DPI2011-24876.
Appendix A
A.I. Model 1: linear elastic concrete
Considering ag =fct in r = Rc, from Eqs. (3) and (4):
f Ec
h \+Vc
A B
2(1 - 2vc) ' R]
ECB
1 +VC
l r
M
+R1_
Similarly, developing oy = - pr in r = R, + d0:Ec A B
2(1 -2Vc) (j *i + d0)\ ECB
1 +VC Rl (Ri + do)2
(A.1)
(A.2)
Developing the two previous expressions:
1
£ Rl
-1 fa
Vr
1 1
R
l (Rtdo)\
(A.3)
A.2. Model 2: linear elastic concrete and steel
Radial stress compatibility between steel and corrosion products and concrete ring is achieved:
~Vr CES Ec
2 ( l + vs) ( l - 2 vs) l + vc
Eq. (3) is used again, to obtain:
_ "l 1 ~ Rl~ (R,+d0)2
A B
2 ( l - 2 vc) ~ (Ri+do)2
CES _ Ec
2 ( l + vs) ( l - 2 vs) l + vc
dcR20(R + d0)
R20 + {\-2vc){Ri + d0y
Unknown factor C is derived from compatibility of displacements:
CRy
us= — =-R2+ Rt + d0 + dc
As a consequence,
{-R2 + Rt + d0 + dc)Es Ec ((fl + d0)2- K g ) dc
R20 + {\-2vc){Ri + d0y
(A.4)
(A.5)
(A.6)
(A.7) ( l + vs) ( l - 2 vs) K2 ( l + vc) (Rt + do)
From where Eq. (8) results.
A 3 . Model 3: cracked concrete with no residual strength and linear elastic steel
In this model, radial pressure is supposed to be directly transmitted from Rc to steel and corrosion products, through
cracked concrete. Then,
~Vr CES Ec
2 ( l + vs) ( l - 2 vs) l + vc
B
2 ( 1 - 2 vc) R]
(A.8)
The second half of Eq. (3) governs, but now, as stated before, conservation of volume is employed to get a new expression:
ucRc
ARC ARi
2 +RJ C \ 2 ' 2 ( l - 2 vc) Kc R
c = dc(Ri + d0)
U n k n o w n factor A is given b y :
A = 2dc(Ri + d0)(\-2vc) R20 + (\-2vc)R2c
Combining (A.8) and (A.10) and making use again of second half of Eq. (3):
C£s Ec
2 ( l + vs) ( l - 2 vs) 2 ( l + vc) ( l - 2 vc)
1 _ ? o
Rl
2dc{Ri + d0){\-2vc) Rl + (l-2vc)R2c
(A.9)
(A.10)
( A l l )
(A.12)
from where Eq. (9) is directly obtained.
A.4. Model 4: cracked concrete with residual strength and linear elastic steel
Due to the fact that two different concrete regions are considered, compatibility of both radial displacement and radial stress is enforced at r = Rc:
Through Eq. (A.6), the former expression is developed as follows:
{-R2 + R + d0 + dc)Es _ Ecdc{R\ + dp)[Rc - R0
(1 + vs) ( l - 2vs)R2 ~ ( 1 + %)R2 fR2 + ( 1 _ 2Vc)R2
" c =
ARC B ERC E
Other b o u n d a r y conditions are given by t h e d i s p l a c e m e n t dc in r = R,+d0 a n d null radial stress in r = R0: F(K,- + d0) F
dc=
-0 =
l + vc 2
(ft + do) A _ B 2 ( l - 2 vc 2) " ^
(A.15)
(A.16)
Previous expressions allow establishing of t h e u n k n o w n factors A B, E, a n d F i n t e r m s of d i s p l a c e m e n t s uca n d dca n d geo-m e t r i c p a r a geo-m e t e r s :
^ ^
U c
~ 2 ( *
c +( l - 2 v
c 2) f i
c;
uc{\-2vc2)R2c | B fl2 + ( l - 2 vc 2) f l2 Re
Uc =
uc = E Rc (Ri+d0f\ (R, + d0)dc
uc
2 2RC ) Rc
{ucRc - {R + d0)dc)Rc | F I ? - (ft + d0)2 Rc
Then, t h r o u g h Eq. (A.14):
Fc 2 l + vc 2
" A
Kc^g^ + ( l - 2 v
c 2) ^ {r
0+ (\-2v
c2)K)R
Ed
" 1 + V c i
(A.17)
(A.18)
(A.19)
(A.20)
ucKc - (R + d0)dc (K,- + d0)dcRc - uc(R + d0) (1 - 2 vc l) (tf2 - (U, + do)2) R (R2C - (R + do)2)
(A.21) from w h e r e Eq. (10) can b e derived:
Fc 2( l + vc l) ucR2 - ucR20
R20 + (\-2VC2)R2)RC
Fci ( l + vc 2)
Finally, considering ae =fct in r = R,
-2(1 - vcl)(R, + d0)dci?c + uc(R2 + (R, + d0)2( l - 2 vc l) i?2 - ( * , + do)2 ( l - 2 vc l )i?c
/c t =
1 + vc 2
A B 2 ( l - 2 vc 2)+^
ucR2 + uci?2] (1 + vc2) i?2 + (1 - 2vc2)K2 )RC
(A.22)
(A.23)
From w h e r e Eq. (11) arises immediately.
References
Andrade C, Alonso C, Molina FJ. Cover cracking as a function of bar corrosion: part 1 - experimental test. Mater Struct 1993;26:453-64.
Bhargava K, Ghosh AK. Analytical model of corrosion-induced cracking of concrete considering the stiffness of reinforcement. Struct Eng Mech 2003;16:749-69.
Bhargava K, Ghosh AK, Mori Y, Ramanujam S. Modeling of time to corrosion-induced cover cracking in reinforced concrete structures. Cement Concrete Res 2005;35:2203-18.
Bhargava K, Ghosh AK, Mori Y, Ramanujam S. Analytical model for time to cover cracking in RC structures due to rebar corrosion. Nucl Eng Des 2006;236:1123-39.
Borja RI. A finite element model for strain localization analysis of strongly discontinuous fields based on standard Galerkin approximation. Comput Method Appl M 2000;190:1529-49.
Chen D. Computational framework for durability assessment of reinforced concrete structures under coupled deterioration processes. Ph.D. dissertation, Vanderbilt University, Nashville, Tennessee; 2006.
Chernin L, Val DV, Volkh KY. Analytical modelling of concrete cover cracking caused by corrosion of reinforcement. Mater Struct 2010;43(4):543-56. Dekoster M, Buyle-Bodin F, Maurel 0, Delmas Y. Modelling of the flexural behaviour of RC beams subjected to localised and uniform corrosion. Eng Struct 2003;25:1333-41.
Du YG, Chan AHC, Clark LA Finite element analysis of the effects of radial expansion of corroded reinforcement. Comput Struct 2006;84:917-29. El Maaddawy T, Soudki K. A model for prediction of time from corrosion initiation to corrosion cracking. Cement Concrete Comp 2007;29:168-75. Guzman S. Modelizacion del deterioro de tableros de puentes de hormigon por difusion de cloruros y corrosion de la armadura pasiva. Ph.D. dissertation, Universidad Politecnica de Madrid, Spain; 2010 [in Spanish].
Guzman S, Galvez JC, Sancho JM. Cover cracking of reinforced concrete due to rebar corrosion induced by chloride penetration. Cement Concrete Res 2011;41:893-902.
Liu Y. Modeling the time-to-corrosion cracking of the cover concrete in chloride contaminated reinforced concrete structures. Ph.D. dissertation, Virginia Polytechnic Institute and State University, Blacksburg, VA; 1996.
Liu Y, Li Y. Mechanistic model and numerical analysis for corrosion damage in reinforced concrete. Int J Fracture 2004;126:71-8.
[17] Morinaga S. Prediction of service lives of reinforced concrete buildings based on rate of corrosion of reinforcement steel. Special Report of Institute of Technology Shimizu Corporation, 23. Japan; 1988.
[18] Mullard JA, Stewart MG. Corrosion-Induced cover cracking: new test data and predictive models. ACI StructJ 2011;108(1).
[19] Oliver X. Modelling strong discontinuities in solid mechanics via strain softening constituve equations. Part 1: fundamentals. Int J Numer Meth Eng 1996;39:3575-600.
[20] Oliver J, Huespe AE, Sanchez PJ. A comparative study on finite elements for capturing strong discontinuities: E-FEM vs X-FEM. Comput Method Applied Mater 2006;195:4732-52.
[21] Pantazopoulou SJ, Papoulia KD. Modeling cover-cracking due to reinforcement corrosion in RC structures. J Engng Mech 2001;127(4).
[22] Sancho JM, Planas J, Galvez JC, Reyes E, Cendon DA. An embedded cohesive crack model for finite element analysis of mixed mode fracture of concrete. Fatigue Fract Engng Mater 2006;29:1056-65.
[23] Sancho JM, Planas J, Cendon DA Reyes E, Galvez JC. An embedded crack model for finite element analysis of concrete fracture. Engng Frac Mech 2007;74:75-86.
[24] Sancho JM, Planas J, Fathy AM, Galvez JC, Cendon DA. Three-dimensional simulation of concrete fracture using embedded crack elements without enforcing crack path continuity. Int J Numer Anal Met 2007;31:173-87.
[25] Simo JC, Oliver X, Armero F. An analysis of strong discontinuities induced by strain-softening in rate-independent inelastic solids. Comput Mech 1993;12:277-96.

![Fig. 6. Sketch of slab specimen L2 [13].](https://thumb-us.123doks.com/thumbv2/123dok_es/6719598.826054/8.816.78.755.673.1006/fig-sketch-of-slab-specimen-l.webp)