Molecular simulation is becoming a very powerful tool for studying dynamic phenomena in materials. The simulation yields information about interaction at length and time scales unattainable by experimental mea-surements and unpredictable by continuum theories. This is especially meaningful when referring to bonding between a polymer and a metal substrate. A very important characteristic of polymers is that their physical properties do not rely on the detailed chemical structure of the molecular chains but only on their flexibility, and accordingly they will be able to adopt different conformations. In this paper, a molecular simulation of the bonding between vinyl ester polymer and steel is presented. Four different polymers with increasing chain lengths have been studied. Atomic co-ordinates are adjusted in order to reduce the molecular energy. Conformational changes in the macromolecules have been followed to obtain the polymer pair correlation function. Radius of gyration and end-to-end distance distributions of the individual chains have been used as a quantitative measurement of their flexibility. There exists a correlation between flexibility of the molecular chains and the energy of adhesion between the polymer and the metal substrate. Close contacts between the two materials are established at certain points but every atom up to a certain distance from the interface contributes to the total value of the adhesion energy of the system.
Koninklijke Brill NV, Leiden, 2008
Keywords
Molecular dynamics, simulation, polymer–metal bonds
1. Introduction
Hybrid Fiber–Metal Laminates (FMLs) are materials made up of alternating layers of metal with blocks of laminated composites of polymeric matrix reinforced with fibers. Thus a multi-layered material with improved mechanical properties and in-service performance is obtained. Its density decreases when fibers and polymer are placed in between metal layers [1–3]. The material is reinforced in the preferred direction and fatigue strength is also improved due to the layered structure. More-over, it alleviates some problems to some extent, as for example fire resistance and
*To whom correspondence should be addressed. Tel./Fax: +34-91-3367159; e-mail: juancarlos.
suarez@upm.es
impact damage. Corrosion is still a problem for the first metal layer, but the compos-ite layer restrains corrosion progress deeper inside the laminate. Thus it increases durability. Moreover, impact response is also improved as compared to a composite material (metal plasticity is retained). Such improvement is due to proper degree of adhesion between the layers and an adequate interphase behavior. The manufactur-ing processes for the FMLs are not as versatile as the ones used in metal formmanufactur-ing. However, they are much more efficient than the manufacturing processes for com-posite materials, because their own metal layers are being used as the tool for the layup of the composite plies [4–6]. Fire resistance is highly superior to composite materials because polymers are encapsulated between metal layers [4].
A simulation of the bond behavior in a layered laminate made of steel alternat-ing with composite made of vinyl ester matrix reinforced with E-glass fibers usalternat-ing Molecular Dynamics (MD) has been carried out. The influence of the polymer chain length and structure on the adhesion energy is elucidated. The design, development and characterization of an appropriate interphase between the metal and polymer layers are necessary for matching the different mechanical properties of these two dissimilar materials. Otherwise, a laminated hybrid material will not properly func-tion, and this could lead to specific failure modes, such as local buckling of the metal layer.
A review on the modelling of polymeric materials can be found in [7]. A compu-tational prediction of physical properties is particularly challenging for polymeric materials, because of the extremely broad range of length and time scales govern-ing the structure and molecular motion in these materials. This challenge can only be met through the development of hierarchical analysis and simulation strategies encompassing many interconnected levels (atomistic, mesoscopic, macroscopic), each level addressing phenomena over a specific window of time and length scales. A single modelling approach cannot address all properties of interest in applica-tions.
We have focused on a particular problem: polymer-to-metal substrate interac-tions. We need to use for this purpose the methods and algorithms suitable for the length and time scales for this kind of problem, which is linked to interfacial non-bonded interaction (van der Waals and electrostatic potentials) between the atoms of the polymer and the atoms in the metal oxide on the surface. In this respect we have used a methodology similar to that used by other researchers dealing with analogous phenomena [8], in order to reproduce the macroscopic behavior of the material, as measured in laboratory tests [9–11].
in-Figure 1.Vinyl ester to steel bond.
accessibility to any kind of sensor. This is why modelling of the interphase for different molecular structures can deliver information which otherwise is impossi-ble to obtain by any other means [12].
Cohesive energy density, macromolecular packaging or localized movements in the polymer chains (causing stretch, torsion or angle deviation of the bonds), both inter- and intramolecular, are properties that can be determined by applying mole-cular modelling techniques. The improvement in the performance of the material depends on the broad understanding of how the polymer works and the possibilities of fine-tuning the mechanical properties of the interfacial region [13].
2. Molecular Models
2.1. Modelling of the Polymer
Material Studio 4.1 software (Accelrys, Cambridge, UK) has been used in this study. The first step in building the vinyl ester polymer is the modelling of the bisphenol-A monomer, wherein terminal groups of methacrylic acid have been added. Four different types of polymers have been modelled for dynamic simu-lation. They differ from one another in the length of their chains, i.e., the repeat unit (bisphenol-A monomer) varies between n=1 to n=4, as well as the initial and final groups of methacrylic acid.
to attain equilibrium as compared to the CPU time needed to relax the polymer structure when using atomistic simulation. However, when the goal is to simu-late the interfacial region development, where only the non-bonded interactions between the polymer atoms close to the surface and the metal oxide atoms are rele-vant to calculate the interaction energies, it is necessary to use an atomistic model. Coarse-graining simulation is not feasible in this case, because bead-spring models that are valid for the bulk polymer are not representative of the interfacial region of the bond. Other authors [8] have also used this atomistic modelling approach for analogous adhesion problems.
The number of monomers used to build the chains is not representative of the chain length in a real polymer. It is only necessary to model the chain ends, close to the interfacial region. Their lengths are related to the distribution of interentan-glement strand lengths in the real polymer. Only the chain segments close to the surface are involved in the adhesion phenomena, and show a remarkable mobility when they interact with the metal substrate; the rest of the chain backbones are ba-sically unperturbed beyond approximately 1 nm distance from the interface. Here we find a link between the atomistic simulation and the mesoscale modelling of the polymer, where each bead represents a Kuhn segment of the chain. The Kuhn or sta-tistical segment length (b) is related to the mean squared end-to-end distance ("R2#) and the actual length of the chain (L), byb="R2#/L[7]. The order of magnitude of this length is in accordance with the lengths we have used in the model. In other words, only one bead of the coarse-grained models is considered because this is the characteristic length of the chain segments involved in the adhesion interaction with the substrate. However, we need to use an atomistic model of this segment; it is not possible to lump all these atoms in a bead.
The molar mass between entanglements can be obtained by multiplying the Kuhn length by the molar mass per unit length of the original chain. From these descrip-tors, it is possible to obtain the packing length, which equals the ratio of the volume taken up by a Kuhn segment of the atomistic chain divided by the square of its Kuhn length. It is a measure of how “fat” a chain is in relation to how stiff it is. The sizes of the chain segments used in the atomistic models are in accordance with those proposed by other authors for similar polymers [16]. In this way, it is possible to use models involving thousands of atoms, but with a size that is still treatable using Molecular Dynamics calculations, and is meaningful to the length and time scales related to the adhesion phenomena.
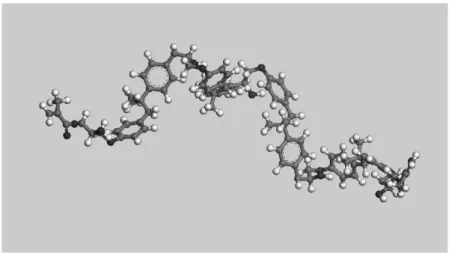
Figure 2 shows a polymer chain with four vinyl ester monomers using a mixed model (CPK-Dreiding representation). The atoms are represented by spheres with radii that are proportional to their van der Waals radius, and atomic bonds by seg-ments of proportional distances.
Figure 2.Representation of a polymer chain with four vinyl ester monomers (grey: carbon, red: oxy-gen, white: hydrogen).
Table 1.
Structural parameters of the four different polymer models used in the Molecular Dynamics simulation
c(Å) Number of Number of
chains configurations
Polymer 1 15.2 18 5
Polymer 2 15.5 12 5
Polymer 3 17.5 10 5
Polymer 4 17.6 8 5
PBCs, adjustment is made in order to attain equilibrium of the system’s density along the path. This allows for the packaging of the molecules in the periodic cell, and avoids the presence of voids (number of molecules, volume and temperature conditions are maintained constant, NVT ensemble).
A rectangular prism with edge lengthsa=26.2 Å andb=29.2 Å was chosen to build the unit cell. The value of cell parameter c (thickness direction) and the number of chains are different for each of the four model polymers, in order to obtain a density value of 0.9 g/cm3 for all of them. Table 1 shows the structural parameters of the four different model polymers used in the Molecular Dynamics simulation.
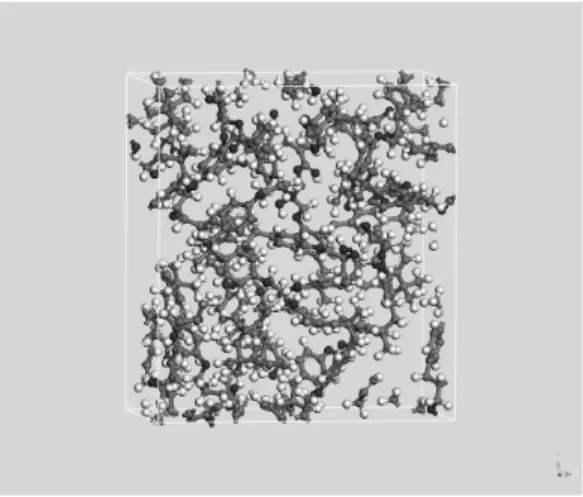
conver-Figure 3.Amorphous polymer cell (grey: carbon, red: oxygen, white: hydrogen).
gence criterion of atomic force cut-off of 0.1 kcal/mol Å, up to a maximum of 5000 iteration steps, using the Fletcher–Reeves algorithm [17]; the molecules in each amorphous cell are allowed to vibrate by NVT MD for 50 ps at 300 K; the configuration with the minimum potential energy is then selected and minimized to a convergence of 0.01 kcal/mol Å, with the conjugate gradient method.
In the simulation, velocity Verlet algorithm [18] has been used as integrator, at 300 K and time steps of 1.0 fs. For longer time steps, a collapse in the calculations can occur because different atoms tend to share the same spatial coordinates. A cut-off of 8.5 Å (based on charge neutral groups of atoms) has been used for non-bonded interactions. Figure 3 shows the minimized amorphous polymer cell corresponding ton=4.
2.2. Modelling of the Metal Surface
The first step is to model a single cell of ferrous oxide and cleave the (111) plane to obtain the interface where the interactions will take place. This plane was se-lected because it is a compact one, atomic density is maximized and interactions between the oxide and the polymer are fostered. The metal substrate is modelled and its structure is relaxed, then it is held rigid (all the atoms fixed) during the sim-ulation. Only the atoms belonging to the polymer chains are allowed to move. This is a simplification, but quite close to what happens in reality. The force field that we have used in the MD calculation is COMPASS. It is a parameterised fitted, sec-ond generation force field. It is specifically designed for non-bsec-onded interactions in condensed phase materials, and a cut-off scheme has been used in conjunction with this force field [19].
(a)
(b)
Figure 4.(a) Iron (II) oxide cell and (b) Iron (II) oxide (111) cleavage surface (red: oxygen, blue: iron).
b=29.2 Å and c=13.7 Å, for a proper fit with the polymer cell dimensions. Figure 4 shows the ferrous oxide cell and ferrous oxide cleavage surface.
2.3. Modelling of the Interface: Polymer–Metal Interaction
The polymer and the oxide have to be placed together for interaction. This requires defining a box with two layers, one for the ferrous oxide surface and the other for the polymer. The box extends along thez-direction to about 60 Å, and then padding the end of the box with a vacuum of about 30 Å length. This forces the polymer chains to interact with the metal surface that lies underneath and not with the material that is located on its top, as imposed by the PBC.
Figure 5.Box with iron (II) oxide and polymer layers (grey: carbon, red: oxygen, white: hydrogen, blue: iron).
surface, never take part in the interaction and they do not change their coordinates along the process; only a small number of them, in a narrow layer close to the inter-face, do participate in the interaction. This procedure has been followed for the four different polymers used. Figure 5 shows the box with iron (II) oxide and polymer layers.
3. Molecular Dynamics
Interaction between the two materials at the interface is simulated by 30 ps of NVT molecular dynamics calculations at 300 K. Time steps of 1 fs have been used for a total number of 3×10⁴ steps. Figure 6 shows that the temperature of the system evolves during Molecular Dynamics calculations until a constant value of 300 K is reached. Also, fluctuations of 20 K around the equilibrium temperature are present in the simulation.
The energy of interaction can be calculated by:
Figure 6.Temperature evolution of the model during Molecular Dynamics calculations.
Table 2.
Interaction energies between vinyl ester and iron (II) oxide
Polymer energy Surface energy of iron (II) Total energy Interaction energy (kJ/mol) oxide (kJ/mol) (kJ/mol) (kJ/mol)
Polymer 1 1654 −1180×103 −1179×103 −499 Polymer 2 1837 −1180×103 −1179×103 −548 Polymer 3 7291 −1180×103 −1174×103 −551 Polymer 4 7957 −1180×103 −1173×103 −997
in reality. However, interaction energy is not only related to these close contacts but to every atom located at a distance shorter than the cut-off of 8.5 Å (based on charge neutral groups of atoms) that has been used for non-bonded interactions at the interface.
4. Results and Discussion
Table 2 shows interaction energies between vinyl ester and iron (II) oxide for the four polymers modeled, as calculated using MD, using equation (1). As can be observed, the interaction energy increases with the number of monomers in the polymer chains.
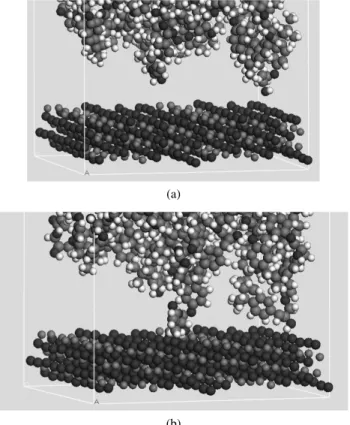
(a)
(b)
Figure 7.Conformational changes in the macromolecules after interaction with the metal surface, (a) before and (b) after Molecular Dynamics (grey: carbon, red: oxygen, white: hydrogen, blue: iron).
of bonds, involving a limited number of atoms. On the contrary, the chain becomes very rigid and cannot adopt complex conformations.
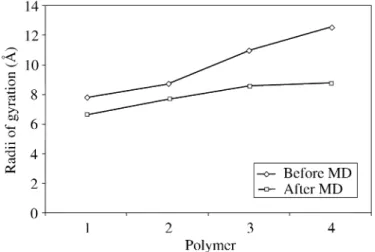
In order to quantify the capacity of molecules to adopt a more compact confor-mation, the radius of gyration (s2) in each polymer before and after the application of MD has been calculated from equation (2),
s2=
!N i=1misi2 !N
i=1mi
, (2)
wheremiis the atomic weight andsi the distance of an atom to the mass centre of
the molecule. Figure 8 shows the radii of gyration for macromolecules of increasing chain length, as predicted by Molecular Dynamics simulation. The longer the chain, the bigger the change in its radius of gyration when the polymer interacts with the metal substrate. This implies a greater flexibility for the larger chains, and an improved capacity to adapt to the surface.
Figure 8.Radii of gyration for macromolecules of increasing chain length, as predicted by Molecular Dynamics simulation.
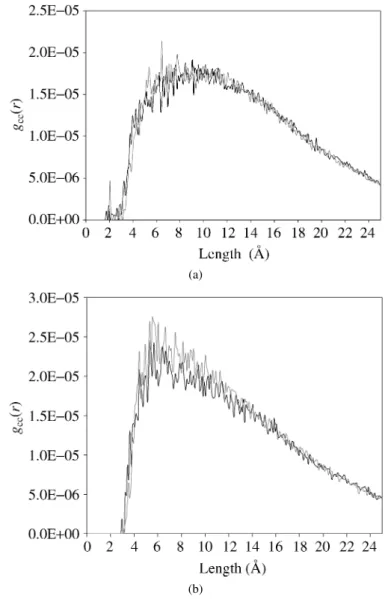
pair correlation function is useful for quantification of specific interactions among the complete set of atoms in the polymer, including chain-to-chain interactions (in-termolecular) and between pairs of atoms in the same molecule (intramolecular). We have focused on obtaining the correlation function, gαβ(&r), for inter and
in-tramolecular C–C pairs, using equation (3),
xαxβρgαβ(&r)=
1 N
"#Nα
i=1 Nβ
#
j=1
δ(r&− &ri− &rj) $
, (3)
where ρ is the density,xi is the molar fraction for every element i, Ni the total
(a)
(b)
Figure 9.Pair correlation functions before (blue) and after (red) Molecular Dynamics simulation for 1-monomer (a) and 4-monomer (b) vinyl ester polymer chains.
surface. A higher interaction energy is obtained since a greater number of polymer atoms get closer to the metal substrate, interact with the substrate (non-bonded in-teraction depends strongly on the interatomic distance), and thus get involved in the adhesion process.
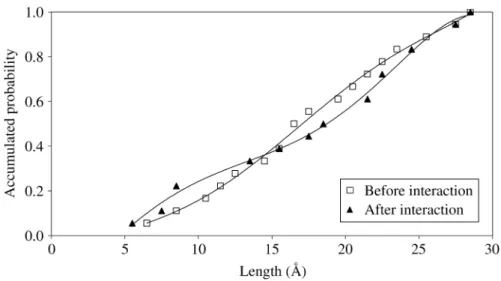
Figure 10.Accumulated probability of finding folded chains (shorter end-to-end distances) increases due to the interaction of the polymer with the metallic substrate, as predicted by MD calculations (Polymer 4).
molecules within a certain end-to-end distance range. A similar trend is found for the other polymers with different chain lengths. After the interaction of the poly-mer with the substrate, the probability of finding more folded chains increases, up to a distance of 15 Å, as predicted by MD calculations. At the same time, the accu-mulated probability of occurrence of unfolded chains (end-to-end distance of 15 Å or greater) decreases after the interaction is established. The interaction promotes, in coincidence with the observed radii of gyration and pair correlation functions, conformational changes in the chains, which fold trying to adapt themselves to the substrate. In this way, more atoms of the polymer get closer to the substrate and contribute collectively to increase the interaction (adhesion) energy of the system.
5. Conclusions
The computational prediction of physical properties in polymer-to-metal substrate interactions is a particularly challenging problem, because of the extremely broad range of length and time scales governing structure and molecular motion in these materials. Molecular Dynamics calculation of the adhesion phenomena in a vinyl ester to iron (II) oxide bond has shown that the energy of adhesion increases as the chain is longer, i.e., as the number of monomers becomes higher. Several parame-ters derived from MD simulations have been used as a means to study changes in the chain flexibility as the length of the backbone increases: pair correlation function, end-to-end distance and radius of gyration.
End-to-end distance of the chain varies as the polymer interacts with the metal surface: the polymer chains fold out to adapt themselves to the metal surface and thereby increase adhesion energy.
Radius of gyration in the polymer chains increases as the number of monomers increases. However, longer chains have greater capability for folding out on them-selves, decreasing their radius of gyration and getting closer to the metal surface. As the flexibility of the polymer chain increases, more atoms are involved in the interaction with the metal surface at the interface, which increases the energy of adhesion.
Acknowledgements
We would like to acknowledge the support from the Universidad Politécnica de Madrid through grant AM0402. Our gratitude is expressed to the laboratory techni-cal staff: Mr. José Illescas, Ms. Ana Soria and Ms. Ana García.
References
1. L. E. K. Achenie, R. Gani and V. Venkatsubramanian (Eds),Computer-Aided Molecular Design: Theory and Practice. Elsevier, Amsterdam (2003).
2. P. W. Atkins and S. R. Friedman,Molecular Quantum Mechanics, 3rd edn. Oxford University Press, Oxford (1997).
3. J. C. A. Boeyens and P. Comba,Coordination Chem. Rev.212, 3 (2001).
4. J. W. Gunnink and A. Vlot (Eds),Fibre Metal Laminates: An Introduction. Kluwer Academic Publishers, Dordrecht, The Netherlands (2001).
5. J. M. Hale and A. G. Gibson,J. Composite Mater.32, 387 (1998).
6. S. E. Hellbratt and K. A. Olsson, in:Proceedings of the Seventh International Conference on Marine Applications of Composite Materials, Melbourne (Florida), pp. 142–147 (1998). 7. D. N. Theodoru,Chem. Eng. Sci.62, 5697 (2007).
8. M. Deng, V. B. C. Tan and T. E. Tay,Polymer45, 6399 (2004). 9. D. Brown and J. H. R. Clarke,Macromolecules24, 2075 (1991).
10. D. C. Rapaport,The Art of Molecular Dynamics Simulation. Cambridge University Press, Cam-bridge (2004).
11. M. S. Sennett, S. E. Wentworth and A. J. Kinloch,J. Adhesion54, 23 (1995).
12. H. Fan, C. K. Y. Wong and M. F. Yuen, in:Proceedings of EuroSimE 2004, Brussels (Belgium), pp. 97–102 (2004).
13. J. Yin, Y. P. Zhao and R. Z. Zhu,Mater. Sci. Eng. A409, 160 (2005).
14. J. Baschnagel, K. Binder, P. Doruker, A. A. Gusev, O. Hahn, K. Kremer, W. L. Mattice, F. Müller-Plathe, M. Murat, W. Paul, S. Santos, U. W. Suter and V. Tries,Adv. Polym. Sci.152, 41 (2000). 15. F. Müller-Plathe,Chem. Phys. Chem.3, 754 (2002).
16. L. J. Fetters, D. J. Lohse, D. Richter, T. A. Witten and A. Zirkel,Macromolecules27, 4639 (1994). 17. R. Fletcher,Practical Methods of Optimization, Vol. 1, Unconstrained Optimization. Wiley, New
York, NY (1980).