12th WCTR, July 11-15, 2010 – Lisbon, Portugal
1
A MULTI-CRITERIA METHOD FOR
EVALUATING EUROPEAN TRANSPORT
RESEARCH PROJECTS
La Paix, L.Transport Research Centre,UPM , [email protected]
López-L,ME.Transport Research Centre,UPM [email protected]
ABSTRACT
Research evaluation has emerged as a ―rapid growth industry‖. Every four years more than 10 billion Euros are allocated to research projects by the European Commission through Framework Programmes. During the last ten years a large number of research projects have been addressed to evaluate other projects. However, some evaluation projects do not take a global view of the project results. The evaluation of research projects in the field of transport should be ‗quantified‘ as follows: Research activities (‗outputs‘, books, conference papers); Research community and society; Contributions to the research culture.
In this paper a methodology to evaluate research projects in the field of transport was developed, to measure the effectiveness of European transport research projects during the Fifth (1998-2002) and Sixth Framework Programme (2002–2006). The methodology begins with a selection of projects to be evaluated against a selection of indicators based on the reference framework of European Countries depending on the ‗fitness for purpose‘ regarding transport research projects during the Fifth and Sixth Framework Programme. A multicriteria analysis was applied and the analysis was divided in two parts: rank order and flag model. In fact, the combination of both methods within an integrated framework of analysis can achieve more satisfactory results. The use of our methodology enhances the level of flexibility for the decision making process. The results are divided into two parts: rank and flag model; each of these parts is evaluated disaggregated into four indicators groups. Our main findings are:
The methodology offers a set of techniques for decision-makers in order to analyse the acceptability and priority of choice possibilities in the case of qualitative or mixed data.
The main problem was the lack of follow up once the project was finished. European research projects did not produce enough publications, awareness of
project and events connected with the project.
Research evaluation should not be considered as an end in itself. Rather, it should be developed and used as a tool to key policy issues and essential questions that need to be addressed.
12th WCTR, July 11-15, 2010 – Lisbon, Portugal
2
INTRODUCTION
A large number of transport projects have been studied during the last ten (10) years. Transport projects are evaluated according to transport indicators in many research projects, in which the indicators measure partially or totally the impact of transport plans in a region.
The European Commission funded and promoted research since 1984. The 7 Framework Programmes were financed between 1984 and 2006, and between 1991-2006 the budget was 46.36 billion euros. For the present period the budget is 51 billion euros (for 7 years), which increase the importance of measuring the effectiveness of the research carried out by these projects. The present programme framework included activities to develop a methodology for assessing research transport projects.
Having looked at the state-of-the-art of the methodologies for evaluating transport research projects we recognised that there is a gap in measuring the effectiveness of research projects. A research project development is adequate when it achieves the proposed objectives, within the planned budget, human resources, and well disseminated results.
Projects evaluated in this work were recent and had to be completed. Taking into account these conditions, 2 framework programmes were selected: FP 5 and FP 6. The Fifth and Sixth Framework Programmes (FP-5 & FP-6) set out the priorities for the European Union's research activities, technological development and demonstration (RTD) activities for the period 1998-2006.
PREVIOUS RESEARCH
The subject of this work is the scientific evaluation of transport project research. The literature review is divided into two main topics: scientific evaluation and multi-criteria assessment methods.
Scientific evaluation
12th WCTR, July 11-15, 2010 – Lisbon, Portugal
3
assess the process to achieve these results. According to early studies (Patton, 2002) evaluation differs from evaluation research in that evaluation examines and judges accomplishments and effectiveness; and, when the examination of effectiveness is conducted systematically and empirically through careful data collection and analysis, one is engaged in evaluation research.
The social facet of evaluation is clearly highlighted in some studies (Chen & Rossi, 1992; Chelimsky & Shadish, 1997). Chelimsky & Shadish (1997) emphasise the social research viewpoint of evaluation research. Similarly, in another study, defined evaluation as ―the systematic application of social research procedures in assessing the conceptualization and design, implementation and utility of social intervention programs‖ (Rossi & Freeman, 1985).
Definitely, evaluation is based on outcomes and effects, and the process to achieve these outcomes. There are several approaches to outcomes; this variety is given by each discipline. But, in general words outcome is the concrete product arising from research findings. And, effects are the extent to which the impacts of a programme, policy or organisation have promoted the achievement of set goals, either general or specific (Nagarajan &Vanheukelen. 1997; Metronome Consortium, 2009)There are only a few number of projects that evaluate scientific research. In the report of the METRONOME project (Metronome Consortium, 2009) two dimensions were included: the retrospective dimension which is often highlighted in the evaluation definitions; and, the knowledge production for the basis of future activities e.g. policy or strategy design, or research orientation.
Regarding the production of knowledge, the Organisation for Economic Co-operation and Development (OECD) (Organisation for Economic Co-operation and Development (OECD), 2007) studied the evaluation of scientific research in a number of countries: France, Germany, Belgium, Finland, The Netherlands and United Kingdom and others. They found that traditional research evaluation tended to put more emphasis on publication counting, neglecting multidisciplinary outcomes, such as scientific network, management development, and other impacts on all functions of the institution. There is a need for multiple approaches to evaluation. The results showed that evaluation of research at the institutional level should include the evaluation of multiple functions: teaching and training, knowledge transfer to the other social and economic sectors, international connectivity, and impacts on the broad national - and international- culture.
12th WCTR, July 11-15, 2010 – Lisbon, Portugal
4
Other studies (Kaukonen. 1997a) suggest that evaluation should quantify and qualify (using figures and data when needed) and should build on qualitative accounts in order to make the numbers meaningful. For example, quantify scientific output by analysing publications and citations or articles; this is also called ‗bibliometrics‘. Some criticism was made about ‗bibliometrics‘ analysis, because it is not regarded as a suitable technique in social and economic fields. Besides ‗bibliometric‘ analysis may not give enough weight to new studies if they have not attracted sufficient attention. Despite of this ‗bibliometrics‘ has been increasingly applied to research evaluation in recent years (Luukkonen. 1990)
The literature review shows a gap in the field of evaluation of scientific research against sustainable objectives in the field of transport research projects. This evaluation should connect: objectives, outcomes, effects and the process to achieve these outcomes and effects. The present study focuses on these four factors, and analyse them using a multi-criteria framework. Objectives, in the present analysis, are considered as the objectives of the transport research projects (scientific impact). Outcomes are publications and answered questions from the transport research project (social and scientific impact). Effects are the benefits of the research to the end-users, to society in general and to scientific community (utility and social impact). The process to achieve these outcomes and effects, are management and coordination activities performed to complete project (management impact).
How to measure the evaluation: Multi-criteria analysis
Commonly, transport decisions follow a standard framework, that of Cost Benefit Analysis (CBA), which already has a long history in the evaluation of transport projects. Following this idea, the evaluation of transport research projects would be within the same framework. But, the question is: how to assess economically the social participation in transport research projects? Since sustainable development is a concept composed by more than one factor, an adequate evaluation corresponds to a multicriterion decision, not just the economic assessment from Cost Benefit Analysis (CBA).
In the past, decision support and evaluation methods were based on the limited approach provided by the economical analysis. Other methods have been developed over the past years to complement the conventional CBA. Nowadays, the concept of Sustainable Development is used for evaluating non-priced and qualitative effects. Sustainable Development is a qualitative policy concept, which needs a quantitative operationalization. Operationalization means that ―the process could be equally used for one region or another‖. Sustainability is a multidimensional concept, which requires a multidimensional evaluation technique.
12th WCTR, July 11-15, 2010 – Lisbon, Portugal
5
in the present study social and economic aspects of sustainability are approached with ordinal scales. Methodological process is described in the next sections.
Some authors used multi-criteria analysis in the evaluation of transport projects (Capron, 1997; Grant-Muller et al. 2001). Nijkamp et. al (1997) analyzed the sustainability of transport systems using a strategic scenario approach. They developed a multi-criteria methodology for sustainable transport scenarios, called The Spider Model. This model is used to analyze scenarios of the future transport system, which is supposed to be the result of forces and developments in four fields: spatial, institutional, economic and social/psychological aspects. Another method used is the Flag Model (Nijkamp &Ouwersloot. 1997). This method is a helpful tool to assess the sustainability of various scenarios by quantitative, but indicative, comparison of these scenarios. For a more exact comparison, multi-criteria techniques have to be applied. Therefore, the main purpose of the Flag Model is to limit the number of feasible (in sustainability sense) alternatives. The flag model becomes more useful when a large number of indicators are involved and visual inspection of impact matrices is not possible.
More recently, Vreeker et al (2002) applied multi-criteria methods to a strategic decision making in the transport sector. This paper offered a framework based on three types of approaches: Regime Analysis, Saaty method and Flag Model.
In the light of recent studies on theoretical aspects or thinking about data, Medda and Nikjamp (2003) used a combinatorial assessment methodology where they assume that no single method is exhaustive per se. Thus different assessment methods can be combined to overcome limitations of the singular method in order to design more flexible evaluation methods. To achieve this they used the regime analysis and cost benefit analysis.
In this sense, a recent study recommended multi-criteria methods, specifically the flag model and regime analysis, to evaluate urban transport mobility plans (La Paix & Lopez-Lambas, 2008), they included four indicator categories: social participation, transport demand indicators, transport supply indicators and externalities (fatalities, emissions, congestion and so on). The Flag model is the method applied in the present work.
As concluded by Nijkamp & Ouwersloot (1997) the following components should be present in the Flag model:
Identify a set of measurable sustainability indicators, Establish a set of normative reference values,
12th WCTR, July 11-15, 2010 – Lisbon, Portugal
6
As the literature review shows, there are important steps in the field of transport evaluation using multi-criteria assessment. However, evaluation of scientific research in the field of transport has received less attention. Furthermore, evaluation of transport research projects applying multi-criteria methods is something quite new. Any other study, at least to our knowledge, developed a multi-criteria framework to measure scientific research, based on two methods, and included the elements of the present work.
In general, the present study uses the Regime Analysis and Flag Model to construct the framework of the methodology. In order to achieve this, a set of indicators are selected but, the main problem in operationalization is the lack of specificity. Sometimes it is difficult to measure many indicators or is not quantitative. Because of this the present work uses a qualitative scale. Another limitation, also taken into account, is the necessity to define weights for each criterion. The procedure of the weight definition is conducted by ‗experts‘, and the subjectivity of this process is avoided with a sensitivity analysis. The next section contains the key issues of the methodology followed in the present work.
METHODOLOGY
Regime analysis
The Regime analysis is a discrete multi-assessment method suitable for assessing projects as well as policies. The main advantage of this method is that it is capable of working with mixed data (ordinal, scale, ratios and categorical data). The fundamental framework of this method is based on two parts: the input matrix and a set of weights. The input matrix is composed by the indicators selected in order to measure the effect of projects. In this case, the multi-criteria analysis is based on the assumption that input matrix is composed by four main criteria:
Scientific impact indicators. These indicators should reveal the quality and validity of research projects against the project‘s objectives and FP theme targets. i.e. number of publications, number of patents, fit between framework and data, etc.
End user impact indicator (Utility), indicate benefit of the research results to their actual end users.
Social impact indicators, represent outcomes of the research to the society, end users and policy implementations.
12th WCTR, July 11-15, 2010 – Lisbon, Portugal
7
These main criteria are formed by sub-criteria or indicators. The set of weights were selected based on a sensitiveness analysis. This analysis was carried out looking for significant influence of one factor. There are 3 types of scenarios:
Balanced: two balanced scenarios are presented. In the first one all indicators are equally weighted. Since there are 19 questions, each question weight 1/19= 5.26%. In the second one, each one of the four groups indicators weight 25%, since the number of questions by groups of indicators is different, each question weights differently, i.e. scientific group- 5 questions, each question weights 5%.
Intermediate: in this analysis one group of indicators was weighted 50% and 50% is distributed within the other 3 groups of indicators. Four types of intermediate scenarios are calculated: Scientific 50%, Utility 50%, Social 50% and Management 50%.
Extreme: in those scenarios one group of indicators was weighted 100%. And remaining groups are not weighted. Four types of extreme scenarios are calculated. Scientific 100%, Utility 100%, Social 100% and Management 100%.
The process of flag model multi-criteria analysis
A multiple criteria analysis was developed as follows:
1. Estimate total scores: The total scores are produced from weights of balanced scenario and the likert scale detailed below. After this process the points are summed and the total score by questionnaire is obtained. Since the method for the questionnaires was the five-level psychometric scale called Likert scale (Likert. 1932): 2 positives, 2 negatives and 1 neutral point- the points or values for the 19 questions in the questionnaire are from 0 to 5. In this part a statistical analysis is carried out because it is important in the sample exploration and characteristics description.
2. Multi-criteria assessment: we used a multiple criteria methodology similar to Flag Model where the values obtained in each indicator are compared with reference values called Critical Threshold Values (CTV). Each indicator should have a CTV because this indicator belongs to a group or category.
12th WCTR, July 11-15, 2010 – Lisbon, Portugal
8
the maximum value of the group as the maximum threshold. Likewise the lowest value obtained is the minimum threshold.
4. Category Assignment: category is defined by arrows and colours, which are explained as follows.
Green: if the project scored more than the CTV maximum, adequate performance.
Yellow: if the Project scored the CTV intermediate, possible problems to solve.
Red: if the Project scored less than CTV minimum, problems to solve .
5. Frequency of flags and evaluation of the acceptability: In this part projects are compared and also ordering the groups of indicators. The Flag Model method is a potential graphical representation of different approaches in a qualitative manner. To achieve better results the indicators should be in the same scale or standardized.
RESULTS
Sample Characteristics
A questionnaire of 19 questions was delivered by e-mail to 49 participants: researchers, project coordinators, project officers, consultants and others. Others
refers to researchers involved in projects and recommended people. A total of 16 projects from 29 were received, a response rate 51% (28 answers/54 mails). The answers were collected during a period of 45 days, between October-November 2008.
As Table 1 shows, sample size is rather well-balanced for Framework Programme, FP-5 and FP-6. Due to this condition, the conclusions could be fitted further. Analyzing Table 1, we observe more participation from universities and research centres, which means that universities were more likely to complete the survey than other groups, inducing ‗little‘ bias that should be highlighted on the results. Similarly, by mode (mode of transport and type of infrastructure), there are more replies listed under the heading
Road. According to the Scale the number of responses for urban projects was higher than for others.
Table I Sample Characteristics
Category Responses % of Total
Framework Programme
5th Framework Programme 14 50%
6th Framework Programme 14 50%
12th WCTR, July 11-15, 2010 – Lisbon, Portugal
9
Consultancy 4 14%
University 10 36%
Transport industry 2 7%
Research Centre 10 36%
Other 2 7%
Financial Instrument/FP
5th Framework Programme
No contract type 2 7%
Study contracts, assessment contracts 1 4%
Cost-sharing contracts 5 18%
Research and technology development projects
3 11%
Thematic Networks, Concerted Action 1 4%
Accompanying measures 2 7%
Total FP-5 14 50%
6th Framework Programme
Coordination action 8 29%
Specific Targeted Innovation Project 1 4%
Integrated project 4 14%
Networks of Excellence 1 4%
Total FP-6 14 50%
Transport mode
Road 16 57%
Multimodal 11 39%
Marine 1 4%
Project Scale
Interurban 16 58%
No data 1 4%
Urban 11 38%
12th WCTR, July 11-15, 2010 – Lisbon, Portugal
10
Figure I– Sample Characteristics. Part I
Figure II– Sample Characteristics. Part II
Application of Regime Analysis: Rank-order of projects
The Regime Method allows to analyse an impact matrix containing mixed data and weight vector in order to calculate a rank-order of projects. The weights may be assumed to be 0.25 by group of indicators, but also alternative weight compositions can be handled by means of the sensitivity analysis.
14 14 4 10 2 10 2 0 5 10 15 20 25 30
5th 6th Consultancy University Transport industry
Research Centre
Other
Framework Programme Area
Sample Characteristics
FP AREA Total
2 1 5 3 1 2 8 1 4 1 16 1 11 0 5 10 15 20 25 30 N o c o n tr a c t ty p e S tu d y c o n tr a c ts , a s s e s s m e n t c o n tr a c ts C o s t-s h a ri n g c o n tr a c ts R e s e a rc h a n d t e c h n o lo g y d e v e lo p m e n t p ro je c ts T h e m a ti c N e tw o rk s , C o n c e rt e d A c ti o n A c c o m p a n y in g m e a s u re s C o o rd in a ti o n a c ti o n S p e c if ic T a rg e te d I n n o v a ti o n P ro je c t In te g ra te d p ro je c t N e tw o rk s o f E x c e ll e n c e In te ru rb a n N o d a ta U rb a n
Contract Type Scale
Sample Characterístics
12th WCTR, July 11-15, 2010 – Lisbon, Portugal
11
The Regime Analysis was conducted in two steps. First, a Regime Analysis was performed on each of the main classes (management, Social, Scientific and Utility). By means of the values of each project score on the sub-criteria, the scores for each main class were determined. These results are presented as the intermediate results in Table . In the second step the intermediate results formed the input, together with the
weight vector (25% for each group of indicators: economic, social, utility and scientific), for a final Regime Analysis. The results of this analysis are presented in Table 3. Assuming a list of J project scores organized from high to low, the lowest score is the project number J, and the highest score is the project J=1
Four rank order – intermediate results- compose the final result: scientific, utility, social and management. Each one comes from the standardization of the score by project; the following equation was applied:
Project Rank is estimated by group of indicators.
Equation 1. Project Rank Estimation
Where:
is rank number for the project on the indicator )
is the difference between the score of the project ( PSc) and the lowest value in the list ( );
is the difference between the maximum ( ) and the lowest value ( ) in the list of projects for the indicator .
Consequently, final results are the weighted sum of 25% of each group of indicator rank based on the following equation:
Equation 2
where
12th WCTR, July 11-15, 2010 – Lisbon, Portugal
12
Table II Rank Order of Intermediate Results
Rank (1-17)
Scientific (Rank Indicator)
Project Rank
(1-17)
Utility (Rank Indicator)
Project Rank
(1-17)
Social (Rank Indicator)
Project Rank
(1-17)
Management (Rank Indicator)
Project
1 1.00 ROSEBUD 1 1.00 MARNIS 1 1.00 Other 1 0.77 CITYMOBIL
2 0.80 MARNIS 2 0.92 CITYMOBIL 2 0.88 CITYMOBIL 2 0.77 D2D
3 0.80 Other 3 0.91 Other 3 0.83 SIMTAG 3 0.65 Other
4 0.80 SIMTAG 4 0.86 IMAGINIT 4 0.75 HUMANIST 4 0.65 ROSEBUD
5 0.74 CITYMOBIL 5 0.77 EQUIP 5 0.75 IMAGINIT 5 0.58 PROSPECTS
6 0.73 STEPS 6 0.77 SUMMA 6 0.67 MARNIS 6 0.57 STEPS
7 0.69 PROSPECTS 7 0.73 SIMTAG 7 0.67 RESPONSE3 7 0.54 HUMANIST
8 0.67 EQUIP 8 0.64 RESPONSE3 8 0.67 ROSEBUD 8 0.54 RESPONSE3
9 0.66 IMAGINIT 9 0.59 TRANSFORUM 0.62 Average 0.46 Average
0.61 Average 10 0.56 PROSPECTS 9 0.60 TRANSFORUM 9 0.42 MARNIS
10 0.61 TRANSECON 0.55 Average 10 0.58 PREVAL 10 0.42 TRANSECON
11 0.55 TRANSFORUM 11 0.55 HUMANIST 11 0.58 PROSPECTS 11 0.34 TRANSFORUM
12 0.54 RESPONSE3 12 0.50 PREVAL 12 0.58 ROLLOVER 12 0.31 PREVAL
13 0.48 HUMANIST 13 0.50 ROSEBUD 13 0.58 TRANSECON 13 0.31 SIMTAG
14 0.41 PREVAL 14 0.41 D2D 14 0.52 STEPS 14 0.19 IMAGINIT
15 0.41 SUMMA 15 0.36 TRANSECON 15 0.50 EQUIP 15 0.19 ROLLOVER
16 0.34 D2D 16 0.28 STEPS 16 0.38 D2D 16 - EQUIP
12th WCTR, July 11-15, 2010 – Lisbon, Portugal
13
Table III Rank Order of Final Results
Rank (1-17)
Project FP Financial Instrument Final Result1
Other FP-5 - 0.842
CITYMOBIL FP-5 Integrated project 0.833
MARNIS FP-6 Integrated project 0.724
ROSEBUD FP-6 Thematic Networks, ConcertedAction
0.71
5
SIMTAG FP-5 Research and technologydevelopment projects
0.67
6
IMAGINIT FP-5 No contract type 0.627
PROSPECTS FP-5 Cost-sharing contracts 0.608
RESPONSE3 FP-5 Specific Targeted InnovationProject
0.60
9
HUMANIST FP-6 Networks of Excellence 0.58Average 0.55
10
STEPS FP-6 Coordination action 0.5311
TRANSFORUM FP-6 Coordination action 0.5212
TRANSECON FP-6 Accompanying measures 0.4913
EQUIP FP-5 Study contracts, assessmentcontracts
0.49
14
D2D FP-5 Research and technologydevelopment projects
0.47
15
PREVAL FP-5 Integrated project 0.4516
SUMMA FP-6 Accompanying measures 0.3817
ROLLOVER FP-5 Cost-sharing contracts 0.2612th WCTR, July 11-15, 2010 – Lisbon, Portugal
14
Figure III Rank Order of Final Results by FP
Figure III shows the Rank Order of Final Results separated by FP. The figure indicates the average for FP-5 at 0.53 and FP-6 at 0.58. In FP-5 there are 5 projects above the average, while in FP-6 there are 3 projects. This figure shows that the highest Rank in FP-5 (0.84) is greater than the highest Rank in the FP-6 (0.83); but the lowest Rank in FP-5 (0.26) is much lower than the lowest Rank in FP-6 (0.45). There is no clear evidence of a relationship between FP and Rank order.
An advantage of the Rank Order is that the method does not penalize projects by the total score, the method take into account the variability of the sample. This method becomes useful to compare projects within small sample sizes.
Application of Flag model: acceptability of Projects
The decision-making process of European projects against the effectiveness of the research should be based upon a broad set of criteria; which allows the simultaneous consideration of a project impact from different view points: scientific, social , utility and management. A list of indicators should be defined for each criteria. Indicators are summarised according to their main types and used as input for the Flag Model.
The various data of indicators (sub-criteria) are measured on a 5-point scale. The highest value represents the best score and for each group correspond one maximum and one minimum. In this matrix the weights were obtained from the sensitivity analysis.
0.84
0.71 0.67
0.62 0.60
0.49 0.49 0.47 0.38
0.26 0.83
0.72
0.60 0.58
12th WCTR, July 11-15, 2010 – Lisbon, Portugal
15
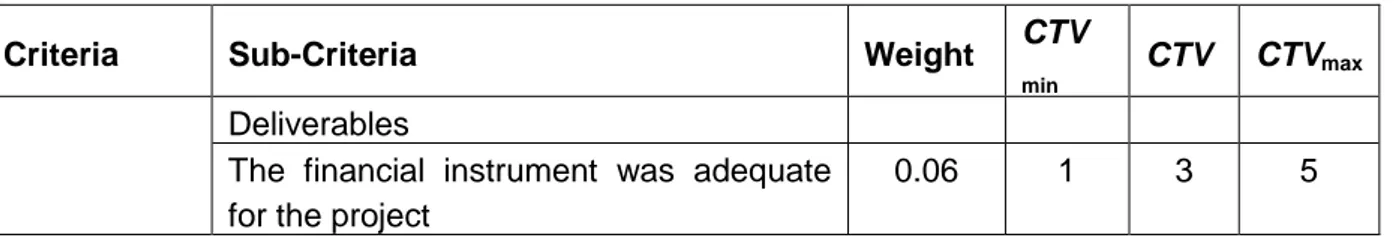
Table IV Critical Threshold Values
Criteria Sub-Criteria Weight CTV
min
CTV CTVmax
Scientific The research goals required specific elaboration at the start of the project
0.05 1 3 5
There were theoretical difficulties in defining the research methodology
0.05 1 3 5
The research objectives were all met 0.05 1 3 5
The research budget and human
resources available were insufficient
0.05 1 3 5
The project results have been
adequately published in scientific journals and/or books
0.05 1 3 5
The project results have been transferred into policy initiatives, recommendations and/or regulations
0.04 1 3 5
Utility Needs and views of end-users were taken into consideration
0.04 1 3 5
Civil servants and/or policy makers were involved in the project
0.04 1 3 5
Transport operators or service sector were involved in the project
0.04 1 3 5
Transport industry sector was involved in the project
0.04 1 3 5
The project raised new unsolved research questions
0.04 1 3 5
The project results have been
adequately disseminated to end-users
0.04 1 3 5
Social The project webpage was user-friendly and updated regularly
0.08 1 3 5
The project encouraged the participation of society in research (development of awareness campaigns, public inquiries, etc.)
0.08 1 3 5
The project (consortium) has improved networking between researchers and public/private organisations
0.08 1 3 5
Management The consortium members have gathered a stable research network
0.06 1 3 5
The project included too many
consortium meetings and Workshops
0.06 1 3 5
Additional effort should be made to reduce the extension of project
12th WCTR, July 11-15, 2010 – Lisbon, Portugal
16
Criteria Sub-Criteria Weight CTV
min
CTV CTVmax
Deliverables
The financial instrument was adequate for the project
0.06 1 3 5
The use of CTV is related to a normative view of the concept of sustainability where more attention is paid to the question of how sustainability can be identified as a normative orientation for policy. In other words, the question is: Is it possible to define a set of reference values or CTVs (limits, standards or norms) to trace and evaluate the impacts of policies and infrastructure projects on the society?.
Table V Frequency of Flags
FLAGS Sub-Criteria
Total
NAME Criteria Green Yellow Red
EQUIP Utility 5 1 0 6
Social 1 1 1 3
Scientific 4 2 0 6
Management 1 0 2 3
Total EQUIP 11 4 3 18
HUMANIST Utility 3 0 3 6
Social 2 1 0 3
Scientific 4 0 2 6
Management 3 0 1 4
Total HUMANIST 12 1 6 19
IMAGINIT Utility 6 0 0 6
Social 3 0 0 3
Scientific 3 0 2 5
Management 2 0 2 4
Total IMAGINIT 14 0 4 18
MARNIS Utility 6 0 0 6
Social 1 2 0 3
Scientific 6 0 0 6
Management 1 3 0 4
Total MARNIS 14 5 0 19
PREVAL Utility 3 2 1 6
Social 1 1 1 3
Scientific 2 3 1 6
Management 2 1 1 4
Total PREVAL 8 7 4 19
RESPONSE3 Utility 3 2 1 6
Social 2 0 1 3
12th WCTR, July 11-15, 2010 – Lisbon, Portugal
17
FLAGS Sub-Criteria
Total
NAME Criteria Green Yellow Red
Management 3 0 1 4
Total RESPONSE3 13 3 3 19
ROSEBUD Utility 3 0 3 6
Social 2 0 1 3
Scientific 6 0 0 6
Management 3 0 1 4
Total ROSEBUD 14 0 5 19
SIMTAG Utility 4 2 0 6
Social 3 0 0 3
Scientific 4 2 0 6
Management 2 1 1 4
Total SIMTAG 13 5 1 19
SUMMA Utility 4 2 0 6
Social 1 0 2 3
Scientific 1 5 0 6
Management 0 1 2 3
Total SUMMA 6 8 4 18
The results in the table above show that projects MARNIS, ROSEBUD and IMAGINIT are generally most acceptable/ sustainable; they have 6 green and 0 yellow flags. Most of these flags are scored on the utility and scientific factors. HUMANIST project is not an option, since it is not utility viable, because of the 3 Red Flags on the utility indicators. In the long term it may be expected that the economic and scientific consequences of current projects become negative. There is a possible cause-effect relationship between utility and scientific. Consequently, when the utility is red the scientific will also be red. On the basis of utility definition, as a measure of the extent to what the results correspond with the problems to be addressed, we can link it as follows: if the project methodology is not adequate, the fundamental problem could not be solved.
Table VI Results of the Rank Order and the Flag Model
NAME RANK Scientific Utility Societal Management
Other 1 Green Green Green Green
ROSEBUD 2 Green Green Green Green
SIMTAG 3 Green Green Green Yellow
IMAGINIT 4 Green Green Green Red
PROSPECTS 5 Green Green Green Green
PROSPECTS 5 Green Red Red Green
PROSPECTS 5 Green Green Green Green
TRANSECON 6 Green Red Green Green
EQUIP 7 Green Green Yellow Red
12th WCTR, July 11-15, 2010 – Lisbon, Portugal
18
D2D 8 Green Green Green Green
SUMMA 9 Yellow Green Red Red
ROLLOVER 10 Red Red Green Red
ROLLOVER 10 Red Red Green Red
CITYMOBIL 11 Green Green Green Green
CITYMOBIL 11 Green Green Green Green
MARNIS 12 Green Green Green Green
RESPONSE3 13 Green Green Green Green
HUMANIST 14 Green Green Green Green
STEPS 15 Green Red Red Green
STEPS 15 Green Red Green Green
STEPS 15 Green Red Green Green
STEPS 15 Yellow Red Yellow Green
TRANSFORUM 16 Green Green Green Green
TRANSFORUM 16 Green Green Green Yellow
TRANSFORUM 16 Green Green Green Yellow
TRANSFORUM 16 Green Green Green Red
PREVAL 17 Yellow Green Green Yellow
Table VI shows the results of the Rank Order and the Flag Model by project. In some projects we had more than one questionnaire. The Results of the Rank Order tell us that ‗other‘ is the better performed project in relation to all indicators and that the worst project is ‗Preval‘. The Rank Order ranks the projects from the best performed to the worst. As for the Flag model, this is an assessment method of the indicators. The three clusters are: green, yellow and red, and defined in the previous section. These clusters are based on the CTV values. The results of Flag Model coincide with the Rank Order. Projects on the top of the list show ‗Green‘ indicators. For example, the first projects on the list have at least 3 ‗Green‘ indicators.
On the other hand, the comparison of results shows the specific project requirements and which indicator is deficient. In other words, to separate the results by groups of indicators show which projects are well ranked but it does not have all indicators in ‗Green‘.
12th WCTR, July 11-15, 2010 – Lisbon, Portugal
19
DISCUSSION, CONCLUSION AND FURTHER RESEARCH
The aim of this work is to offer decision-makers a methodology and a set of techniques in order to analyse the ‗fitness for purpose‘ regarding transport research projects during the Fifth and Sixth Framework Programme. In the methodology the acceptability and priority of choice possibilities in the case of qualitative or mixed data is evaluated. Two complementary evaluation methods have been proposed: rank order and flag model.
Despite the increasing prevalence of evaluation efforts, the effectiveness of the various approaches has not been critically assessed. To this end, governments have developed or stimulated research evaluation activities in an attempt to get ―more value for the money‖ they spend on research support. This methodology for research evaluation can be a self-directed process when implemented by institutions themselves, such as research organisations, universities, or funding agencies. As suggested by the OECD (Organisation for Economic Co-operation and Development (OECD), 2007), such efforts may respond to self-discipline principles or to imposed regulations.
The results are consistent and show the specific project requirements. On one hand, an advantage of the Rank Order is that the method does not penalize projects by the total score, the method take into account the variability of the sample. This method becomes useful to compare projects within small sample sizes. On the other hand, the application of the two methods has led to the identification of the best possible ranking for each alternative as well as the degree of acceptability of each project with respect to a pre-defined set of CTVs. The results turned out to be plausible; they may perhaps not always coincide with prevailing political wisdom, but offer on the other hand a platform for a structured debate.
It is important to be clear on the aim of this paper: to develop a methodology for evaluation research, applicable to a number of projects within a sample large enough, i.e. 50 projects. With an adequate number of projects as a sample base more robust conclusions could be reached. However, from the analysis of this work, some specific conclusions could be pointed out:
The main problem is the lack of follow up. Evaluation of projects should be more frequently done, and they should be more concerned with the impacts of research activity.
12th WCTR, July 11-15, 2010 – Lisbon, Portugal
20
There is a possible cause-effect relationship between utility and scientific and, so, When the utility is low the scientific will also be low. On the basis of utility definition, as a measure of the extent to what the results correspond with the problems to be addressed, we can link it as follows: if the project methodology is not adequate, the fundamental problem could not be solved.
In conclusion, research evaluation should not be considered as an end in itself. Rather, it should be developed and used as a tool to key policy issues and essential questions that need to be addressed. As concluded by the OECD (2007), research evaluation becomes useful as long as it helps to clarify policy debates and moves decision-making processes forward on more rational and quantifiable grounds.
The application of the multi criteria methods points out that these are very useful tools to deal with conflicts in a decision process, where three critical points require attention:
First, the combination of methods within an integrated framework of analysis can achieve more satisfactory results. The use of our methodology enhances the level of flexibility for the decision making process. The results are divided into two parts: rank and flag model; each of these parts is evaluated disaggregated into four indicators groups. The methodology and accompanying software allows the decision makers to analyse simultaneous projects and the degree of utility among similar projects.
Second, the methodology offers to decision makers the possibility to take into account preferences of policy makers and stakeholders in a decision maker process, as well as to measure the impact of these viewpoints. An advantage of this method is that it takes into account the variability of the sample. This method becomes useful to compare projects within small sample sizes.
Finally, the use of CTVs provides decision maker with an operational framework for socially sustainability analysis on a given subject or in a given area.
This methodology could be applied to a larger sample, 50 projects or more, and obtain representative results from which decision makers can get future research lines for new projects. The rank-order and list of flags by categories (FP, mode of transport, financial instrument, etc) provide recommendations and highlight which research categories need to be improved.
ACKNOWLEDGMENTS
12th WCTR, July 11-15, 2010 – Lisbon, Portugal
21
REFERENCES
Capron, H. (1997). Public support to R&D programmes: An integrated evaluation scheme. in OECD (1997a) policy evaluation in innovation and technology: Towards best
practices.
Chelimsky, E., & Shadish, W. R. (1997). Evaluation for the 21st century: A handbook Sage Pubns.
Chen, H. T., & Rossi, P. H. (1992). Using theory to improve program and policy evaluations Greenwood Press Westport, Conn.
Grant-Muller, S., MacKie, P., Nellthorp, J., & Pearman, A. (2001). Economic appraisal of european transport projects: The state-of-the-art revisited. Transport Reviews, 21(2), 237-261.
Hemlin, S. (1991). Quality in science: Researchers' conceptions and judgments. University of Gothenburg: Department of Psychology.
Kaukonen, E. (1997a). EVALUATION OF SCIENTIFIC RESEARCH IN FINLAND. OCDE/GD (97) 194, , 12.
Kaukonen, E. (1997b). Science policy and research evaluation facing the diversity of science. The Institutions we Live by, Research Institute for Social Sciences, Publication, 17, 1997.
La Paix, L., & Lopez-Lambas, M. (2008). Propuesta metodología recomendada para la evaluación de planes de movilidad sostenible. Paper presented at the CD Actas VIII Congreso Ingeniería Del Transporte, A Coruña.
Likert, R. (1932). A technique for the measurement of attitudes.
Luukkonen, T. (1990). Invited review article: Bibliometrics and evaluation of research performance. Annals of Medicine, 22(3), 145-150.
Medda, F., & Nijkamp, P. (2003). A combinatorial assessment methodology for complex transport policy analysis. Integrated Assessment, 4(3), 214-222.
Metronome Consortium. (2009). A methodology for evaluation of project impacts in the field of transport No. 01).
http://www.vtt.fi/sites/metronome/metronome_objectives.jsp?lang=en:
Nagarajan, N., & Vanheukelen, M. (1997). Evaluating EU expenditure programmes: A guide. Ex Post and Intermediate Evaluation, European Commission XIX/02—Budgetary Overview and Evaluation, Luxemburg,
Nijkamp, P., & Ouwersloot, H. (1997). A decision support system for regional sustainable development: The flag model.
Nijkamp, P., Ouwersloot, H., & Rienstra, S. A. (1997). Sustainable urban transport systems: An expert-based strategic scenario approach. Urban Studies, 34(4), 693-712. Organisation for Economic Co-operation and Development (OECD). (2007). The evaluation
of scientific research
Patton, M. Q. (2002). Qualitative research and evaluation methods Sage Pubns.
Rossi, P. H., & Freeman, H. (1985). In Sage Publications (Ed.), Evaluation: A systematic approach (3rd ed.). Calif: Newbury Park.
12th WCTR, July 11-15, 2010 – Lisbon, Portugal
22
Vedung, E. (1997). Public policy and program evaluation, new brunswick. Vreeker, R., Nijkamp, P., & Ter Welle, C. (2002). A multicriteria decision support
methodology for evaluating airport expansion plans. Transportation Research Part D, 7(1), 27-47.
APPENDIX
Figure IV- Flag frequencies
0
2
4
6
Management
Scientific
Societal
Utility
P2
IMAGINIT
Green
Red
Yellow
0 2 4 6
Management
Scientific
Societal
Utility P9
ROSEBUD
12th WCTR, July 11-15, 2010 – Lisbon, Portugal