Introduction
Riparian forests are one of the most valuable eco-logical elements of river systems. They maintain high levels of biological diversity and productivity and pro-vide dynamic habitats for many different species (Ben-nett and Simon, 2004). They also provide many other ecological and social benefits and ecosystem services, performing critical functions in both hydrological and biogeochemical cycles, protecting water quality, and providing important habitats for a rich diversity of flo-ra and fauna (Naiman and Décamps, 1997; Lohman, 2004). These attributes are closely related to a range of hydric conditions that determine the quality of ri-parian forests as refuges for a large number of species that inhabit riverine environments. However, riparian
forests have been subjected to progressive alteration in the last centuries, mainly due to human pressures (particularly river regulation and agricultural deve-lopment, but also forestry, gravel mining or urban oc-cupation) that have greatly degraded their ecological structure and function (Hughes, 2003).
The reduction and alteration of riparian forests ha-ve resulted in an increase in scientific and technical work related to understanding these ecosystems and their protection and recovery (Naiman et al., 1993; Hughes, 2003). The Water Framework Directive (WFD) (2000/60/EC) and other directives have re-cognised the structure of riparian areas as one of the core features for use in the hydromorphological as-sessment of freshwater bodies. Some authors (Gurnell and Gregory, 1995; Bendix and Hupp, 2000; Richter and Richter, 2000) have analysed the interactions bet-ween hydrological and biomorphological processes, highlighting the importance of riparian stands in the
Evaluating the quality of riparian forest vegetation:
the Riparian Forest Evaluation (RFV) index
Fernando Magdaleno* and Roberto Martinez
CEDEX (Centre for Studies and Experimentation on Public Works). C/ Alfonso XII, 3. 28014 Madrid, Spain
Abstract
Aim of study:This paper presents a novel index, the Riparian Forest Evaluation (RFV) index, for assessing the ecological condition of riparian forests. The status of riparian ecosystems has global importance due to the ecological and social benefits and services they provide. The initiation of the European Water Framework Directive (2000/60/CE) requires the assessment of the hydromorphological quality of natural channels. The Directive describes riparian forests as one of the fundamental components that determine the structure of riverine areas. The RFV index was developed to meet the aim of the Directive and to complement the existing methodologies for the evaluation of riparian forests.
Area of study:The RFV index was applied to a wide range of streams and rivers (170 water bodies) in Spain.
Material and methods:The calculation of the RFV index is based on the assessment of both the spatial continuity of the forest (in its three core dimensions: longitudinal, transversal and vertical) and the regeneration capacity of the forest, in a sampling area related to the river hydromorphological pattern. This index enables an evaluation of the quality and degree of alteration of riparian forests. In addition, it helps to determine the scenarios that are necessary to improve the status of riparian forests and to develop processes for restoring their structure and composition.
Main results:The results were compared with some previous tools for the assessment of riparian vegetation. The RFV index got the highest average scores in the basins of northern Spain, which suffer lower human influence. The forests in central and southern rivers got worse scores. The bigger differences with other tools were found in complex and partially altered streams and rivers.
Research highlights:The study showed the index’s applicability under diverse hydromorphological and ecological conditions and the main advantages of its application. The utilization of the index allows a better understanding of the status of riparian forests, and enhances improvements in the conservation and management of riparian areas.
Key words: riparian quality; Water Framework Directive; connectivity; indicator; hydromorphology.
overall status of fluvial ecosystems. Thus, monitoring has become fundamental to assess the impacts of hu-man activities on ecological functioning and the ef-fectiveness of changes in management (NRC, 2002).
However, in most cases, the status of riparian forests worldwide has not been well analysed, and they are most likely one of the least-understood ecological features of rivers. There are few comprehensive procedures capa-ble of assessing the status of the core elements of ripa-rian stands. In most cases, these procedures are not at all associated with the hydromorphological functioning of the river, complicating further discussions about the causes of the alteration and the available measures for restoration (Hughes, 2003).
In Spain, a diverse array of water and biodiversity decrees and laws require that water and natural re-source managers assure the protection of riparian ve-getation. A wide range of measures is to be adopted to preserve the quality of riparian forests. For instance, environmental flow requirements are also to be calcu-lated based on their needs (e.g.Spanish Law 11/2005, and Decree 907/2007).
Different indexes have been proposed for the as-sessment of riparian stands (Table 1). However, most of those indexes have shown different problems in their application or results (e.g.the delineation of study re-ach not representative of the overall area, strictly ba-sed on woody vegetation, not linked to the river struc-ture, too resource intensive, results diff icult to interpret, etc.) (Kleynhans et al., 2007; Magdaleno et al., 2010). In fact, few of these protocols have been found to integrate the diverse dimensions of the func-tioning of riparian forests on the basis of the dominant hydromorphological processes typical in river systems. Furthermore, they are not related to the specif ic di-mensions of fluvial ecosystems. The range of riparian widths oscillates across meters and hundreds of me-ters, and the complexity of the forest structure and composition is also largely variable. Thus, surveys should preferably be adapted to the river pattern and supply a real image of the overall quality of the ripa-rian stands.
The main goals of this paper are as follows: (i) to de-velop an easy-to-apply fieldwork methodology for the assessment of riparian stands; (ii) to develop an impro-ved tool to evaluate and interpret changes in riparian areas; (iii) to provide technicians and managers with a river-based procedure for the assessment of the quality of riparian vegetation, and the selection of the most ne-cessary actions for its improvement or restoration.
Material and methods
A description of the RFV index
The parameters that constitute the RFV (Riparian Forest eValuation) index are based on the ecological connectivity of riparian vegetation. Although forest connectivity has normally been considered in spatial terms, temporal changes are of equal importance (Amoros and Bornette, 2002). These temporal-spatial relationships between connectivity and ecosystem dynamics have been analysed with respect to fluvial geomorphology (e.g.Poole, 2002), landscape ecology (Kondolf et al., 2006), biodiversity maintenance (e.g. Liebold and Norberg, 2004), nutrient cycling (Stanley et al., 1997) and food web structure (Woodward and Hildrew, 2002).
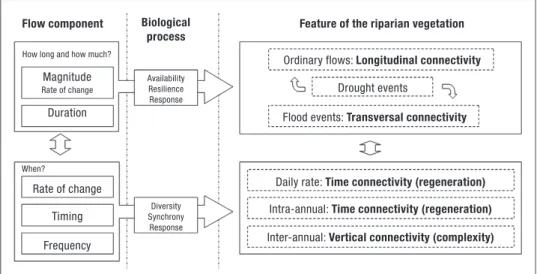
The RFV index has been designed to assess the spa-tial connectivity of riparian vegetation (in its three di-mensions: longitudinal, transversal and vertical). But also the regeneration capacity of this vegetation, which guarantees its continuity in the future (Magdaleno et al., 2010) The forest features selected were those con-nected to the essential hydromorphological and bio-logical processes occurring in the riparian areas (Fig. 1).
Considering the vast hydromorphological variabi-lity among Spanish basins, the index was designed to include an assessment procedure that incorporates the structure and function of different river systems. The-se elements (structure and function) are influenced by diverse variables (e.g.the type and gradient of the va-lley, soil controls, riparian vegetation and land uses), but the flow regime is most likely the most influential variable in the development of the geomorphic attri-butes of river systems (Bendix and Hupp, 2000; Bunn and Arthington, 2002; Sidle and Onda, 2004; Hupp and Rinaldi, 2007). The dominant (channel-forming) dis-charge of a river is closely related to these attributes. The most relevant attribute is the relationship betwe-en the dominant flow and the bankfull width (Simon-son et al., 1994; Peck et al., 2003; Schmidt and Pot-yondy, 2004).
in larger ones. The active floodplain is the best indi-cator of the bankfull level. Therefore, the most feasi-ble identif ier of this level is the breakline of the
floodplain (Rosgen, 1996). It is often helpful to use other field indicators to determine the bankfull level (such as the elevation associated with the highest
le-Table 1.Previous indexes proposed for the assessment of riparian stands, with indication of name, original author(s), pro-cedure or scope, and places of application
Index Authors Procedure or scope Places of application
QBR (Qualitat del Bosc de Ribera)
IVF (Fluvial Vegeta-tion Index)
RVI (Riparian Vege-tation Index) and VEGRAI (Riparian Vegetation Response Assessment Index)
RVI (Riparian Vege-tation Index)
VIBI (Vegetation In-dex of Biotic Inte-grity)
Other: indexes used for assessing riparian habitat quality
Munné et al.(1998, 2003)
Gutiérrez et al.
(2001)
Kemper (2001), Kleynhans et al.
(2007)
Aguiar et al. (2009)
Mack (2001), Ló-pez and Fennessy (2002), Miller et al.
(2006), Coles-Rit-chie et al. (2007) Raven et al. (1998), Bunn et al. (1999), Salinas et al. (2000), Winward (2000), Ferreira et al. (2005), Johansen et al.
(2008)
Summation index of four components: — Total riparian vegetation cover (% of cover of any kind of plants except annual species
— Cover structure (% of cover due to tre-es, shrubs and other low lying vegetation) — Cover quality (number of species of native riparian trees and condition of fo-rest structure
— Channel alterations (morphological man-made changes and artificial structu-res)
Each component is calculated indepen-dently.
The individual score of each part can not be either negative or higher than 25. Weighted aggregation of the plant cover of species. Assignment of value to species ba-sed on its autochthonous or allochthonous characteristics.
Assessment of a wide array of metrics (co-ver, abundance, structure, composition and recruitment) and applied according to the hydromorphological zonation (marginal, lower and upper strips) in a representative sub-reach of the river
Multimetric index of biotic integrity Categorical components: composition (e.g.cover and number of alien and ende-mic species) and functional metrics asso-ciated with life cycle and reproduction (e.g.numbers of perennial species) or tro-phic status (e.g.proportion of nitrophyl-lous species)
Ecological quality of vegetation in wet-lands
Indexes not specifically designed to des-cribe the status of riparian stands; some of them are focused on river fauna and in-clude riparian vegetation as one of the at-tributes for the definition of a good habi-tat shabi-tatus (Rankin, 1989; Chovanec et al.,
2005)
— Different national and regio-nal Spanish basins (Suárez and Vidal-Abarca, 2000)
— Queensland, Australia (Pet-tit, 2002)
— Ohio, USA (Colwell and Hix, 2008)
— Chile (Fernández et al.,
2009)
— Argentina (Kutschker et al.,
2009)
— Catalonia (Spain)
— South Africa
— Portugal
vel of the deposition elements, changes in vegetation, changes in the slope that occur along transversal sec-tions, changes in the bank materials, bank scouring or staining lines).
The use of the bankfull width as the fundamental variable for establishing the riparian sampling site was in accordance with some other tools, such as the Stre-am Visual Assessment Protocol-SVAP (Bjorkland et al., 2001, 2006). The authors of SVAP used this geo-morphic feature to define the area where the riparian quantity and quality was to be quantif ied. Thus, following the same assumption that is now considered in the RFV index: the prevalent influence of the hydro-morphological pattern on the assessment procedure. These authors also consider forest connectivity to be an essential parameter to describe the status of the fo-rest: their assessment tool evaluates if the forested ri-parian sites have a correct mix of shrubs, understory trees and new shrub and tree regeneration. Thus, their work also supports the design and application of the RFV index.
A longitudinal prof ile with a minimum length of twenty (20) bankfull widths (wb) should be examined
to determine the nature and presence of a representa-tive indicator of the bankfull level for the reach. The indicated value (20 wb) is in accordance with values
recommended in the literature (e.g.Fausti et al., 2004; Gerstein and Harris, 2005) and with the preliminary tests performed during the development of the RFV index.
RFV parameters
Longitudinal connectivity of the riparian forest
Longitudinal connectivity has long been recognised as a basic feature of river systems (Vannote et al., 1980; Andersson et al., 2000). For the RFV, this parameter is determined along a transect with a length of 10 to 14 times the bankfull width (to integrate the longitu-dinal connectivity along the different mesohabitats pre-sent in the channel; Keller and Melhorn, 1978) (Fig. 2). The selection of the specific length in the 10-14 width range is based on the heterogeneity of the channel eco-morphology found in the reach (the greatest hetero-geneity will require a longer transect). This parameter
Figure 1.Rationale for the RFV index. The assessment features of the riparian vegetation were selected from those sustaining or associated to core biological processes. The hydromorphologi-cal pattern of the river was the basis for the design of an assessment index capable of guiding the riparian conservation and management. Flow components were thus related to biological pro-cesses to select the features finally incorporated to the RFV index.
Magnitude
Rate of change
Duration
Rate of change
Timing
Frequency
Flow component Feature of the riparian vegetation
Ordinary flows:Longitudinal connectivity
Daily rate:Time connectivity (regeneration)
Intra-annual:Time connectivity (regeneration)
Inter-annual:Vertical connectivity (complexity)
Flood events:Transversal connectivity
Drought events
Biological process
How long and how much?
Availability Resilience Response
Diversity Synchrony Response When?
evaluates the connectivity of the autochthonous ripa-rian forest. The connectivity is assessed exclusively for all of the autochthonous tree and shrub taxa of the forest. Herbaceous taxa and allochthonous taxa are considered as discontinuities in the assessment. A lack of vegetation due to rocky obstructions in the channel, or in the confluence of the tributaries and secondary channels in the main channel, is not negatively inter-preted when determining this parameter.
The longitudinal connectivity is analysed on both banks lines but not on in-channel islands. The assess-ment of this parameter is based on the procedure shown
in Table 2, according to the percentage of the length of both banks that is covered with autochthonous ri-parian forest (> 90%, 70-90%, 50-70%, 30-50%, < 30%). The thresholds were set following the indica-tions by Kinzig et al.(2006) and Knight and Cullen (2010) on vegetation connectivity.
Transversal connectivity of the riparian forest
In the last several decades, there has been a wide re-cognition of the importance of the lateral dynamics of
Table 2.Assessment of the longitudinal, transversal and vertical connectivity and the regeneration capacity of riparian fo-rests for the RFV index
Very good status Good status Moderate status Deficient status Bad status
Longitudinal con-nectivity,according to the percentage of the length of both banks covered with autochtho-nous riparian forest
Transversal con-nectivity,according to the percentage of channel sections that are covered with autochthonous riparian vegetation
Vertical connecti-vity(descriptive as-sessment)
Regeneration capa-city (descriptive assessment)
Values
More than 90%
More than 90%
Very dense au-tochthonous fo-rests, with a shrub stratum compo-sed of different spe-cies. Presence of nemoral, epiphi-tic and lianoid species
Abundance of young individuals of riparian trees and shrubs, both under the forest cover and in open spaces in the channel (e.g.bars, islands)
5
Between 70 and 90%
Between 70 and 90%
Dense autochtho-nous forests, with a shrub stratum composed of dif-ferent species. Scarcity of nemo-ral, epiphitic and lianoid species. Specific presence of ruderal species and allochtho-nous species Presence of young individuals of ri-parian trees and shrubs, both un-der the forest co-ver and in open spaces in the channel (e.g.bars, islands)
4
Between 50 and 70%
Between 50 and 70%
Sparse forests of a u t o c h t h o n o u s and allochthonous species, with a scarce shrub stra-tum and a remar-kable presence of ruderal species
Specific presence of isolated young trees and shrubs, conditioned by non-natural chan-nel dynamics or human activities
3
Between 30 and 50%
Between 30 and 50%
Very sparse fo-rests, abundance of allochthonous and ruderal spe-cies. Lack of ri-parian shrubs
Absence of young trees and shrubs, conditioned by non-natural chan-nel dynamics, or human activities
2
Under 30%
Under 30%
Isolated trees or shrubs, mostly alloch-thonous. Domina-ted by ruderal spe-cies
Only extra-mature and damaged trees and shrubs are pre-sent
river systems for their adequate ecological functioning (Naiman and Décamps, 1997). The transversal con-nectivity of the autochthonous riparian forest is as-sessed along f ive to seven channel sections, equally distant and orthogonal to the channel axis, to assess the lateral dimension of the riparian vegetation in the channel transect. The connectivity is exclusively ba-sed on all the autochthonous tree and shrub taxa of the forest and the autochthonous macrophyte species. Other herbaceous taxa or allochthonous taxa are con-sidered as discontinuities in the assessment.
The length of the channel sections should equal the total width of the riparian forest when this vegetation is connected to natural non-riparian vegetation or when the riparian forest grows in the maximum width allo-wed by the fluvial valley. If not the case, the section length should equal the bankfull width for any of the two banks (Fig. 2). This length includes the area most frequently covered by riparian vegetation in reference conditions (Bjorkland et al., 2001; 2006).
The transversal discontinuities are considered to re-present a lack of canopy cover, the existence of alloch-thonous taxa or the development of human land uses (e.g.any type of infrastructure, arable land, plantations and urban designs). The assessment of this parameter is based on the procedure presented in Table 2, accor-ding to the percentage of channel sections that is co-vered with autochthonous riparian vegetation (> 90%, 70-90%, 50-70%, 30-50%, < 30%). As in the former feature, the thresholds were set following the indica-tions by Kinzig et al.(2006) and Knight and Cullen (2010) on vegetation connectivity.
Vertical connectivity (complexity) of the riparian forest
The vertical connectivity (i.e., the complexity) of the riparian forest, as the third core spatial dimension of vegetation connectivity (Lindenmayer et al., 2000), is assessed along the channel sections described for the previous parameter (ii) in terms of both the struc-ture and composition of the vegetation (Fig. 2). This third parameter is assessed in the manner shown in Ta-ble 2, following a descriptive analysis that takes into account the forest density, the connectivity between strata and the relative presence of epiphytic, lianoid, nemoral and ruderal flora.
The assessment does not score negatively for a lo-wer density of vegetation in forests where the
vegeta-tion is naturally sparse (e.g.riparian forests in tempo-rary, intermittent or ephemeral channels) in reference conditions.
The final score of this parameter is an average of its partial values for both the riverbanks and in all of the studied sections. If the final score is not an integer, it is adjusted to the closest integer value. If the fractio-nal part of the score is 0.5 or less, it is rounded down; otherwise, it is rounded up (i.e.,a f inal score of 3.7 would represent a good status [4], whereas a final sco-re of 3.5 would indicate a moderate status [3]).
Regeneration capacity of the riparian forest
The determination of the short-, medium- and long-term dynamics of riparian forests is essential for re-cognising the future state of riparian stands (Amoros and Bornette, 2002). The regeneration capacity of a ri-parian forest is assessed along the transect that is de-fined for longitudinal connectivity. The assessment of connectivity is based on the existence of sprouts or sa-plings of autochthonous riparian trees and shrubs on both banks of the channel.
In cases where there is an almost a total lack of light, restrictive competition with other autochthonous plant species or rocky obstructions in the channel, the ab-sence of regeneration of the riparian forest is not ne-gatively factored into the RFV index. This fourth pa-rameter is to be assessed in the manner shown in Table 2.
Final assessment of the ecological quality
of the riparian forest
The final assessment of the ecological quality of the riparian forest is performed through a direct aggrega-tion of the quantitative values obtained for each para-meter. The final status of the riparian forest is classi-f ied using colour codes associated with Ecological Quality Ratios (EQRs), as defined by the Water Fra-mework Directive. The qualitative assessments (Very Good, Good, Moderate, Poor and Bad) are defined ac-cording to the quality of the longitudinal, transversal and vertical connectivity and the regeneration capa-city (Tables 3 and 4).
Table 3.Qualitative assessment, colour coding and the quantitative score range of the aggregate value of the RFV index
Status Colour Score
Very good – The riparian forest shows mostly continuous longitudinal and transversal connectivity; Blue 19-20 its regeneration is very well represented; and its structure and composition indicate a very high
ecological value
Good – The riparian forest shows high longitudinal and transversal connectivity; regeneration Green 16-18 is visible; and its structure and composition present a good ecological value
Moderate – The riparian forest shows some alterations in the longitudinal and transversal Yellow 12-17 connectivity; regeneration is scarce; or its structure and composition indicate human influence
Poor – The riparian forest shows great alteration of the longitudinal and transversal connectivity; Orange 8-15 regeneration is almost non-existent; or the structure and composition of the forest show clear
tracks of human influence
Bad – The riparian forest shows total alteration of the longitudinal and transversal connectivity; Red 4-11 regeneration is non-existent; or the structure and composition of the forest show a total lack
of ecological value
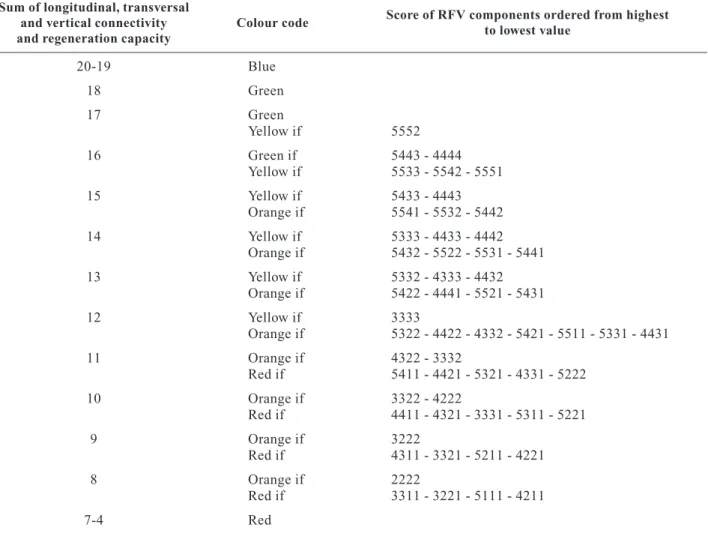
Table 4.Quantitative assessment of the value of the RFV index according to the score obtained from its partial components and the correspondence with the colour code of the index. The table specifically identifies all of the potential combinations of the scores, independent of the order of the components
Sum of longitudinal, transversal
Score of RFV components ordered from highest
and vertical connectivity Colour code
to lowest value and regeneration capacity
20-19 Blue
18 Green
17 Green
Yellow if 5552
16 Green if 5443 - 4444
Yellow if 5533 - 5542 - 5551
15 Yellow if 5433 - 4443
Orange if 5541 - 5532 - 5442
14 Yellow if 5333 - 4433 - 4442
Orange if 5432 - 5522 - 5531 - 5441
13 Yellow if 5332 - 4333 - 4432
Orange if 5422 - 4441 - 5521 - 5431
12 Yellow if 3333
Orange if 5322 - 4422 - 4332 - 5421 - 5511 - 5331 - 4431
11 Orange if 4322 - 3332
Red if 5411 - 4421 - 5321 - 4331 - 5222
10 Orange if 3322 - 4222
Red if 4411 - 4321 - 3331 - 5311 - 5221
9 Orange if 3222
Red if 4311 - 3321 - 5211 - 4221
8 Orange if 2222
Red if 3311 - 3221 - 5111 - 4211
score can be associated with two possible conditions, the final identification is made by considering the par-tial scores of each parameter (as shown in Table 4). In this case, the four-figure code would not be dependent on the order in which the parameters were ordered; the four figures that compose the code in Table 4 are or-dered from higher to lower value of the parameters. For example, if a forest was determined to have a sco-re of 17 after aggsco-regating the partial scosco-res (e.g. lon-gitudinal connectivity = 5, transversal connectivity = 5, vertical connectivity = 2 and regeneration capacity = 5), it could be classified as either a good or moderate sta-tus forest. However, because the score code is 5525, the status would be classified as moderate (yellow co-lour; Table 4).
Practical application of the RFV
index
Study area
The RFV index has been extensively applied in six large Spanish basins: the Guadiana and Guadalquivir basins in southern Spain, the Tagus and Douro basins in central Spain and the Cantábrico and Miño-Sil ba-sins in northern Spain (Fig. 3 and Table 5). They cha-racterise by highly variable environmental conditions, which induce the existence of very diverse riparian fo-rests.
The climate in the Guadiana and Guadalquivir ba-sins is Mediterranean-Continental, characterised by a well-defined dry season and remarkable thermal osci-llations, which contribute to limited rainfall, high sum-mer temperatures and very low sumsum-mer flows (from
June to September). The high variability of the flow regime enhances the high biodiversity in the riparian forests in these basins. In Guadiana, these forests are commonly dominated by willows (Salixspp.), narrow-leafed ash trees (Fraxinus angustifolia Vahl.), french tamarisks (Tamarix gallica L.) and tamujos ( Securi-nega tinctoria L.); although in many channels, typical Mediterranean non-riparian species are mixed inside the riparian stands (e.g.holm oaks (Quercus ilex L.), cork oaks (Quercus suber L.), Portuguese oaks ( Quer-cus faginea Lam.) and rockroses (Cistusspp.)). In Gua-dalquivir, the riparian forests are dominated by willows (Salixspp.), white poplars (Populus alba L.), narrow-leafed ash trees (Fraxinus angustifolia Vahl.), salt
ce-Figure 3.Distribution of the six basins and the water bodies in-cluded in the analysis. They were chosen to evaluate the appli-cation of the RFV index on a wide array of hydromorphologi-cal and ecologihydromorphologi-cal conditions in riparian areas.
Table 5.Key variables that describe the set of water bodies included in this work
Basin Catchment area Average rainfall (nm) Number of water
(km2) (1940/41-2005/06) bodies analysed
Guadiana 55,527 522 23
Guadalquivir 57,527 573 32
Tagus 55,772 648 32
Douro 78,859 612 40
Cantábrico 23,232 1,248 (western basin)
1,296 (eastern basin) 31
Miño-Sil 17,619 1,235 24
dars (Tamarix spp.) and oleanders (Nerium oleander L.). The water bodies included in the study were dis-tributed across their territories and characterised by highly diverse ecological and hydromorphological con-ditions (CHGuadiana, 2011; CHGuadalquivir, 2010). The Tagus and Douro basins share a Mediterrane-an-Continental climate, which is strongly influenced by the altitudinal range and, in western regions, by the Atlantic. In these basins, riparian forests are domina-ted by alders [Alnus glutinosa (L.) Gaertn.], willows (Salixspp.), ash trees (Fraxinusspp.), poplars ( Popu-lusspp.), elm trees (Ulmus minor Mill.) and salt ce-dars (Tamarixspp.). The study included water bodies conditioned by a large hydromorphological gradient (CHTajo, 2007; CHDuero, 2010).
The Cantábrico and the Miño-Sil basins share an Atlantic humid climate (CHMiño-Sil, 2010; CHCan-tábrico, 2011). The thermal and rainfall oscillations in these basins are much more attenuated than in the other basins addressed in this study. This behaviour enhan-ces the lower variability in the structure and composi-tion of their riparian forests (Lara et al., 2004), which are dominated by alders [Alnus glutinosa (L.) Gaertn.], large willows (Salixspp.) and mixed stands.
Methods
The analysis comprised the application of the RFV index in a wide range of physical and environmental conditions in different Spanish basins. Furthermore, the index was compared with the results derived from the application of another index traditionally used in Spain for the assessment of the status of riparian forests.
The first task was developed for 170 of the 182 pre-selected water bodies in the basins indicated in the study area, excluding those 12 with incomplete data (CHTajo, 2007; CHDuero, 2010; CHGuadalquivir, 2010; CHMiño-Sil, 2010; CHGuadiana, 2011; CHCan-tábrico, 2011). For all of these water bodies, the four parameters integrated in the index (longitudinal con-nectivity, transversal concon-nectivity, vertical connecti-vity and regeneration capacity) and the final (aggre-gated) value were analysed.
In a second step, the value of the RFV index was compared to the status of the riparian forests as shown in the management plans of four of these basins (Can-tábrico, Miño-Sil, Douro and Tagus). These four ba-sins were selected due to the availability of data re-garding the forest status in a wide range of water
bodies. The forest status in all the plans was derived from the application of the QBR index (Munné et al., 1998, 2003). The objective of this second step was two-fold: i. to check the differences in the values derived from the application of both methods, and ii. to deter-mine the feasibility of applying the RFV index under different hydromorphological and ecological gradients compared with previous approaches.
For both tasks (the application and then the compa-rison of the index), the statistical analysis was perfor-med with SPSS 17 (IBM, 2008). For every water body the values of RFV and QBR range from 1 to 5, setting a gradient from 1 (bad status) to 5 (very good status). Due to these variables are qualitative-ordinal, corre-lation was verif ied by studying a contingency table, using the Pearson’s Chi-squared test to investigate for significance correlation. The contingency table analy-zed 5×5 pairs, implying 16 degrees of freedom in the Chi-squared test.
The Pearson´s Chi-squared test comparing RFV in-dex and QBR inin-dex showed that there was not enough dispersion of data in the 5×5 contingency matrix. Due to lack of data in some cells of the RFV-QBR matrix, especially the cells which link high values of one in-dex to low values of the other, the significance of the possible correlation could not be evaluated through this test. In order to characterize the behaviour of both indexes, a descriptive analysis was carried out. Two box-and-whisker plots were constructed using 170 ca-se studies (Figs. 4 and 5). First plot shows the distri-bution of values in every basin, and the second plot compares RFV and QBR results for every basin.
Results
which are not as affected by agricultural and urban uses as are the central and southern basins (Draft Manage-ment Plans: CHTajo, 2007; CHDuero, 2010; CHGua-dalquivir, 2010; CHMiño-Sil, 2010; CHGuadiana, 2011; CHCantábrico, 2011).
The riparian stands in the Guadiana basin had a me-dian status of 3 (Moderate), still showing a relatively high number of water bodies with forests that only re-ached a value of 2 (Deficient) or even 1 (Poor). The median status in the Guadalquivir, Douro and Tagus basins was even worse, just reaching the value 2 (De-f icient). However, in those cases, there were also a number of forests with worse scores (1-Poor) and so-me that reached higher values (4-Good, or even 5-Very good in the Tagus basin). The range of the water bo-dies that were considered in the analysis comprised different physical and environmental conditions, which were detected by the index despite showing general trends in the overall assessment. These results are con-sistent with the general degree of alteration in those basins illustrated by the IMPRESS (Pressures-Impacts) analyses that are endorsed in the previously mentio-ned Draft Management Plans.
Regarding the comparison of RFV with the QBR in-dex, Fig. 5 offers a schematic view of the correspon-ding values of the two indexes in the four basins for
which QBR index data were available (Cantábrico, Mi-ño-Sil, Douro and Tagus). The classes covered by the QBR index (Very good, Good, Fair, Bad and Very bad) are illustrated with different plots in the figure.
For the better-preserved basins (Cantábrico and Mi-ño-Sil), both indexes supplied similar results for the better and worst-preserved riparian forests; Classes 1 and 5 of the RFV for both basins and Class 4 for the Miño-Sil basin showed similar conditions according to the QBR index. However, for lower-intermediate classes (2 and 3) of the RFV index, QBR supplied hig-her scores. That is, the RFV index penalised the exis-tence of some degree of fragmentation in the spatial-temporal connectivity of the forest.
For the worst-preserved basins (Douro and Tagus), the trends were rather similar for both and somewhat different from the previous diagnosis. The riparian fo-rests with the worst statuses (Classes 1, 2 and 3 of the RFV index) acquired very similar figures after the ap-plication of both indexes, only scoring slightly better for QBR. However, the stands with a better status sho-wed a trend to be more positively scored with the RFV than the QBR index, although some cases may be found (for Class 4) where the RFV index again gave more negative scores.
Figure 4.Box-and-whisker plots of the RFV values for the 170 study cases in the six basins included in the analysis. For every basin the box depicts three percentiles, 25%, 50% (median) and 75%, and the whiskers depict the minimum and maximum va-lues. The plot illustrates the wide variability of conditions of riparian forests in the six basins. The best scores, despite this variability, were found in the basins of Northern Spain (Cantá-brico and Miño-Sil).
Cantábrico Douro Guadalquivir Guadiana Miño-Sil Tagus Basin
RFV Index
5
4
3
2
1
Figure 5.Box-and-whisker plots of RFV values compared with
QBR values for the four basins used in the second step of the analysis. The box depicts three percentiles, 25%, 50% (median) and 75%, and the whiskers depict the minimum and maximum values. For every basin, the distribution of the QBR status for every RFV status is showed. The QBR is depicted by a pattern according to its different values from 1 to 5. E.g.good link could be found between both indexes in the Tagus and Douro basins: very bad QBR (black pattern) was matched to very low values of RFV.
5
4
3
2
1
RFV Index
Cantábrico Douro Miño-Sil Tagus Basin
Very good
QBR Index
Discussion and conclusions
The application of RFV to different case studies (170 water bodies) provided an assessment of the sta-tus of the conditions of riparian forests. The spatial connectivity and regeneration capacity of these forests, in the context of the associated river systems and the Draft Management Plans of the study basins, was des-cribed. The northern basins in Spain, which are less affected by human pressures along their floodplains and riparian areas, maintained higher quality in their riparian forests. In contrast, the worst-preserved ba-sins, distributed along central and southern Spain (Douro, Tagus, Guadiana and Guadalquivir), received a lower score by the index.
In general terms, the comparison with the QBR me-thod (Munné et al., 1998, 2003) indicated that the RFV index assigns lower scores to riparian forests that show an intermediate degree of fragmentation, while extre-me conditions are similarly described by both tools. The only exception to this trend is in some high-qua-lity forests of big, largely altered basins, where the RFV index gives higher scores to the riparian stands. This exception could be related to the procedure used in both indexes for scoring the quality of the forest connectivity, or it could be related to the selection of the transects used for the assessment. Further appli-cations of the RFV and QBR indexes in additional ba-sins and forest types could help us understand the be-haviour of the assessment tools in those specif ic situations. The f indings of this paper are consistent with some early comparisons made by different ope-rators (Lago, 2011; Simón, 2011; Sanz, 2012; Suárez, 2012) based on the comparative application of a large set of hydromorphological indexes for rivers in cen-tral Spain (including the RFV and QBR indexes). The-se preliminary works showed a very cloThe-se functioning of both indexes under extreme conditions (very good or bad) and a tendency of the RFV index to assign lo-wer scores to the riparian forests in intermediate con-ditions of alteration.
The RFV index showed and easy applicability, des-pite being based on a more thorough assessment of the riparian forests than previous tools. Other of its main advantages, its ability to describe the status of the fo-rest regarding its ecological functioning, could also be successfully tested in a wide array of Iberian rivers. This better understanding of the forest structure is es-sential for the improvement of the riparian conserva-tion and management. The RFV index would allow the
adoption, in the whole set of rivers analysed, of ma-nagement guidelines aimed at the protection of the bet-ter-conserved connectivity parameters, and the resto-ration of those in worse status. Being the index based on the geomorphic pattern of the river, the adoption of those measures is much easily related to the river struc-ture. This fact would be especially important in Medi-terranean rivers characterised by sustaining highly va-riable hydromorphological features.
Many previous works have already indicated an in-terest in developing flexible indicators for the assess-ment of riparian stands. Colwell and Hix (2008) found that, during the adaptation of the QBR index to rivers in Ohio (US), the assessment of riparian forests re-quired an early adjustment to fit the specific physical and environmental conditions of channels in that re-gion. These recommendations meet the procedure sug-gested by the RFV index, and the experience obtained from its application to a wide gradient of conditions. The inconveniences derived from the lack of repre-sentativeness of sampling sites during the assessment of riparian forests were also highlighted by Kleynhans et al.(2007) or Zogaris et al.(2009), who also propo-sed amendments to some previous tools upropo-sed in Aus-tralia and Greece, demanding the adoption of metho-dologies based on the hydrological, geomorphological and ecological pattern of rivers. The RFV index also takes into consideration their f indings, as shown through the application of the index to 170 case stu-dies from six, very different, Spanish basins.
In short, the extensive application of the RFV and its comparison with previous assessment tools allow us to draw the following conclusions:
1. As shown for the diverse and complex situa-tions found during the application of the index, the se-lection of the specific assessment area on the basis of the hydromorphological pattern of the associated chan-nel allows for a better adaptation of the forest sampling to the river features.
2. The use of the spatial-temporal connectivity of autochthonous vegetation has shown to be a valuable indicator of the overall quality of riparian stands. The results derived from the application of the index to a large hydromorphological gradient support that as-sumption, which, through the comparison analysis, contrasted with other traditional procedures in diffe-rent basins.
relevance for stands that can be more easily assessed (given their extremely high or low quality or their ho-mogeneity). However, the procedure is largely in-fluential for more complex and partially altered situa-tions.
4. The application of the RFV index to a wide ran-ge of different river types has demonstrated the inde-x’s consistency, ease of use and general applicability. However, further research could supply new evidence for the behaviour of the index in rivers characterised by singular hydromorphological patterns (e.g.in tem-porary channels).
Acknowledgements
The authors acknowledge V. Roch for her help with the graphics and layout design. The Water Directora-te of the Ministry of Agriculture, Food and Environ-ment provided data on the status of riparian forests in different Spanish basins. One anonymous reviewer ma-de very valuable suggestions to early versions of the manuscript.
References
Aguiar FC, Ferreira MT, Albuquerque A, Rodríguez-Gon-zález P, Segurado P, 2009. Structural and functional res-ponses of riparian vegetation to human disturbance: per-formance and spatial-scale dependence. Fundamental and Applied Limnology 175: 249-267.
Amoros C, Bornette G, 2002. Connectivity and biocomple-xity in waterbodies of riverine floodplains. Freshwater Biology 47: 761-776.
Andersson E, Nilsson C, Johansson ME, 2000. Effects of ri-ver fragmentation on plant dispersal and riparian flora. Regulated Rivers: Research & Management 16: 83-89. Bendix J, Hupp CR, 2000. Hydrological and
geomorpholo-gical impacts on riparian plant communities. Hydrologi-cal Processes 14: 2977-2990.
Bennett SJ, Simon A (ed), 2004. Riparian vegetation and flu-vial geomorphology. Water Science and Application 8: 282 pp.
Bjorkland R, Pringle CM, Newton B, 2001. A stream visual assessment protocol (SVAP) for riparian landowners. En-viron. Monit. Assess. 68: 99-125.
Bjorkland R, Zogaris S, Economou AN, Chatzinikolaou Y, 2006. Using rapid techniques to assess and characterize streams and rivers in Greece’s Western Hellenic Ecore-gion. Annual Water Resources Conference (AWRA); American Water Resources Association. Baltimore, Mary-land, USA, November 6-9, 2006. Final Programme Pro-ceedings. p: 22
Bunn SE, Arthington AH, 2002. Basic principles and eco-logical consequences of altered flow regimes for aquatic biodiversity. Environmental Management 30: 492-507. Bunn SE, Davies PM, Mosisch TD, 1999. Ecosystem
mea-sures of river health and their response to riparian and catchment degradation. Freshwater Biology 41: 333-345. CHCantábrico. 2011. Proyecto de plan hidrológico de la cuenca del Cantábrico – Memoria. Confederación Hi-drográfica del Cantábrico. Spain. 121 + 142 pp.
CHDuero, 2010. Proyecto de plan hidrológico de la cuenca del Duero – Memoria. Confederación Hidrográf ica del Duero. Spain. 680 pp.
CHGuadalquivir, 2010. Proyecto de plan hidrológico de la cuenca del Guadiana (parte española de la demarcación hidrográf ica) – Memoria. Confederación Hidrográf ica del Guadalquivir. Spain. 417 pp.
CHGuadiana, 2011. Proyecto de plan hidrológico de la cuen-ca del Guadiana (parte española de la demarcuen-cación hi-drográfica) – Memoria. Confederación Hidrográfica del Guadiana. Spain. 619 pp.
CHMiño-Sil, 2010. Proyecto de plan hidrológico de la cuen-ca del Miño-Sil – Memoria. Confederación Hidrográficuen-ca del Miño-Sil. Spain. 15 Capítulos + Anexos.
CHTajo, 2007. Estudio general sobre la demarcación hi-drográfica. Confederación Hidrográfica del Tajo. Spain. 59 pp + Anexos.
Colwell SR, Hix DM, 2008. Adaptation of the QBR index for use in riparian forests of central Ohio. In: Jacobs DF, Michler CH. Proceedings of the 16thCentral Hardwood
Forest Conference, West Lafayette, IN, pp: 331-340. USFS.
Coles-Ritchie MC, Roberts DW, Kershner JL, Henderson RC, 2007. Use of a wetland index to evaluate changes in riparian vegetation after livestock exclusion. Journal of the American Water Resources Association (JAWRA) 43(3): 731-743.
Chovanec A, Waringer J, Straif M, Graf W, Reckendorfer W, Waringer-Löschenkohl A, Waidbacher H, Schultz H, 2005. The Floodplain Index – A new approach for asses-sing the ecological status of river/floodplain systems ac-cording to the EU Water Framework Directive. Arch. Hydrobiol. Suppl. 155(1-4): 169-185.
Fausti K, Dugaw D, Chambers J, Dykstra J, Sedell T, Mo-yer C, Lanigan S, Anderson A, Archer E, Henderson R, 2004. Stream channel methods for core attributes. In: Effectiveness monitoring for streams and riparian areas within the Pacif ic Northwest. Edited by Multi-federal Agency Monitoring Program, Logan, Utah, and Aquatic and Riparian Effectiveness Monitoring Program and PAC-FISH/INFISH Biological Opinions (PIBO), Corvallis, Oregon. 20 pp.
Fernández L, Rau J, Arriagada A, 2009. Calidad de la vege-tación ribereña del río Maullín (41° 28’ S; 72° 59’ O) uti-lizando el índice QBR. Gayana Bot. 66(2): 269-278. Ferreira MT, Rodríguez-González PM, Aguiar FC,
Gerstein JM, Harris RR, 2005. Protocol for Monitoring the Effectiveness of Bank Stabilization Restoration. Univer-sity of California, Center for Forestry, Berkeley, CA. 24 pp. Gurnell AM, Gregory KJ, 1995. Interactions between semi-natural vegetation and hydrogeomorphological proces-ses. Geomorphology 13: 49-69.
Gutiérrez C, Salvat A, Sabater F, 2001. Índex per a l’ava-luació de la qualitat del medi fluvial a partir de la vege-tació de ribera, Índex IVF. Documents tècnics del’Agèn-cia Catalana de l’Aigua. Spain.
Hughes FMR (ed), 2003. The flooded forest: guidance for policy makers and river managers in Europe on the res-toration of floodplain forests. FLOBAR2, Department of Geography, University of Cambridge, UK. 96 pp. Hupp CR, Rinaldi M, 2007. Riparian vegetation patterns in
relation to fluvial landforms and channel evolution along selected rivers of Tuscany (central Italy). Annals of the Association of American Geographers 97: 12-30. IBM, 2008. SPSS for Windows Statistical Package for the
Social Sciences (SPSS) V. 17.
Johansen K, Phinn S, Lowry J, Douglas M, 2008. Quantif-ying indicators of riparian condition in Australian tropi-cal savannas: integrating high spatial resolution imagery and f ield survey data. International Journal of Remote Sensing 2 (23): 7003-7028.
Lohman K, 2004. Wildlife use of riverine wetland habitats. In: Wetland and riparian areas of the intermountain west: ecology and management (McKinstry MC, Hubert WA, Anderson SH, eds). University of Texas Press, Austin, Te-xas. pp: 74-86.
Keller EA, Melhorn WN, 1978. Rhythmic spacing and ori-gin of pools and riffles. Bulletin of the Geological Society of America 89: 723-730.
Kemper NP, 2001. RVI Riparian Vegetation Index. WRC Re-port no 850/3/01. Pretoria, Water Research Commission. Kinzig AP, Ryan P, Etienne M, Allison H, Elmqvist T, Wal-ker BH, 2006. Resilience and regime shifts: assessing cas-cading effects. Ecology and Society 11(1): 20.
Kleynhans CJ, Mackenzie J, Louw MD, 2007. Module F: ri-parian vegetation response assessment index in river eco-classification: manual for ecoStatus Determination (ver-sion 2). Joint Water Research Commis(ver-sion and Department of Water Affairs and Forestry report. Water Research Commission Report No. TT 332/08. Joint Wa-ter Research Commission and Department of WaWa-ter Af-fairs and Forestry report, Pretoria, South Africa. Knight RI, Cullen PJ, 2010. Specif ications for a regional
ecosystem model of natural resources in the Tasmanian midlands. Natural Resource Planning, Hobart, Tasmania. 43 pp.
Kondolf GM, Boulton, AJ, O’Daniel S, Poole, GC, Rahel FJ, Stanley EH, Wohl, E, Bang, A, Carlstrom J, Cristoni C, Huber H, Koljonen S, Louhi P, Nakamura K, 2006. Pro-cess-based ecological river restoration: visualizing three-dimensional connectivity and dynamic vectors to recover lost linkages. Ecology and Society 11(2): 5 [online]. Kutschker A, Brand C, Miserendino ML, 2009. Evaluación
de la calidad de los bosques de ribera en ríos del NO del
Chubut sometidos a distintos usos de la tierra. Ecología Austral 19: 19-34.
Lago P, 2011. Evaluación de actuaciones de restauración flu-vial en la Cuenca del Jarama en la Comunidad de Madrid. Proyecto del Master en Espacios Naturales Protegidos. Universidad Autónoma de Madrid. 99 pp. + Annex. Un-published.
Lara F, Garilleti R, Calleja JA, 2004. La vegetación de ri-bera de la mitad norte española. Centro de Estudios de Técnicas Aplicadas del CEDEX. Serie Monografías, 81. Madrid. 536 p. (2ª ed, 2007).
Liebold MA, Norberg J, 2004. Biodiversity in metacommu-nities: plankton as complex adaptive systems? Limnology and Oceanography 49: 1278-1289.
Lindenmayer DB, Margules, CR, Botkin DB, 2000. Indica-tors of Biodiversity for Ecologically Sustainable Forest Management. Conservation Biology 14(4): 941-950. López RD, Fennessy MS, 2002. Testing the floristic quality
assessment index as an indicator of wetland condition. Ecological Applications 12: 487-497.
Mack JJ, 2001. Vegetation index of biotic integrity (VIBI) for wetlands: ecoregional, hydrogeomorphic, and plant community comparisons with preliminary wetland aqua-tic life use designations. Ohio Environmental Protection Agency, Division of Surface Waters, Wetland Ecology Group, Columbus, Ohio.
Magdaleno F, Martínez R, Roch V, 2010. Índice RFV para la valoración del estado del bosque de ribera. Ingeniería Civil 157: 85-96.
Miller SJ, Wardrop DH, Mahaney WM, Brooks RP, 2006. A plant-based Index of Biological Integrity (IBI) for head-water wetlands in central Pennsylvania. Ecological Indi-cators 6: 290-312.
Munné A, Sola C, Prat N, 1998. Un índice rápido para la evaluación de la calidad de los ecosistemas de riberas. Tecnología del Agua 175: 20-37.
Munné A, Prat, N, Sola C, Bonada N, Rieradevell M, 2003. A simple field method for assessing the ecological qua-lity of riparian habitat in rivers and streams: a QBR in-dex. Aquatic Conservation: Marine and Freshwater Ecos-ystems 13: 147-163.
Naiman RJ, Décamps H, 1997. The Ecology of Interfaces: Riparian Zones. Annual Review of Ecology and Syste-matics 28: 621-658.
Naiman RJ, Décamps H, Pollock M. 1993. The role of ripa-rian corridors in maintaining regional biodiversity. Eco-logical Applications 3(2): 209-212.
NRC (National Research Council), 2002. Riparian areas: functions and strategies for management. National Aca-demy Press, Washington, DC, USA.
Peck D, Lazorchak JM, Klemm DJ (eds), 2003. Environ-mental monitoring and assessment program-surface ters: western pilot study field operations manual for wa-deable streams. US Environmental Protection Agency, Western Ecology Division, Corvallis, OR.
Poole GC, 2002. Fluvial landscape ecology: addressing uni-queness within the river discontinuum. Freshwater Bio-logy 47: 641-660.
Rankin ET, 1989. The Qualitative Habitat Evaluation Index (QHEI): Rationale, methods and application. State of Ohio – Environmental Protection Agency.
Raven PJ, Holmes NTH, Dawson FH, Everard M, 1998. Qua-lity assessment using river habitat survey data. Aquatic Conservation: Marine and Freshwater Ecosystems 8: 477-499.
Richter BD, Richter HE, 2000. Prescribing flood regimes to sustain riparian ecosystems along meandering rivers. Con-servation Biology 14(5): 1467-1478.
Rosgen D, 1996. Applied river morphology. Wildland Hydro-logy, Pagosa Springs, Colorado.
Salinas MJ, Blanca G, Romero AT, 2000. Evaluating ripa-rian vegetation in semi-arid Mediterranean water courses in the south-eastern Iberian Peninsula. Environmental Conservation 27(1): 24-35.
Sanz M, 2012. Mejora hidrogeomorfológica de masas de agua alteradas: el río Torote. Trabajo Fin de Grado, Uni-versidad de Alcalá (Madrid). 41 pp. + Annex. Unpublished. Schmidt LJ, Potyondy JP, 2004. Quantifying channel main-tenance instream flows: an approach for gravel-bed stre-ams in the western United States. US Department of Agri-culture, Forest Service, Rocky Mountain Research Station. 33 pp.
Sidle RC, Onda Y, 2004. Hydrogeomorphology: overview of an emerging science. Hydrological Processes 18: 597-602. Simón M, 2011. Seguimiento, evaluación y propuestas de restauración de los bosques de ribera en 10 tramos de los
ríos Guadarrama y Jarama en la Comunidad de Madrid. Proyecto del Master en Espacios Naturales Protegidos. Universidad Autónoma de Madrid. 111 pp. + Annex. Un-published.
Simonson TD, Lyons J., Kanehl PD, 1994. Quantifying fish habitat in streams: transect spacing, sample size, and a proposed framework. North American Journal of Fishe-ries Management 14: 607-615.
Stanley EH, Fisher SG, Grimm NB, 1997. Ecosystem expansion and contraction in streams. BioScience 47: 427-435.
Suárez A, 2012. Propuesta de recuperación ecológica de un LIC fluvial. Trabajo Fin de Grado, Universidad de Alca-lá (Madrid). 45 pp. + Annex. Unpublished.
Suárez ML, Vidal-Abarca MR, 2000. Aplicación del índice de calidad del bosque de ribera, QBR, a los cauces flu-viales de la cuenca del río Segura. Tecnología del Agua 201: 33-45.
Vannote RL, Minshall GW, Cummins KW, Sedell JR, Cus-hing CE, 1980. The river continuum concept. Canadian Journal of Fisheries and Aquatic Sciences 37:130-137. Winward AH, 2000. Monitoring the vegetation resources in
riparian areas. General Technical Report RMRSGTR-47. Ogden, UT: US Department of Agriculture, Forest Ser-vice, Rocky Mountain Research Station. 49 pp.
Woodward G, Hildrew AG, 2002. Food web structure in ri-verine landscapes. Freshwater Biology 47: 777-798. Zogaris S, Chatzinikolau Y, Dimopoulos P, 2009. Assessing