E.Tristán, I. Pavón, J.M. López
Universidad Politécnica de Madrid, Centro de Acústica Aplicada y Evaluación No Destructiva C/ Serrano, 144, C.P. 28006, Madrid, España.
e-mail: [email protected], [email protected],[email protected]
Abstract
The impact of noise on the acoustic quality of university facilities is a topic that has received little attention. The main external factors that influence a reduced acoustic quality are generally caused by sources such as traffic noise, public works, etc. Internally, the students themselves are the source of noise. Knowledge of the acoustic conditions of educational facilities allows us to create and develop strategies to improve the environment where students carry out their daily activities.
This work studied the acoustic quality in university facilities of different educational institutions of the Community of Madrid, Spain. Stereo recordings at diverse places inside of different university campus were made and a test was designed. The questionnaire was applied to university students while they were listening to the recordings. In a simple way for them, psychoacoustic parameters were associated and compared with the information obtained from the laboratory study.
1
Introduction
Until recently, neither the architects responsible for the design of schools, neither students and their parents were conscious about the negative effects of noise and the lack of acoustic treatment on the learning process. We can observe this kind of problems in developing countries where there are no culture and consciousness about this theme and where there also doesn’t exist any economic support to develop strategies and resolve this problem.
Throughout the day, students develop a lot of activities inside university facilities. They are themselves the main source of noise in this environment. At university there are usually places where we can find a big mass of students and thus where noise increases significantly. These are mainly places with inexistent acoustic treatment, which causes that students do not have enough acoustic comfort to develop their study activities.
When we did the field study, we observed that not only classrooms and libraries are used for study activities. Many other places such as hallways, halls and gardens are adopted as study places in an improvised way and are used for study activities but also to socialize with other students. This has direct consequences on the academic performance as well as on the physical and psychological health of students.
We can find a lot of research on this topic, but it mainly focuses on background noise levels, speech intelligibility, isolation and acoustic conditioning inside classrooms [1-4]. Specifically in the university sphere, there is little information available and it concentrates on the study of noise levels and exposure to noise. One of the researches studied the noise levels and the sound exposure experienced by different groups of people [5]. Only a small part of the participants were university students involved in different activities in different places. In other research, the noise levels, noise dose and sound exposure were studied during the activities of students inside university facilities during scholar time [6]. Both studies report noise and noise exposure levels that are not appropriate to develop study activities.
Noise annoyance is evaluated with objective and subjective methods. Currently, there are no regulations to evaluate the objective annoyance. This is the reason why different ways to determine the annoyance are used in many studies [7-15]. However, most of the studies use the method described by Fastl and Zwicker [16]. This method is based on the calculation of psychoacoustic parameters such as Loudness, Roughness, Sharpness and Fluctuation Strength. These four parameters result in another parameter that evaluates the annoyance known as Psychoacoustic Annoyance (PA). On the other hand, the subjective method is based on the application of questionnaires to people while they are listening to some sound clips previously recorded or while they are placed directly in the source of noise [17-20]. Different kind of surveys and different scales of evaluation were used in the existing studies. In order to standardize the evaluation of the response to noise, the International Commission of the Biological Effects of Noise (ICBEN) elaborated a method based on a survey that was developed in different languages. This survey is the result of the collaboration of different researchers from around the world [21, 22], and consists of two questions and each one of them has different scales (5 points verbal scale and 11 points numerical scale), which will be explained later on.
In this work we use both objective and subjective methods in order to have a better perspective of the sound conditions in places where students usually develop their daily activities.
2
Method
2.1
Scope of the study
The main aim of this work was to study the different acoustical conditions in different environments inside university facilities. We did this through the evaluation of psychoacoustic parameters such as Loudness, Roughness, Sharpness and Fluctuation Strength, and the use of a subjective method based on a survey.
Stereo recordings at diverse places inside of different university campus were made. Furthermore, to complement this work, a survey was designed in order to know the perspective of students of sound quality inside university facilities. The investigation consisted of four stages:
Stage 1. Recording of sound environments
Stage 2. Design of the survey
Stage 4. Application of the survey
Stage 3. Evaluation of the results
2.2
Participants
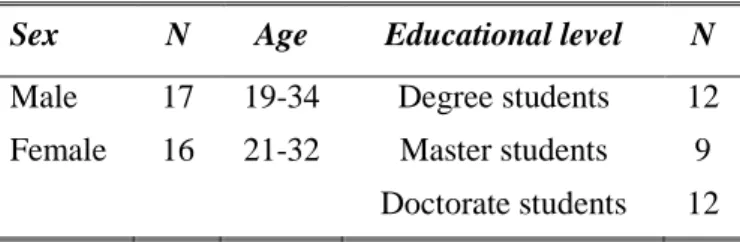
A total of 33 students (17 male, 16 female) from different universities of the Community of Madrid, Spain, with an age of between 19 and 34 years participated in the experiment. 12 of the participants were degree students, 9 were master students and 12 were doctorate students (Table 1). Before starting the experiment, we evaluated the current state of auditory health of the participantsaccording to AS ISO 8253.1-2009 Audiometric test methods, Part 1: Basic pure tone air and bone conduction threshold audiometry. The participants did not exceed 20 dB in the frequency range 125-8kHz.
2.3
Equipment and sound recordings
Sex N Age Educational level N
Male 17 19-34 Degree students 12
Female 16 21-32 Master students 9
Doctorate students 12
Table 1: Situation of participants
In previous research we designed a survey in order to have a general idea about the noise sources inside university facilities [6]. For this work, we used 1 question of this survey. The question was: “Which are
the places inside university facilities where you spend most of your time during your study period?”
The answers to that question were 10 different options that the responders had to order in importance. These options were common places inside university facilities such as classrooms during exams and lessons, hallways, common halls, libraries, lecture rooms, computer rooms, cafeterias and gardens. For this experiment we only used the recordings completed at the places where students usually develop their study activities: a classroom during an exam, a classroom during a normal lesson, a hallway adapted for studying, a library, a computer room and a common hall also adapted for studying.
2.4
Design and application of the survey
A survey was conducted to determine in a subjective way the most aggressive sound environments where university students usually develop their daily activities. The survey consisted of 6 questions of which 2 were related to annoyance in particular. The participants were questioned about the noise conditions inside the facilities recorded previously.
According to the ICBEN recommendations the question translated into English for the 11 points scale (Figure 1) was: “Next is a zero to ten opinion scale for how much the environmental sound heard in the recording bothers, disturbs or annoys you. If you are not at all annoyed choose zero, if you are extremely annoyed choose ten, if you are somewhere in between choose a number between zero and ten”
For the 5 points verbal scale (Figure 2) the question was: “In this recording, how much does the
environmental sound bother, disturb, or annoy you; Extremely, Very, Moderately, Slightly or Not at all?”
The questionnaire was applied to the participants while they were listening to the recordings inside an audiometric room. They were asked to take some time to listen to the recordings before starting to answer the questions in order to have a better sensation of the sound presented.
Figure 1: ICBEN 11 points scale
3
Evaluation of the results
3.1
Overall results
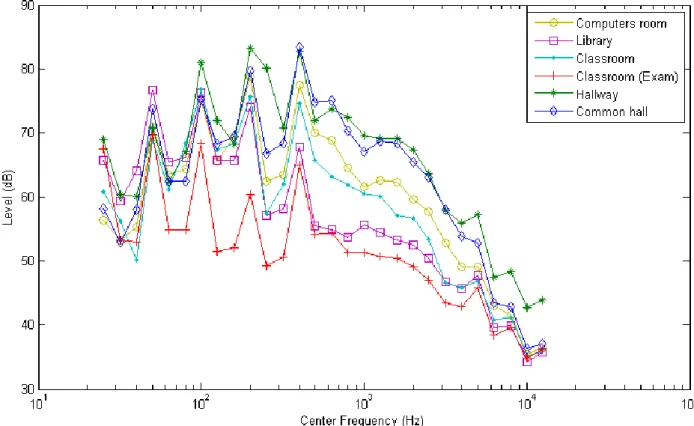
The recordings varied in duration from 1.28 to 2.00 min, and had overall sound-pressure levels of between 68.1 and 83.5 dB SPL (Table 2). Figure 3 shows the one-third octave spectrum of all environments.
Environment Time (min) SPL (dB)
Classroom (Exam) 01:28 68.1
Big library 02:00 76.5
Computer room 02:00 76.0
Classroom 02:00 72.6
Hallway 01:58 81.7
Common hall 02:00 83.5
Table 2: Sound clips used in the experiment
3.2
Sound quality evaluation
Previous to the analysis, the six sound clips were recorded with the head and torso simulator (HATS). The recordings and the subsequent analysis of the clips were performed using the psychoacoustic analyser Brüel & Kjaer Sound Quality type 7698. Psychoacoustic metrics such as Loudness (L), Specific Loudness (N’), Sharpness (S), Roughness (R) and Fluctuation Strength (FS) were obtained. Table 3 summarizes the results of the sound quality analysis for all clips recorded.
Environment L
(sones)
N’
(sones/bark)
S
(acum)
R
(asper)
F.S.
(vacil)
Common hall 46.75 2.01 1.31 1.58 1.28
Computer room 31.15 1.41 1.32 1.47 2.07
Classroom 23.50 1.19 1.36 1.58 2.01
Library 19.20 0.92 1.39 1.59 1.62
Hallway 43.28 2.25 1.39 1.64 1.96
Classroom (Exam) 16.55 0.75 1.65 1.70 2.06
Table 3: Results of psychoacoustic parameters
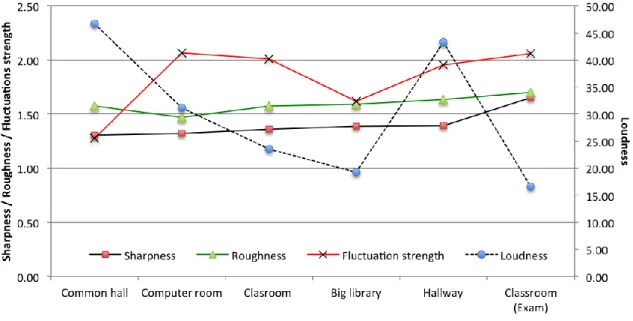
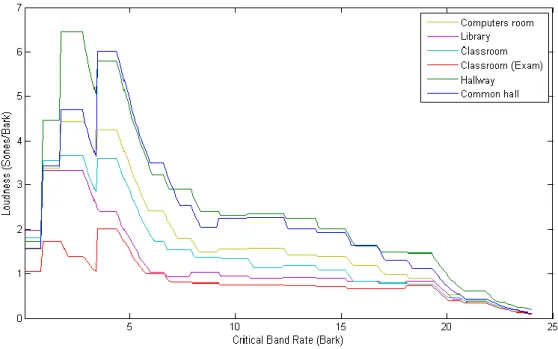
Figure 4 shows the psychoacoustic parameters for each environment recorded in a graphic. For Loudness we could observe that the minimum and maximum values correspond to the classroom during an exam and the common hall respectively. For Sharpness the minimum level was observed in the common hall and the maximum level in the classroom during an exam. In the case of Roughness we could observe the minimum value in the computer room and the maximum value in the classroom during an exam. Finally, the minimum value of Fluctuation Strength was registered in the common hall, while the computer room is the place with the maximum value. The minimum and maximum values of Specific Loudness (N’) correspond to the classroom during an exam and the hallway recordings respectively. Figure 5 shows the Specific Loudness for all the environments.
Figure 5: Specific Loudness (ISO532B) for all the environments
3.3
Psychoacoustic Annoyance evaluation
In order to describe quantitatively the Psychoacoustic Annoyance from the information obtained in the laboratory, the method proposed by Fastl and Zwicker [16] was used. Parameters such as Loudness (L), Sharpness (S), Roughness (R) and Fluctuation Strength (FS) were related to obtain the PA value with the next equation:
PA
=
N
5(
1
+
w
S2+
w
FR2)
(1)where
N5 is the percentile 5 of Loudness,
wS is the component where Sharpness is included,
if
S
>
1.75
w
S=
0.25
(
S
-
1.75
)
log
(
N
5+
10
)
if
S
£
1.75
w
S=
0
ì
í
ï
îï
(2)wFR is the modulation component where Fluctuation Strength and Roughness are included.
w
FR=
2.18
N
50.1(
0.4F
-
0.6R
)
(3)Furthermore, to characterize the loudness sensation through the loudness level, we used the Eq. (4).
L
N=
10
Table 4 shows the loudness sensation (LN), the percentile 5 of loudness (N5) and the Psychoacoustic Annoyance (PA).
Environment LN
(phones)
N5
(sones) PA Common hall 95.47 38.55 67.09
Computer room 89.61 20.40 39.60
Classroom 85.55 12.49 25.96
Library 82.63 16.21 33.57
Hallway 94.35 35.10 64.99
Classroom (Exam) 80.49 10.11 23.34
Table 4: Results of psychoacoustic parameters
3.4
Subjective annoyance
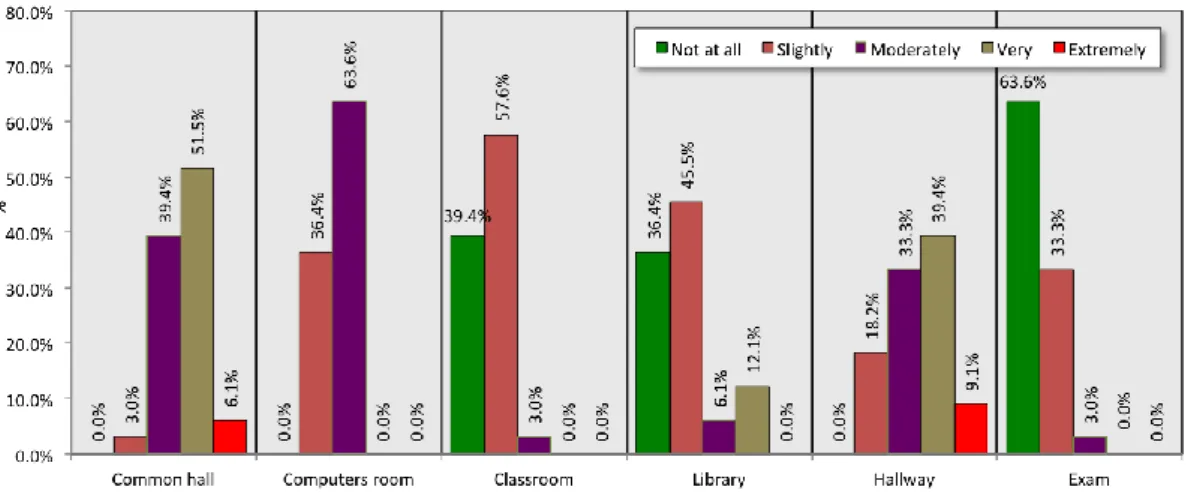
Table 5 and Figure 6 summarize the results of the question related with ICBEN 5 points verbal scale.
According to the results, 51.5% of the participants perceive that in general the common hall is “very” annoying (VA). Likewise, most of the participants (63.6%) consider that the computer room is “moderately” annoying. 57.6% of the participants express that the classroom during a normal lesson is “slightly” annoying (SA). The library is also considered as “slightly” annoying by 45.5% of the participants. On the other hand, the hallway is considered as the most annoying place. 33.3% of the participants consider the hallway as “moderately” annoying, 39.4% as “very” annoying (VA) and only 9% as “extremely” annoying (EA). The rest of the participants (18.2%) believe that this environment is “slightly” annoying. In the case of the classroom during an exam, 63.6% of the participants consider that this environment is “not at all” annoying (NA), while 33.3% consider this place as “slightly” annoying.
Not at all Slightly Moderately Very Extremely
Common hall 0.0% 3.0% 39.4% 51.5% 6.1%
Computer room 0.0% 36.4% 63.6% 0.0% 0.0%
Classroom 39.4% 57.6% 3.0% 0.0% 0.0%
Library 36.4% 45.5% 6.1% 12.1% 0.0%
Hallway 0.0% 18.2% 33.3% 39.4% 9.1%
Classroom (Exam) 63.6% 33.3% 3.0% 0.0% 0.0%
Table 5: Results of ICBEN 5 points verbal scale
For the ICBEN 11 points scale a summary of the results is shown in Table 6 and Figure 7. According to the results, the classroom during an exam is the place with the lowest annoyance. On the other hand, the common hall is the place that participants believe that is the most annoying place of all environments.
Figure 8 shows a comparison between the different values obtained for each environment for ICBEN 5 and those obtained for ICBEN 11. The blue line shows the ICBEN 11 results, the green line the ICBEN 5 points verbal scale results and the red line is the mean of both tests. The P value for ICBEN 5 vs. the P value for ICBEN 11 is P=0.2740 for P<0.05. It means that there are no significant differences and that there is a big correlation between both tests (R2=0.9931). This is shown in Figure 9.
Figure 6: Graphic of results for ICBEN 5 points verbal scale
Common hall
Computer
room Classroom Library Hallway
Classroom (Exam)
Mean 6.73 3.33 1.45 2.33 6.48 0.45
Max. 10 6 4 7 10 2
Min. 2 0 0 0 0 0
S.D. 2.11 1.42 1.18 1.78 2.72 0.56
Table 6: Scores of all sound clips for ICBEN 11 points scale
Figure 8: Comparison between annoyance rating of ICBEN 11 points and annoyance rating ICBEN 5 points verbal scale
Figure 9: Correlation between annoyance rating of ICBEN 11 points and annoyance rating of ICBEN 5 points verbal scale
Something interesting to mention is that when the objective annoyance (PA) decreases, the difference between the PA value and the value of the subjective study (ICBENs test) tends to increase.
These differences are shown in Figure 10 and summarized in Table 6. For example, in the case of the common hall (most annoying environment), the mean of the annoyance level between the studies is 66.1 and the difference is 1.92. On the other hand, the mean of the classroom during an exam (less annoying environment) is 14.9 and the difference is 16.69. This tendency is also shown in Table 6.
Slightly Moderately
Very
Extremely
Not at all
0 1 2 3 4 5 6 7 8 9 10 0 10 20 30 40 50 60 70 80 90 100
Common hall Computers room Classroom Big library Hallway Exam
A n n o y a n ce IC B E N 1 1 p o in ts sca le A n n o y a n ce IC B E N 5 p o in ts v er b a l sca le
Figure 10: Comparison between ICBEN mean and Psychoacoustic Annoyance (PA)
Figure 11: Correlation between ICBEN and objective Psychoacoustic Annoyance (PA)
Environment PA ICBEN1 Mean Difference 95% CI of diff. t P Significant?
Exam 23.34 6.65 14.9950 -16.6900 -39.80 to 6.419 3,047 P > 0.05 ns
Classroom 25.96 14.30 20.1300 -11.6600 -34.77 to 11.45 2,129 P > 0.05 ns
Library 33.57 22.53 28.0500 -11.0400 -34.15 to 12.07 2,016 P > 0.05 ns Computer
room 39.60 32.27 35.9350 -7.329998 -30.44 to 15.78 1,338 P > 0.05 ns Hallway 64.99 61.21 63.1000 -3.77999 -26.89 to 19.33 0,6902 P > 0.05 ns Common
hall 67.09 65.16 66.1250 -1.929993 -25.04 to 21.18 0,3524 P > 0.05 ns
1ICBEN 5 and ICBEN 11 mean, ns: no significant
3.5
Scale of annoyance
It´s very important to have a scale that can help to estimate the noise annoyance level in order to develop strategies to improve the acoustic conditions in the places we studied.
Based on the ICBEN recommendation, we propose a 5 levels scale to characterize the level of annoyance. Similar to the 5 points verbal scale, we used 5 ranges according to the intensity shown in the reaction modifier study for Spanish language proposed for ICBEN [21]: Level 1: not at all (0-3.61); level 2: slightly (3.62-23.55); level 3: Moderately (23.56-58.62); level 4: very (58.63-89.77); level 5: extremely (89.787-100). This scale is shown in Figure 12.
Using this scale and according to the results, we could situate the studied environments as follows. The classroom during a lesson and the classroom during an exam are located in the L2 area (slightly annoying). The computer room and the library are located in the L3 area (moderately annoying). The common hall and the hallway are situated in the L4 area (very annoying).
Figure 12: Proposed scale of annoyance
4
Conclusions
A study of the sound quality of environments inside university facilities was performed, especially of the places where students develop their study activities. The annoyance rating of six sound environments was obtained by completing an objective study through the analysis of psychoacoustic parameters obtained in the laboratory and by developing a subjective study through a survey.
We could observe a big correlation between ICBEN 5 and ICBEN 11 was observed. Similarly, there exists a big correlation between the mean of these tests and the Psychoacoustic Annoyance (PA) values obtained using the method proposed by Fastl and Zwicker. Furthermore, a tendency in the variation of the differences between objective and subjective results was observed. When PA decreases, the difference with the values obtained form the subjective study tends to increase. We could therefore think that at a higher PA level, there exists a higher perception of noise annoyance, but this statement requires a deeper study of the theme.
Based on the standardized general-purpose noise reaction questions for community noise surveys performed by ICBEN, a scale to define the level of annoyance was proposed. The final results show us that in general, the studied sound environments are moderately annoying. The application of the scale to the results gave us a better perspective of the conditions where students develop their activities.
It is definitely very important to have adequate acoustic conditioning in the places used by students for study activities, but we also want to stress the importance of developing strategies directed at students to increase their awareness of noise. The implementation of the proposed scale could be a substantial help to develop these strategies and the introduction of prevention measures could help to achieve good acoustic quality adapted to the ideal academic performance.
L5
L4
L3
L2
L1
89.78 - 100
3.62 – 23.55 23.56 – 58.62
References
[1] C. Crandell, Classroom acoustics for hearing-impaired children, Journal of the Acoustical Society of America, 92, 2470, (1992).
[2] C. Crandell, C. and J. Smaldino, Classroom acoustics for children with normal hearing and with hearing impairment. Language, Speech, and Hearing Services in Schools 31, 362–370, (2000).
[3] H. Knecht, H., Nelson, P., Whitelaw, G., & Feth, L., Background noise levels and reverberation
times in unoccupied classrooms: Predictions and measurements, AJA, 11, 65-71, (2002).
[4] M. Hodgson, R. Rempel and E.Park, Measurement of typical speech and background-noise Levels in university classrooms during lectures, Noise-con (1997).
[5] C. Díaz and A. Pedrero, Sound exposure during daily activities, Applied Acoustics 67, 271–283 (2006).
[6] E. Tristán, I. Pavón and J.M. López, University sounds environments, Proceedings of Euronoise 2012, Prague, 257-265, (2012).
[7] U.Jekosch, Meaning in the context of sound quality assessment, Acustica - Acta acustica 85(5), pp.681-684 (1999).
[8] H. Fastl, Neutralizing the meaning of sound for sound quality evaluations, in Proceedings 17th International Congress of Acoustics (ICA 2001), Rome, Italy (2001).
[9] W. Ellermeiera, A. Zeitlera and H. Fastlb, Predicting annoyance judgments from psychoacoustic metrics: Identifiable versus neutralized sounds, Proceedings of the The 33rd International Congress and Exposition on Noise Control Engineering, Internoise, Prague (2004).
[10]M. Andrew, Willemsen and D. Mohan, Characterization of sound quality of impulsive sounds using loudness based metric, Proceedings of the 20th International Congress on Acoustics, ICA 2010, 23-27 August, Sydney, Australia (2010).
[11]H. Fastl, Psychoacoustics and Sound Quality, In: Blauert, J., Communication Acoustics, Springer-Verlag, Berlin, Heidelberg, 139-162 (2005).
[12]H. Fastl, Recent developments in sound quality evaluation, In: Proc. ForumAcusticum 2005, 1647-1653, CD-ROM (2005).
[13]T. Kaczmarek and A. Preis, Annoyance of time-varying road-traffic noise, Archives of acoustics, 35, 3, 383–393 (2010).
[14] M.J.M. Nor, M.H. Fouladi, H. Nahvi, A.K. Ariffin, Index for vehicle acoustical comfort inside a
passenger car, Applied Acoustics 69, 343–353 (2008)
[15] S. Sandrock, B. Griefahn, T. Kaczmarek, H. Hafke, A. Preis, T. Gjestland, Experimental studies on annoyance caused by noises from trams and buses, Journal of Sound and Vibration 313, 908–919 (2008)
[16]H. Fastl and E. Zwicker, Psychoacoustics: Facts and Models, Springer-Verlag, Berlin, (2007).
[17] R.P. Leite, S. Paul, S.N.Y. Gerges, A sound quality-based investigation of the HVAC system noise of
an automobile model, Applied Acoustics 70, 636-645 (2009)
[18] B. Goujard, A. Sakout , V. Valeau, Acoustic comfort on board ships: An evaluation based on a
questionnaire, Applied Acoustics 66, 1063–1073 (2005)
[19] J.Y. Jeon, J. You, H.Y. Chang, Sound radiation and sound quality characteristics of refrigerator noise in real living environments, Applied Acoustics 68, 1118–1134 (2007)
[20]J.M. Fields, An update catalog of 521 social surveys of residents reactions to environmental noise
(1943-2000).
Noise Surveys: Research And A Recommendation, Journal of Sound and Vibration 242(4), 641-679, (2001).
[22]J.M. Fields, Recommendations for internationally shared noise annoyance questions, Internal document (1998).
[23]H. Fastl, From Psychoacoustics to Sound Quality Engineering. Proceedings of the Institute of Acoustics, Coventry, 143-156 (2003).
[24]P.J. Lee and J.Y. Jeon, Soundwalk for evaluating community noise annoyance in urban spaces,
Proceedings of the 9th International Congress on Noise as a Public Health Problem (ICBEN), Foxwoods, CT (2008).
[25]ISO 8253-1, Acoustics – Audiometric test methods, Part 1: Basic pure-tone air and bone conduction
threshold audiometry for hearing threshold levels down to 0 dB HL, (2009).