IntelCity, comprehensive management platform for
smart cities
N. Perez, J. Poncela, J.M. Moreno
Universidad de Málaga, Campus de Excelencia Internacional Andalucía Tech, ETSI TelecomunicaciónMálaga, Spain [email protected]
M. Memon
Institute of Business Management Karachi, Pakistan
Abstract— Modern cities contain a wealth of information that is usually scattered among a myriad of organisms. For citizens it is many times difficult and confusing to access this information. Cities must find a way to put all this information at the disposal not only of the citizens but any employee that takes part in the operation and maintenance of the city. One of the problems that appear is that each city department has organized its information independently of others, thus leading to an heterogeneous ecosystem of databases and platforms. This paper describes a solution to access all the information available in a city through a mobile platform. A customizable user application for the Android operating system is described. The solution can be deployed in any city as the application dynamically obtains the information from remote servers that hold access to the databases.
Keywords— Citizen management platform, smart city, transparency, Android application.
I. INTRODUCTION
Legacy cities are already characterized by the potential of collecting a wealth of data through a number of heterogeneous sensing infrastructures. Today this data is partly used for different, often isolated, application purposes. The trend will continue to be towards an ever increasing amount of data that will further enrich the overall “city knowledge” capabilities. Information will come from connected objects (sensors), from previously collected sources, as well as from “social sensing” applications.
One of the main questions is how to make this data available both to the public in general and to the very people responsible for the proper operation and management of the city infrastructure. This question is addressed in the IntelCity project.
A key part of the project is the design and development of a mobile application that allows traversing the available information about, and from, the services in the smart city. The goal is that any citizen of the community can access this information and interact with the existing services, increasing his/her quality of life. The application has been designed so that any city can use it to display its own specific information, as it dynamically provides the user with the various selectable reports in each city.
There are already several projects ongoing below this topic. For example, Indra, a global leading company, has developed a platform for smart cities, though it is more oriented towards the management of the city, and not designed to put information at the disposal of citizens [1]. Tissat has developed another platform with a citizen portal for administrative procedures; this system allows citizens to take part in the municipality decisions using secure mechanisms, to share information [2]. In general, it aims to improve transparency on all areas of a city. Smart Coruña [3] is targeted towards an integral management of the city, including areas such as energy efficiency, environment, mobility, eGovernment, etc.
Other projects aim to improve mobility issues within the city.Some examples are Ask-It [4], Caalyx [5] or Uniaccess [6]. These support requests on the optimal route from one point to another using different means of transportation (public transport, private vehicles, bicycle, on foot, …), which requires a thorough knowledge of the city. Some initiatives just broadcast what is occurring in the city [7].
The main novelty of the IntelCity project is that it aims to provide a framework in order to put all city information at the disposal of the public. Citizens will be able to access the system through different terminals, such as smartphones, PCs, tablets or even TVs. The design has been addressed so that all information present in the databases linked to the system can be browsed in any user platform.
This paper is organized as follows. Section II presents an overview of the system architecture. Section III explains the design, presenting the key design ideas, together with the software structure. Section IV provides a description of the classes that comprise the application.
II. ARCHITECTURE OVERVIEW
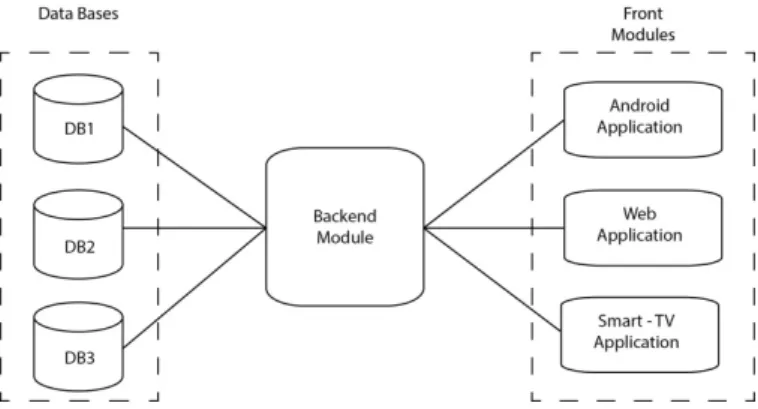
This heterogeneity is solved by implementing a back-end module that creates a uniform interface, hiding the complexities of the different database systems. This module extracts information in a fast, optimum way and provides a defined protocol for interacting with it.
A very simplified overview of the system is shown in Figure 1. The user interface is called the front module, and allows end users to browse the data held in any of the multiple information systems.
Fig. 1. Overview of the system architecture.
A. Information
The front application provides to the user two different types of information. First, it provides static information about the city itself, data that changes only rarely, and thus may be considered as static. Secondly, it allows accessing dynamic information related to each of the city`s public services, for example, schedules for garbage collection, car battery recharge points, public transport stops and schedules, pending maintenance operations, etc. The navigation inside the application is organized in three levels:
• First level: shows a list of areas related to city management(e.g. transport, quality of life, natural resources, etc.).
• Second level: shows a list of reports grouped in themed categories corresponding to the selected first-level area.
• Third level: shows filtering criteria controls to select a range of data in the selected second-level report.
When the application starts, the user can select the city service he wants to get information about from a wide variety of general interest areas; these services can be configured dynamically for each city. Within each service, there is a list of reports, organized in categories so that it is easy for the user to find one of them. After selecting a particular report, the application shows the corresponding information. There are four types of reports:
• Text: alphanumeric strings conveniently organized in a table. Each column in the table represents a field of information.
• Bar chart: used to display series of values or to compare two or more values.
• Pie chart: useful for the city managers and operators, mainly for analysis of the use of different services.
• Map: uses Google Maps service. Geolocation allows location placement when the information provided by the server does not include latitude and longitude coordinates but only a postal address, for example, displaying collection points for bicycles in the city.
B. Interfaces
The communication protocol between the front-end and the back-end modules follows a client-server model. The frontend generates an HTTP request which is answered by the back-end with the information to display for that data level. A request is triggered by the selection performed by the user at each of the navigation levels.
Each request begins with the instantiation of an Android AsyncTask class that creates an Http connection on a secondary thread in the background. Thus the main thread stays responsive to user input. Each request has an associated timeout; if no response is received, the request is canceled and a message of unavailability is shown to the user. The server processes each request and obtains the requested information from the databases.
The information is encoded in JSON (JavaScript Object Notation) format [9]. APIs for handling this data format are freely available in most platforms. Each response and request between the front-end and the back-end elements is encoded using this notation. The retrieved information is then cached locally. An example of a response is given in Figure 2, which shows the contents for a report on the level of utilization of city health centers.
{"title":"Health centers utilization", "description":"Level of utilization of city health centers",
"count":"7", "data":[
{"info":"Claudio Moyano","value":"73%"}, {"info":"Falla","value":"87%"},
...] }
Fig. 2. Example of JSON server response.
III. APPLICATION DESIGN
The application, in brief, allows users to have real-time control of all the existing services in the city regardless of their location.
Its main features are the following:
• Organizes the information in categories, which in turn are broken down in groups of reports. These are shown as drop down menus.
• Displays information in a compelling format to suit the user needs.
• Allows sending suggestions and requests for new reports to the manager of the application through e-mail.
In this section, we explain the development of an Android application which acts as the front-end, that is, the user interface. The application has also been ported to other platforms such as web browsers and Smart TV.
A. Key Design Ideas
The design has been carried out taking into account the following key ideas:
• Heterogeneous devices: The application must run in devices with different physical characteristics, from small screens, such as 4.7”, up to tablets with 9”-10.1”.
• Base class: All classes that implement an screen in the graphical user interface are derived from the Android SherlockActivity class. This class belongs to the Sherlock library, which supports the use of action bars. which were introduced in Android in version 3.0 (API level 11), in Android versions down to version 2.1.
• Fragments: A fragment is an Android component that simplifies the design of the user interface when the same executable is used for smartphones (screen usually smaller than 7”) and tablets. The application makes use of this type of component to improve the user experience.
• Styles: The visual style of the user interface may be easily customized, as all styles (font, size, color, etc.) have been defined in a separate styles.xml file.
• Language selection: The application supports different languages, and can add as many as needed. This has been implemented via the Android mechanism, that only requires grouping all strings in one file and naming it with the proper suffix. The user can select the language by pressing in the flag icons that appear on the screen or in the configuration options screen.
• Main and background threads: The user interaction is performed in the main thread. However, any long processing operation may block this thread; so, to keep quality of experience at a high level, any processing that may take longer than 2-3 seconds is executed in a background thread, for example, interactions with the remote server.
B. Development Environment
The Eclipse framework has been used for the development. The Android SDK and packages for the corresponding targets are also needed. The android emulator and real devices, both smartphones and tablets, have been used for testing and debugging.
We have used other external libraries to support functionalities lacking in the Android API, an action bar in versions previous to version 3.0, audio playback or graph representation. These libraries are the following:
• achartengine.jar: Library for graph representation. It is free and provides support different types of graphs; labels and legends can be configured.
• actionbarsherlock.jar: Implements the action bar for versions before Android 3.0.
• activation.jar, addititonal.jar and mail.jar: Provide support to send e-mails in a user seamless way. It uses a background thread for the processing. Requires configuration of the e-mail server static parameters (address, port, e-mail account, password, etc.) and the call must include the e-mail typical fields.
• jl1.0.1.jar: Supports audio playback. The audio file must be located in the ‘res/raw’ application folder.
C. Software Structure
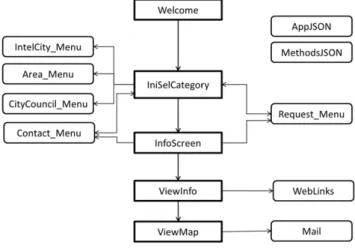
Figure 3 shows the classes that compose the application. There are five main classes and nine auxiliary ones. Each of the main classes handles one of the screens of the application. Additionally, each screen is complemented with an action bar and an options menu.
The vertical flow shown in the middle of the figure also depicts the main application flow. The left column in the diagram represents the section "Information" of the application, while the right column shows the supporting classes. Classes AppJSON and MethodsJSON are essential. Whenever the user changes from one screen to another, the information to display must be requested from the back-end; this information, as previously mentioned, is encoded in JSON format, which is handled by these two classes, both for the request and the response.
Fig. 3. Class Diagram.
Additionally, screens are often complemented with additional functionality:
• Request of new reports: users can request the addition of new reports that they consider should be provided in a particular service. This mechanism allows to improve the application based on real user needs.
constrained with application custom criteria to get accurate results. The server suggests a list of websites and a list of keywords; the user can request a query in any one of the websites with any of the suggested keywords.
• Access to static information: used to provide access mainly to general information about the city. Users can select the main screen tab with "Information" label to access this data. The application, then, displays a new menu with sections such as Welcome, Climate, Events, Contact, etc.
• Suggestions: allows the user to send suggestions or complaints to the system administrator in order to improve the service offered by the application.
• Additional options: in the option menus of each screen there may be additional options specific for that screen.
IV. IMPLEMENTATION
This section describes the code that has been implemented.
A. Main Classes
The main points of the classes that make up the application are explained next. These classes inherit from the SherlockActivity class.
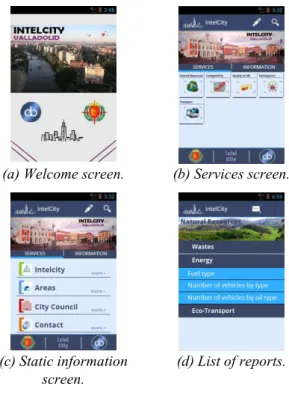
(a) Welcome screen. (b) Services screen.
(c) Static information screen.
(d) List of reports.
Fig. 4. Different application screens.
Welcome.java: it is the initial class of the application. It displays the welcome screen (see Fig. 4-a). After a few seconds it launches the next class, called IniSelCategory. The user does not have any interaction with this class, it's just a welcome screen. It retrieves in the background, from the server, the list of services that will be shown in the next screen.
IniSelCategory.java is the main class (see Fig. b and 4-c). It contains two tabs which provide access to the dynamic and the static information. In the first tab, users can choose a service from the list retrieved from the server. The second tab provides access to the static information.
InfoScreen.java displays the list of reports organized in categories corresponding to the selected service in the previous class (see Fig. 4-d.). Each category title is a dropdown menu. It also has some additional features, accessible through the options menu, such as the capability to send suggestions to the administrator of the application or send requests for new reports.
ViewInfo.java is used for graphical representation of
information. When a user selects a report in the previous class, this new class is called to display the information. As mentioned before, it uses different types visualization (see Fig. 5), such as tables, bar charts or pie charts. Maps are handled in a separate class, explained next. It allows configuring the graphical representation, for example, zooming in and out, or filtering data, using criteria such as dates or text.
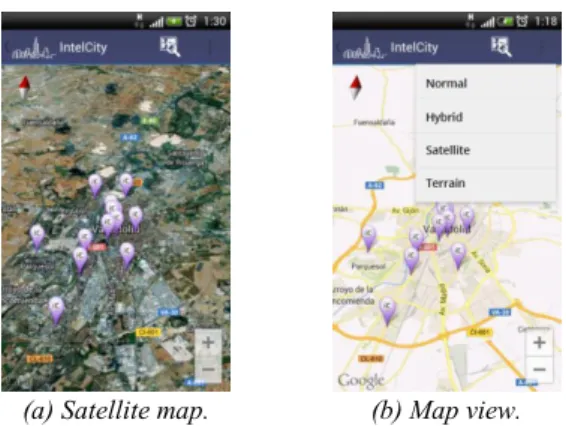
ViewMap.java handles the representation of geographic
maps. Due to the use of support.v4 library for backward compatibility with versions of Android OS previous to 4.0, it must inherit from a specific class type, SherlockFragmentActivity. This class can contain fragments, which are needed to use Google maps API v2 for Android. For this reason, it has been implemented as a separate class from ViewInfo. It also provides specific options related to the map view, such as customizing the view (normal, land, satellite, hybrid). Selecting any of the icons displayed in the map (overlays) opens a dialog, on top of the map, with extended information on the selected item.
(a) Text tables (b) Bar chart (c) Pie chart Fig. 5. Different report visualizations.
The addresses to overlay in a map may have different formats (street, postal code, latitude and longitude coordinates, etc.). It is then necessary to perform a geocoding procedure on them in order to retrieve the proper representation data. Android OS itself manages these requests so that, until it receives the response to a request, it does not issue the next request; thus, it may make some time to obtain and display the coordinates of all addresses. However, care must be taken, as the geocoding Google server imposes a limit of around 3 requests per second1.
1 Google does not declare a strict limit, but our tests show this
(a) Satellite map. (b) Map view. Fig. 6. Geographical visualization.
B. Supporting Classes
The other classes that comprise the application are explained next.
AppJSON.java
This class contains global variables that are used in all activities and internal structures that store the server information. It inherits from the Application Android base class.
public class JSON1 {
private int count;
Data1[] data;
public void MaxElem(int maxElem) {
data = new Data1[maxElem];}
public int GetNumSer() {
return count;}
public void SetNumSer(int numServ) {
count = numServ;}
public int GetIdSer(int i) {
return data[i].service;}
public void SetIdSer(int i, int id) {
data[i].service = id;}
public String GetTitle(int i) {
return data[i].title;}
public void SetTitle(int i, String title) {
data[i].title = title;}
public int GetLength() {
return data.length;} }
Fig. 7. Data storing class.
MethodsJSON.java
Handles the connections to the data server and the retrieval of the information stored in it. It contains a number of methods able to open an Http connection and then parse the corresponding JSON received from the server. The parsing depends on the class that generated the request.
Other classes
Class Mail.java allows sending e-mails to the administrator of the application in an anonymous way. It is not associated with a graphical interface. This mechanism is employed to transmit user suggestions or, transparently to the user, report erroneous addresses in the map visualization.
Class WebLinks.java displays the list of websites that may be linked to each of the reports provided by the application. Other classes handle user input to different menu options.
Local data structures are stored in a class derived from the Android Application class, so that other classes can access these data. They have no behavior as they just serve as data containers.
V. CONCLUSION
The mobile terminals are finally beginning to permeate society. We can see change after change every day. Cities are starting to take notice that it is possible to simplify many of the day-to-day processes in a city. In particular, information that previously was only accessible at certain points and to certain people can be put at the disposal of any citizen, helping improve their relationship with the city managers, as well as to the work crews that operate in the city. The application described in this paper is a first step to develop a configurable interface for this purpose. The control remains at all times within the city managers, thus any critical data may be restricted to those with the proper authorization.
ACKNOWLEDGMENT
This project has been funded by Abaccus Soluciones S.A. and CDTI within the Iberoeka call, project number IDI-20110779 [8]. We thank Abaccus Soluciones S.A. and the Department of Mathematics Applied to Information Technologies of UPM for their work as partners in this project.
REFERENCES
[1] Atenea, plataforma urbana de Indra para gobernar Smart Cities, http://www.indracompany.com/prensa/actual-indra/edition/2013/1/nace-atenea-la-plataforma-urbana-para-gobernar-smart-cities-16218, 2012. [2] Tissat lanza la plataforma Smart City para ciudades inteligentes,
Espaitec, http://www.espaitec.uji.es/51099_es/Tissat-lanza-la-plataforma-Smart-City-para-ciudades-inteligentes/, 2012.
[3] Smart Coruña, Coruña Futura,
http://coruna.es/servlet/Satellite?argIdioma=es&c=Page&cid=13401547
20718&pagename=Core%2FPage%2FGenerico-Page-Generica#&panel1-2, 2012.
[4] Ambient Intelligence System of Agents for Knowledge-based and Integrated Services for Mobility Impaired users, http://www.ask-it.org/, 2008.
[5] Caalyx, Complete Ambient Assisted Living Experiment, http://www.caalyx.eu/, 2007.
[6] Uniaccess, Design of Universal Accessibility Systems for Public Transport, http://www.transport-research.info/web/projects/project_details.cfm?ID=36287, 2006.
[7] Webcam listing, Live Malaga,
http://www.malagaturismo.com/malagadirecto/index.php?modulo=visita ntes&accion=listado, 2011.
[8] IntelCity, Integral Platform for the Management of Smart Cities, http://www.abaccus.es/productos/urbanet/?lang=es, Iberoeka Project, 2012.