1
Mechanism of stabilization of dicalcium silicate
solid solution with aluminium
Ana Cuestaa, Miguel A. G. Arandaa,b, Jesús Sanzc, Ángeles G. de la Torrea, Enrique R. Losillaa *
aDepartamento de Química Inorgánica, Cristalografía y Mineralogía, Universidad de Málaga,
29071-Málaga, Spain.
bCELLS-ALBA Synchrotron, Carretera BP 1413, Km. 3.3, E-08290 Cerdanyola, Barcelona, Spain
c
Instituto de Ciencia de Materiales de Madrid (ICMM), Consejo Superior de Investigaciones Científicas (CSIC), Cantoblanco, 28049-Madrid, Spain
* Corresponding author: Dr. Enrique R. Losilla, r_losilla@uma.es, Telephone: +34-952134234, Fax: +34-952137534
KEYWORDS: PC-SOFC, Mixed oxide and proton conductor, aluminum doped dicalcium silicate
ABSTRACT:
2
1. Introduction
Oxides that exhibit significant proton conductivity at elevated temperatures are candidates for different electrochemical applications, such as hydrogen sensors, membranes for hydrogen production and proton conducting solid oxide fuel cells (PC-SOFC).1-5 The most studied ceramic proton conductors are those based on cerates BaCeO3 and zirconates BaZrO3 with perovskite type structure (ABO3). Oxygen vacancies are introduced into the perovskite structure by aliovalent doping, i.e. partial replacement of cerium or zirconium by Y3+, Yb3+, Gd3+, Nd3+, etc. 6-12 The proton conduction in these materials occurs either via the hydration of oxygen vacancies after the material is exposed to water-containing atmospheres (Ec. 1) and/or by reduction of oxide ions in the lattice (Ec. 2).
x O O
O v 2OH
O O(g)
H2 (Ec. 1)
2e' OH 2 2O (g)
H2 Ox O (Ec. 2)
As part of the efforts to find suitable alternate electrolyte materials for PC-SOFCs, we have reported a new family of oxide ion conductors based on tricalcium oxy-silicate. 13,14 Ca3SiO5 (alite in cement nomenclature) is the main constituent of ordinary Portland cements (OPC), this phase contains some oxide anions which are only bonded to the calcium atoms forming rows that are the responsible for the oxide conductivity properties. Tricalcium silicate also shows a small p-type electronic contribution under oxidizing conditions and display an important proton contribution under humidified atmosphere. The possibilities of aluminum substitution in the tetrahedral site have been studied14, oxygen vacancies can not be stabilized by partial substitution of silicon by aluminum since Ca3(SiO4)1-x(AlO4)xO1-x/2x/2 series is not formed. The aluminum doping in this system is achieved by substitution at both calcium and silicon sites rendering a fixed oxygen content series: Ca3-xAlx(SiO4)1-x(AlO4)xO 0.0x0.03.14 The electrochemical characterization indicates that these compounds are oxide anion conductors with a small contribution of p-type electronic conductivity.
3
structure19-22, but is essentially nonreactive with water. 'L and 'H orthorhombic phases are stable at high temperatures.23 It is noteworthy, that → polymorphic transformation on cooling is disruptive with a change of 12 vol%. This effect is called “dusting” as it degrades refractory materials24 and can be avoided by chemical, thermal and mechanical treatments.16,25 The crystal structures and relative stabilities of the dicalcium silicate polymorphs have been studied from atomistic simulations.26 Furthermore, the role of some impurities has also been studied by theoretical tools.27,28
The framework of silicon tetrahedra is very similar among these polymorphs, while the arrangement of calcium cations is slightly different. The crystal structure of -C2S has two calciums in regular six-coordinated oxygen environments. Meanwhile, the crystal structure of -C2S has two calciums surrounded by eight oxygens in distorted environments. Moreover, the crystal structures of 'H- and
- polymorphs have calcium cations in both eight and nine irregular coordination.16,21 It is important to know that there are experimental evidences that an increase of the calcium coordination number seems to enhance the water reactivity.29 Nevertheless, crystal chemical stabilization is obtained by the addition of suitable “stabilizers” which are responsible of the actual reactivity.16
The effects on chemical-stabilizing ions on the stability of -C2S have been extensively investigated,16,30,31 and several theoretical predictions have been made about which ions can stabilize -C2S (B2O3, Al2O3, Na2O, K2O, BaO, MnO2, Cr2O3 or their combinations).32-37 Gao-Chao
et al 37 found that the forming amount of -C2S depended on varieties of dopant ions and the composition stoichiometry in the samples; although these authors did not state the mechanism and the extension of the formed solid solution. The stabilizing ability of the ions varied significantly, and the cations Al3+ were quite effective in stabilizing the -phase over a wide range of doping concentrations, i.e. 4-10 mol %.29,37 Recently, we have reported a study of the doping mechanism of B and Na/B in belites.38 The experimental results support the substitution of silicate groups by tetrahedral borate groups with the concomitant substitution of calcium by boron for charge compensation, Ca2-xBx(SiO4)1-x(BO4)x 0.0x0.10. This doping mechanism is similar to that already reported for aluminium doping in alite.
4
revealed that the oxygen variable samples can be prepared but the fixed oxygen content series is not stabilized. Electrochemical characterization allowed us to establish the nature of conductivity.
2. Material and methods
2.1 Synthesis-sintering conditions.
Two silicate series have been prepared: i) Ca2(SiO4)1-2x(Al2O7)xx (x=0, 0.010, 0.014, 0.03),
hereafter labelled as Ca2Si1-2xAl2xO4-xx (Ca2Al2x) and ii) Ca2-xAlx(SiO4)1-x(AlO4)x, (x= 0.03 and
0.05) hereafter labelled as Ca2-xAlxSi1-xAl2xO4 (Ca2-xAl2x). These compounds were synthesized by
reaction sintering using high purity oxides and carbonates as starting materials: CaCO3 (99.95%-100.05% from Alfa Aesar), SiO2 (99.7% from ABCR) and -Al2O3 (99.999% from Alfa Aesar). Raw mixtures were ground in a Fritsch ball mill (model Pulverisette 7, 45 cm3 agate vessel containing 7 agate balls with a diameter of 15 mm) during 30 min at 200 rpm with reverse rotation each 10 min and preheated at 1050ºC for 4 hours (heating rate of 10 ºC·min-1) in order to prepared 5 g of each sample. Under these conditions, only partial reaction takes place. The resulting powders were reground in a planetary ball mill, pelletized (10 mm diameter, 1 mm of thickness, 500 MPa) and a second thermal treatment was carried out at 1500 ºC for 6 hours (heating rate of 10 ºC·min-1) before being slowly cooled (thermal dissipation). Compaction was calculated taking into account the pellet mass, volume and the crystallographic density. Three pellets were prepared under identical experimental conditions: one (after grinding) for the diffraction study, a second one for impedance characterization, and a third one for the microstructure characterization.
2.2. X-ray powder diffraction.
All compounds were characterized by laboratory X-ray powder diffraction (LXRPD) at room temperature. The powder patterns were collected on a PANalytical X´Pert Pro MPD automated diffractometer (PANalytical) equipped with a Ge(111) primary monochromator and the X´Celerator detector. The overall measurement time was approximately 4 h per pattern to have good statistics over the 10 to 140º (2) angular range, with 0.017º step size. Structural analyses were performed using GSAS suite of programs.39 Final global optimized parameters were: background coefficients, zero-shift error, cell parameters and peak shape parameters using a pseudo-Voigt function40 corrected for axial divergence.41
5
Thermogravimetric analysis (TGA) data were recorded on a SDT-Q600 analyzer from TA instruments (New Castle, DE). The temperature was varied from RT to 1000 ºC at a heating/cooling rate of 5 ºC·min-1. Different heating/cooling cycles were carried out to study the thermal reversibility and reproducibility of the measurements. Measurements were carried out on samples in open platinum crucibles under a mixture flow of dry-air (10 mL/min) and wet-air (15 mL/min) saturated by bubbling in water at 20 ºC.
2.4. Microstructural characterization and conductivity measurements.
The microstructure of the ceramics was observed by scanning electron microscope (SEM) (Jeol JSM-6490LV) combined with energy dispersive spectroscopy (EDS). Platinum electrodes were made by coating opposite pellet faces with METALOR® 6082 platinum ink and heating to 800 ºC at a rate of 5 ºC·min-1 for 15 min in air to decompose the paste and to harden the Pt residue. Impedance spectra were obtained using a frequency response analyzer (Solartron 1260) in different dry and wet gases (N2, O2) in the 0.1 Hz to 1 MHz frequency range with an ac perturbation of 100 mV. The spectra were recorded upon cooling from 900 to 500 °C with a stabilization time of 10 minutes between consecutive measurements. Impedance spectra were analyzed with ZView program.42 The resistance and capacitance values of the different contributions were obtained by fitting the impedance spectra data with equivalent circuits. The equivalent circuit consisted of (RQ) elements in series, where R is a resistance and Q is a pseudocapacitance in parallel.
The overall conductivity as a function of oxygen partial pressure [p(O2) from air to ~10-20 atm] were performed in a closed tube furnace cell. The p(O2) values were monitored by using a YSZ oxygen sensor, placed next to the pellet in the cell. The conductivity was continuously recorded as a function of p(O2). The process consisted on flushing the system with dry 5%H2-Ar gas mixture at 900 to reach a minimum in oxygen activity inside the furnace and to ensure that the sample was close to the equilibrium. Then, the gas flow was switched off and the oxygen partial pressure slowly recovers to atmospheric pressure by free diffusion, since the system is not fully airtight. The isothermal cycle took over 48 h to complete.
2.5. 27Al Magic Angle Spinning Nuclear Magnetic Resonance (MAS NMR).
27
6
3. Results and discussion
3.1. Single phase existence ranges.
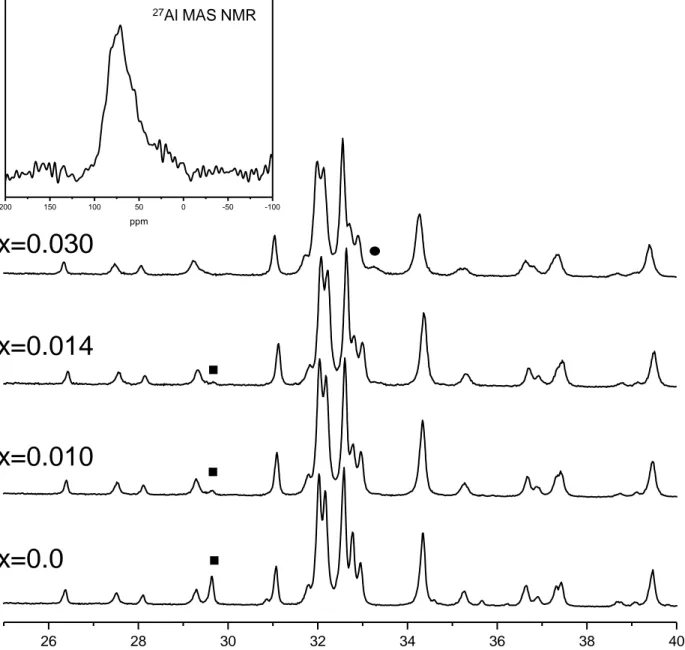
Reaction sintering is a particular type of sintering process in which both chemical reaction of starting compounds and densification are achieved simultaneously in a simple heating step. It has been employed to simplify the processing of the ceramic pellets. After sintering, the pellet were ground and studied by LXRPD and their patterns were analyzed by the Rietveld method using the structural description reported by Mumme et al.43, for -form. Concerning Ca2Si1-2xAl2xO4-xx Ca2Al2x family, the dominant phase under our synthetic conditions was the -C2S, see Figure 2. Two secondary minor phases, Ca3Al2O6 (PDF 70-0839; ICSD 1841) and γ-C2S (PDF 01-086-0397; ICSD 200707) were observed at higher and lower x values, respectively. It is important to underline that this thermo-mechanical treatments at high temperature ensure the absence of free lime, CaO, showing that the reaction was completed. Rietveld refinements were performed by refining only the overall parameters and weight fractions of all the phases. Atomic parameters were not optimized as final Rietveld disagreement factors were low enough, RF ~ 2%. As an example of the refinement qualities, the Rietveld plot of Ca2Al0.028 is shown in Figure 3. Table 1 gives weight fractions of side phases as well as the refined unit cell volumes of the series. The volume increases along the series, as expected, as Al3+ has a larger ionic radius than that of Si4+. This result confirms the partial substitution of silicon by aluminum. From the modifications observed in the powder patterns, Figure 2, it is clear that aluminum is being incorporated into the belite structure with a concomitant oxide vacancies formation. In any case, the compositional limit of the series must be close to x=0.014 under the reported synthetic conditions. 27Al MAS NMR spectra for Ca2Al0.028 sample is shown in the inset of Figure 2. The band located close to ~ -70 ppm is ascribed to tetrahedral environments;44 Al with pentahedral or octahedral coordination is absent in this sample.
All attempts to synthesize Ca2-xAlxSi1-xAl2xO4 (Ca2-xAl2x) compounds by solid state reaction were
unsuccessful; even high values of aluminium were not able to warn the formation of -C2S. The presence of this phase was confirmed, in addition to the powder diffraction study, as after the reaction sintering process the pellets became powder. Consequently, this series was not further
characterized.
7
for tricalcium silicate, in which aluminium substitutes both calcium and silicon to stabilize the high temperature polymorphs, without the formation of oxygen vacancies. Theoretical studies are needed to explain the different mechanisms of Aluminium doping in alite and belite.
3.2. Termogravimetric analysis.
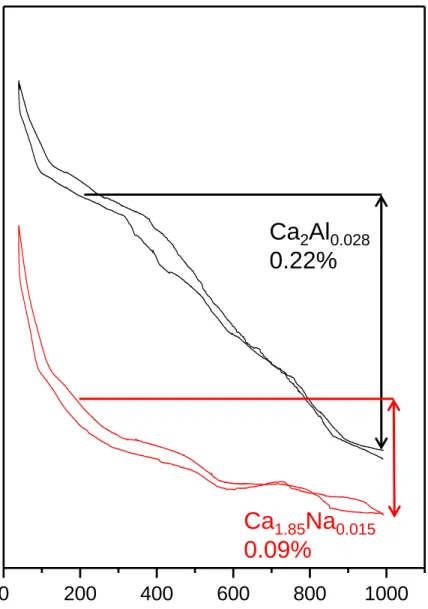
Ca2Si0.972Al0.028O3.9860.014 and Ca1.85Na0.15(SiO4)0.85(BO3)0.15 (a related sample38 without vacancies) were studied by thermogravimetric analysis to evaluate the influence of Al-substitution and the consequent increase of vacancy concentration on the incorporation of water in the structure. Water uptake depends on the available oxygen vacancies in the structure and therefore differences are expected depending on the vacancy contents. The thermogravimetric measurements recorded under humidified air showed reproducible curves on both cooling and heating cycles, see Figure 4.
The trace of Ca2Si0.972Al0.028O3.9860.014 shows the typical behavior of a proton conducting material with weight increase upon cooling due to water uptake and the formation of protonic defects, according to the hydration of oxygen vacancies (Eq. 1). For these samples the water uptake increases with the oxygen vacancies content from 0.09 wt% (0.82 mol%) for Ca1.85Na0.15 (no
vacancies) to 0.22 wt% (2.1 mol%) for Ca2Al0.028 due to the large concentration of oxygen
vacancies (1.4 mol%). The higher water content retained respect to the theoretical value is likely
due to adsorbed water, in fact, Ca1.85Na0.15 retains some water and do not have vacancies. These
results further confirm that Al is incorporated in the belite framework with the concomitant oxygen
vacancy increase.
3.3. Electrical characterization
As mentioned above, the family Ca2Al2x was used to perform the electrical characterization. The
sintering conditions used to prepare the ceramic pellets led to very dense specimens with relative densities ~ 90%. Weight losses due to possible cation evaporation were not detected during the sintering process. Figure 5 shows the SEM micrograph obtained for a representative sintered pellet with composition Ca2Al0.028. The pellet exhibits low porosity and no indications of liquid phase formation or phase segregation at the grain boundaries were observed.
8
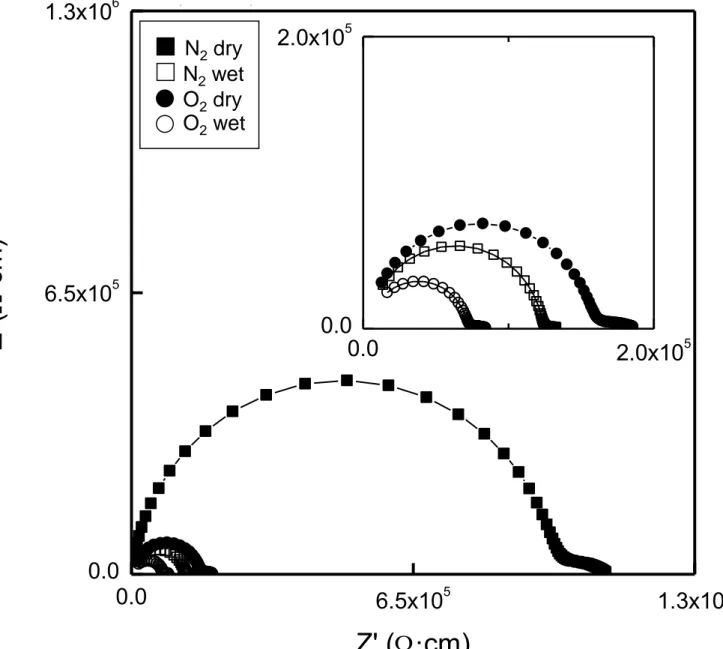
processes respectively. The resistance of bulk contribution decreases with increasing the water partial pressure, which confirms the existence of proton conduction in this material.
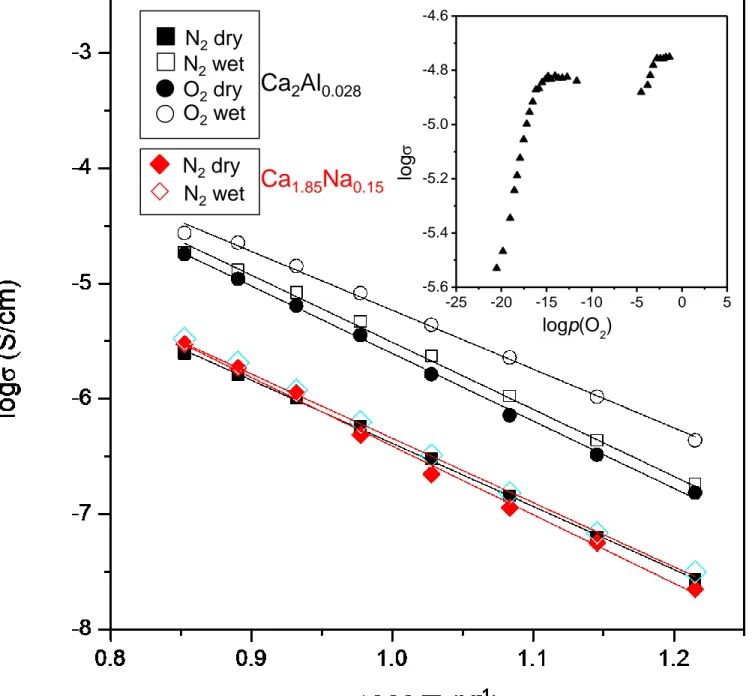
Figure 7 shows the Arrhenius plots of overall conductivity for the Ca2Si0.972Al0.028O3.9860.014 sample under different atmospheres. It is clear from that figure that the conductivity in wet atmospheres is always higher than in dry conditions in the whole studied temperature range, supporting that the sample exhibits proton conductivity. The total conductivity values for Ca2Al0.028
at 900 ºC were 2.7·10-5 and 2.5·10-6 S·cm-1 in wet O2 and dry-N2, respectively. These values are
quite similar to aluminium doped tricalcium oxysilicate: 5.6·10-5 and 8·10-5 S·cm-1 for
Ca2.985Al0.015(Si0.985Al0.015O4)O and Ca2.93Mg0.07(Si0.98Al0.02O4)O0.990.01, respectively; although
these samples have different crystal structures.13,14
On the other hand, the values of conductivity in N2 (dry or wet) are lower than those in O2 (dry or wet), this behavior can be mainly ascribed to the temperature-variation of a small p-type contribution, which develops under oxidizing conditions like in aluminum-doped tricalcium oxysilicate.13,14 The Arrhenius plots for all studied compositions fall on a set of approximately parallel lines with activation energies ranging between 1.0 and 1.1 eV. These values are close to those previously reported for similar compositions which are typical of mixed proton-oxide conductors. The conductivity in wet N2 is almost one order of magnitude higher than in dry N2; furthermore, this proton contribution is very important even at high temperature. This indicates that a minor fraction of water remains in the structure even at very high temperature under a humidified atmosphere in agreement with thermogravimetric measurements. Figure 7 also displays the conductivity of the related compound Ca1.85Na0.15(SiO4)0.85(BO3)0.15 without oxygen vacancies. As it can be observed, Al-substitution enhances significantly the ionic conductivity of these materials above 500º C likely due to oxygen vacancies. The ionic conductivity for a pure oxide ion conductor is independent of the oxygen partial pressure in a wide range of p(O2) values. However, the conductivity increases for a mixed ionic-electronic conductor as p(O2) increases or decreases, depending on the predominant electronic contribution (p- and n-type, respectively). The variation of the overall conductivity for Ca2Si0.972Al0.028O3.9860.014 sample at 900ºC as a function of p(O2) is shown in the inset of Figure 7.
9
a decrease in the proton contribution because the oxygen partial pressure is not constant during the experiment.45 It must be highlighted that decreasing the oxygen partial pressure induces a lowering in the water partial pressure. This result also indicates that proton contribution in these materials is significant up to 900 ºC and a similar trend has been already reported for other solid electrolytes, i. e. La2Zr2O7, SrZrO3, BaCeO3 1,45-48 and Ca3SiO5-based materials.13,14
4. Conclusions
Aluminium is incorporated into the framework of dicalcium silicate and stabilize the -form by replacing the silicate units and generating oxygen vacancies, Ca2Si1-2xAl2xO4-xx, up to x ≤ 0.014.
Aluminium substitution at both calcium and silicon sites, Ca2-xAlx(SiO4)1-x(AlO4)x, is not formed,
conversely to the aluminium doping in tricalcium oxysilicate. Thermogravimetric measurements collected under humidified air showed reproducible curves on both cooling and heating cycles. For these samples the water uptake increases with the oxygen vacancy content, as expected. The incorporation of Al3+ increases the oxygen vacancy concentration in the structure and enhances the ionic conductivity. The Arrhenius plots fall on a set of approximately parallel lines with activation energies ranging between 1.0 and 1.1 eV. These values are typical for mixed proton-oxide conductors. The conductivity in wet N2 is almost one order of magnitude higher than that in dry N2; furthermore, this proton contribution is very important even at very high temperature. This indicates that a minor fraction of water remains in the structure even at very high temperature under a humidified atmosphere. Ionic conductivity measurements as a function of the oxygen partial pressure support proton conductivity and a small p-type electronic contribution under oxidizing conditions.
Acknowledgment
This work has been supported by Spanish Ministry of Science and Innovation through MAT2010-15175 research gr (Spain) through the P10-FQM-6680 research grant.
References
10 3 K.D. Kreuer, Annu. Rev. Res., 2003, 33, 333-359. 4 T. Norby, Solid State Ionics, 1999, 125, 1-11.
5 N. Bonanos, K.S. Knight and B.Ellis, Solid State Ionics, 1995, 79, 161-170. 6 H. Iwahara, T.Yajima and H. Ushida, Solid State Ionics, 1994, 70-71 267-271. 7 D. Shima and S.M.Haile, Solid State Ionics, 1997, 97, 443-455.
8 F.L. Chen, O.Toft Sørensen, G.Y. Meng and D.K. Peng, J. Eur. Ceram. Soc., 1998, 18, 1389-1395.
9 N. Bonanos, B. Ellis, K.S. Knight and M.N. Mahmood, Solid State Ionics, 1989, 35, 179-188. 10 G. Ma, T. Shimura and H. Iwahara, Solid State Ionics, 1998, 120, 51-60.
11 A.N. Virkar and H.S. Maiti, J. Power Sources, 1985, 14, 295-303.
12 E. Gorbova, V. Maragou, D. Medvedev, A. Demin and P. Tsiakaras, J. Power Sources, 2008,
181, 207-213.
13 J.M. Porras-Vázquez, A. G. De la Torre, D. Marrero-López, E.R. Losilla and M.A.G. Aranda,
Dalton Trans., 2006, 22, 2691-2697.
14 J.M. Porras-Vázquez, A.G. De la Torre, E.R. Losilla and M.A.G. Aranda, Solid State Ionics, 2007, 178, 1073-1080.
15 G. Álvarez-Pinazo, A. Cuesta, M. García-Maté, I. Santacruz, E. R. Losilla, A. G. De la Torre, L León-Reina and M. A. G. Aranda, Cem. Concr. Res., 2012, 42, 960-971.
16 S.N. Ghosh, P.B. Rao, A.K. Paul and K.J. Raina, Mater. Sci., 1979, 14, 1554-1566.
17 M. Regourd, M. Bigare, J. Forest, A. Guinier, Proceedings of the 5th International Symposium on the Chemistry of Cement, Part I, Supplement Paper I-10, Tokyo (1968) 44-48.
18 C.M. Midgley, Acta Crystallogr. 1952, 5, 307-312.
19 D.K. Smith, A. Majumdar and F. Ordway, Acta Crystallogr. 1965, 18, 787-795. 20 R. Czaya, Acta Crystallogr. Sect. B, 1971, B 27, 848-849.
21 S. Udagawa, K. Urabe, M. Natsume and T. Yano, Cem. Concr. Res., 1980, 10, 139-144. 22 K.H. Jost, B. Ziemer and R. Seydel, Acta Crystallogr. Sect. B, 1977, B 33, 1696-1700.
23 K. Susuki and G. Yamaguchi, Proceedings of the 5th International Symposium on the Chemistry of Cement, Supplement Paper, Tokyo (1968) 67-72.
24 Y.J. Kim, I. Nettleship and W.M. Kriven, J. Am. Ceram. Soc., 1992, 75, 2407-2419. 25 H.F.W. Taylor, Cement Chemistry, Thomas Telford, London, 1997.
26 N.A. Yamnova, N.V. Zubkova, N.N. Eremin, A. E. Zadov and V. M. Gazeev , Crystallography Reports 56 No. 2, 2011, 210-220.
11
28 E. Durgun, H. Manzano, R.J.M. Pellenq and J.C. Grossman, Chem. Mater., 2012, 24, 1262-1267.
29 Y.M. Kim and S.H. Hong, J. Am. Ceram. Soc., 2004, 87, 900-905. 30 I. Jelenic, A. Bezjak and M. Bujan, Cem. Concr. Res., 1978, 8, 173-180. 31 M. Pritts and K.E. Daugherty, Cem. Concr. Res., 1976, 6, 783-796. 32 D.L. Kantro and C.H. Weise, J. Am. Ceram. Soc., 1979, 62, 621-626.
33 B. Matkovic, V. Carin, T. Gacesa, R. Halle and I. Jelenic, Am. Ceram. Soc. Bull., 1981, 60, 825-829.
34 P. Fierens and J. Tirlocq, Cem. Concr. Res., 1983, 13, 267-276.
35 B. Ziemer, B. Altrichter and V. Jesenak, Cem. Concr. Res., 1984, 14, 686-692.
36 My. Y. Benarchid, A. Diouri, A. Boukhari, J. Aride, J. Rogez and R. Kastanet, Cem. Concr. Res., 2004, 34, 1873-1879.
37 G-C. Lai, T. Nojiri and K-I. Nakano, Cem. Concr. Res., 1992, 22, 743-754.
38 A. Cuesta, E. R. Losilla, M. A. G. Aranda, J. Sanz and Á. G. de la Torre, Cem. Concr. Res., 2012, 42, 598-606.
39 A.C. Larson and R.B. Von Dreele, General Structure Analysis System (GSAS) program. Rep. No. LA-UR-86748, Los Alamos National Laboratory, Los Alamos, CA, 1994.
40 P. Thompson, D.E. Cox and J.B. Hasting, J. Appl. Cryst., 1987, 20, 79-83. 41 L.W. Finger, D.E. Cox and A.P. Jephcoat, J. Appl. Cryst., 1994, 27, 892-900.
42 D. Johnson, ZView: a Software Program for IES Analysis, Version 2.8, Scribner Associates, Inc. Southern Pines, NC, 200.
43 W. G. Mumme, R.J. Hill, G. Bushnell-Wye and E.R.N. Seegnit, N. Jb. Miner Abh., 1995, 169, 35-68.
44 J. Sanz and J.M. Serratosa, J. Am. Chem. Soc., 1984, 106, 4790-4793.
12
Figure Captions
Figure 1. Polymorphic transformations of stoichiometric Ca2SiO4 with temperature.
Figure 2. LXRPD patterns for Ca2Si1-2xAl2xO4-xx (x=0, 0.010, 0.014 and 0.03) nominal series. Symbols highlight diagnostic peaks for -C2S (square) and C3A (circle). The inset shows 27Al MAS NMR spectrum for Ca2Si0.972Al0.028O3.9860.014.
Figure 3. Rietveld plots, [observed data (crosses), calculated pattern (full line), and difference curve (bottom)] for Ca2Si0.972Al0.028O3.9860.014 sample.
Figure 4. Thermogravimetric curves for Ca2Si0.972Al0.028O3.9860.014 and Ca1.85Na0.15(SiO4)0.85(BO3)0.15 samples performed under humidified air from 400 to 1000 °C.
Figure 5. SEM micrograph of the surface of Ca2Si0.972Al0.028O3.9860.014 sintered at 1500 °C for 4 h.
Figure 6. Impedance spectra for Ca2Si0.972Al0.028O3.9860.014 sample under different atmospheres at 800 ºC. Inset shows a magnification area.
Figure 7. Arrhenius plots of the total conductivity for Ca2Si0.972Al0.028O3.9860.014 under various atmospheres. The conductivity of the related compound Ca1.85Na0.15(SiO4)0.85(BO3)0.15 is also included for the sake of comparison (the sample was prepared as reported in [35]). The inset shows
13
Table 1. Refined unit cell parameters and Rietveld disagreement factors for Ca2(SiO4)1-2x(Al2O7)xx (x=0, 0.010, 0.014 and 0.030) series. Weight fractions of side phases deduced from Rietveld refinements are also included.
' L
'H
1425ºC
1160ºC
780
-86
0ºC
690ºC
<
50
0º
C
' L
'H
1425ºC
1160ºC
780
-86
0ºC
690ºC
<
50
0º
C
Figure 2
26 28 30 32 34 36 38 40
x=0.0
x=0.010
x=0.014
x=0.030
2q (º)
200 150 100 50 0 -50 -100
ppm
Figure 4
0
200
400
600
800
1000
W
e
ig
h
t
lo
ss
(%
)
T(ºC)
Ca
1.85Na
0.0150.09%
Ca
2Al
0.028Figure 6
0.0
6.5x10
51.3x10
60.0
6.5x10
51.3x10
6-Z
''(
·cm
)
Z' (·cm)
0.0
2.0x10
50.0
2.0x10
5Figure 7
N
2dry
N
2wet
O
2dry
O
2wet
N
2dry
N
2wet
Ca
2Al
0.028Ca
1.85Na
0.15-25 -20 -15 -10 -5 0 5 -5.6
-5.4 -5.2 -5.0 -4.8 -4.6
lo
g