GPE –6th International Congress on Green Process Engineering 3-6 June 2018 – Toulouse (France)
USING MICROWAVES AS A PRE-TREATMENT FOR ENHANCING THE
EXTRACTION OF POLYPHENOLS FROM GRAPE STEMS
R.ROMERO-DÍEZ1, J. RUBIO1, A.A MATIAS2, M. J. COCERO1, S.RODRÍGUEZ-ROJO1
(1) High Pressure Processes Group, Department of Chemical Engineering and Environmental Technology, School of Engineering, University of Valladolid (UVa), Valladolid
47011 SPAIN
e-mail : [email protected], [email protected], [email protected]
(2) Instituto de Biologia Experimental Tecnológica (iBET), c Instituto de Tecnologia Química e Biológica António Xavier (ITQB), Universidade Nova de Lisboa, Oeiras.
2780-157 PORTUGAL e-mail : [email protected]
Abstract.
Grape stems are a residual woody material from the vinification process. A waste that, if it is not treated in a correctly manner, could represent an environmental problem. Moreover, in the last years, special attention has been paid to this waste due to its high content of polyphenols, mainly stilbenes and flavonoids. Several studies have already revealed the potential and possibilities of these compounds in industries, such as alimentary, cosmetic and pharmaceutic thanks to their antioxidant, antimicrobial and/or anticarcinogenic properties. In this work, the effect of solid-liquid extraction parameters of polyphenols from grape stems have been studied. These parameters were: solid-liquid ratio (RS-L), type of solvent (variation of the percentage of
ethanol in the hydroalcoholic mixture) and temperature. Parameter values selected as the best for polyphenol extraction in a conventional solid-liquid extraction were: a RS-L of 0.10 g/mL, a
temperature of 75ºC and a hydroalcoholic mixture with a 50% vol. of ethanol. Furthermore, microwaves were applied to grape stems as a pre-treatment prior to the conventional extraction for the first time. In this case the parameters assessed were also solid-liquid ratio, type of solvent and, in addition, the time of the pre-treatment. For this purpose, a statisticalsurface design was employed to obtain the optimum conditions which maximize the final TPC of the extracts. In a first approach, extracts were characterized in terms of total polyphenol content and total flavonoid content. The main result was that, microwaves make it faster the extraction (until 4 times) but it is not clear their role on the extraction yield.
Key-words. Grape stems, stilbenes, flavonoids, microwave pre-treatment, process intensification
INTRODUCTION
MW treatment to the conventional extraction of polyphenols in which low residence time pre-treatments (below 120s) provide a better homogeneity of the energy absorb by the material [8].
From the best of our knowledge, MW have never been applied as a pre-treatment to grape stems. So, this work is aimed at the recovery of polyphenols from grape stems using MW as a pre-treatment prior to the conventional extraction. Firstly, the main parameters that govern a solid-liquid extraction are studied, taking into account the results from the literature. Then, MW pre-treatments are presented, varying the main parameters using a statistical surface design (Box-Benkhen) to obtain the optimum conditions which maximize the final total phenolic content (TPC) of the extracts. Evaluation of the extraction yields are given in term of TPC and in total flavonoid content (TFC).
MATERIALS AND METHODS Materials
Raw material: Grape stems were kindly provided by Matarromera winery (Valladolid, Spain) in November 2017, after the grape harvest. Stems were dry in an oven at the temperature of 65ºC for 24 hours. Dry stems were ground using a chopper (A320R1, Moulinex) and two different fractions were obtained. On the one hand, small pieces with an average length of 6mm were collected. On the other hand, a fine powder (67.4µm) was achieved. Both fractions were stored at room temperature, protected from light. Solvents: used for extractions were absolute ethanol (99.9% Carlo Erba Reagents, Val de Reuil, France), bidistilled water (Milli-Q® Integral) and hydrochloric acid (≥37%, puriss. p.a., Riedel-de Haën, France)
Methods
Conventional solid-liquid (S-L) extractions were performed varying the parameters: solid-liquid ratio (0.10, 0.07, 0.04 g/mL), type of solvent (ethanol and hydroalcoholic mixtures varying the % of ethanol in 80, 50 and 20%) and temperature (25, 50 and 75ºC). Solvent volume was fixed in 75 mL and the stems mass was varied according to the different RS-L (7.5, 5.25, 3 g, respectively) All the S-L extractions were
performed with an agitation of 300 rpm for 60 minutes. pH was adjusted to 2.5 with HCl. Furthermore, particle size was also studied as both fractions (pieces and powder) of ground stems were used for the solid-liquid extractions.
MW pre-treatments were carried out in a CEM Discovery Microwave with a fixed power of 300W. A statistical surface response design was performed using Statgraphics® Centurion XVII software in order to obtain the optimum conditions which maximize the final TPC and TFC of the extracts. Studied parameters were: solid-liquid ratio (0.25, 0.50 and 0.75 g/mL), solvent mixture (hydroalcoholic mixtures varying the percentage of ethanol and time of microwaves applied (30, 60 and 90s). After the pre-treatment, a conventional solid-liquid extraction is performed at best extraction conditions.
Extracts characterization. TPC was performed by Folin-Ciocalteou [9] method and expressed as milligrams of gallic acid equivalents per grams of dry stems. TFC was evaluated using also a colorimetric method [10]. Both TPC and TFC were measured along time in order to build extraction kinetics curves.
RESULTS AND DISCUSSON Conventional solid-liquid extractions
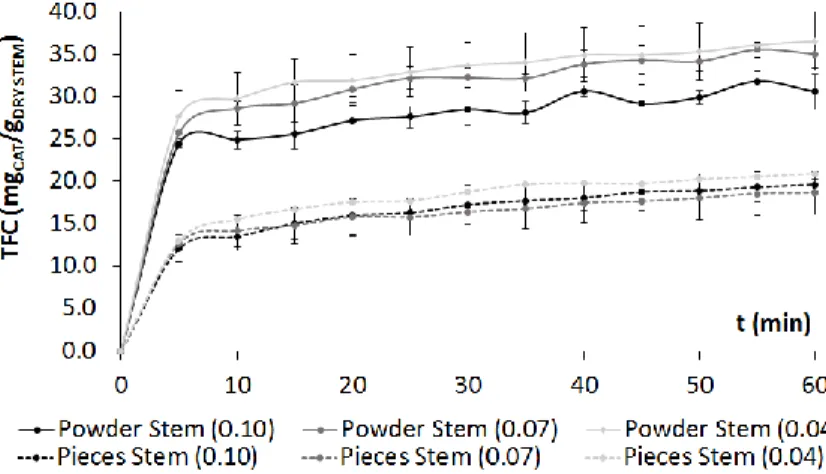
First of all, the RS-L was studied for both stems fractions, pieces and powder. TPC and TFC were
measured for each solid-liquid extractions performed at 25ºC and with a hydro-alcoholic mixture of 80% EtOH (%vol.) and different RS-L. Samples were gathered along 60 min to build extraction kinetics curves.
Figure 1 shows TFC values along time for the different RS-L.
As it was expected, TFC values are higher for stem powder than when stem pieces were used. This discrepancy is assumed to be a consequence of a diffusional stage in the bigger particles. Thus, the rest of the parameters studied in the solid-liquid extractions, were carried out with stem powder. Table 1, shows TPC and TFC values for the different variables. Finally, parameters selected as the best for polyphenols extraction from stem powder were a RS-L of 0.10 g/mL, a hydroalcoholic mixture with a 50% vol. of
ethanol and a temperature of 75ºC.
Table 1: TPC and TFC values for variations of each parameters after 60 minutes of extraction with stem powder. Values in italics represent the highest achieved concentrations.
(mg TPC
GAE/gDRY STEM)
TFC (mgCAT/gDRY STEM)
RS-L (g/mL)
0.1 34.6 ± 0.5 30.6 ± 2.1
0.07 37.1 ± 0.4 35.0 ± 1.7
0.05 36.2 ± 0.0 36.6 ± 3.4
Solvent type (% vol. EtOH)
80 34.6 ± 0.5 30.6 ± 2.1
50 49.0 ± 2.0 46.0 ± 0.7
20 40.1 ± 0.7 36.4 ± 1.3
Temperature (ºC)
25 49.0 ± 2.0 46.0 ± 0.7
50 57.5 ± 1.5 55.3 ± 2.3
75 65.5 ± 0.5 63.8 ± 4.7
Microwave pre-treatments extractions
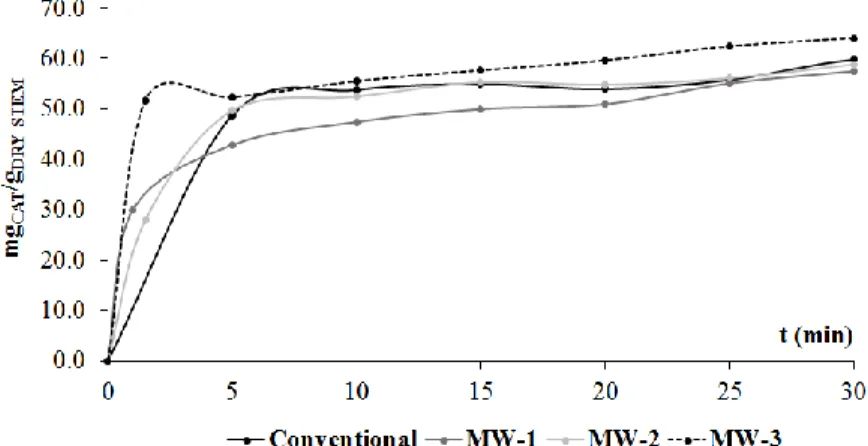
MW pre-treatments were firstly performed for stem powder as the solid-liquid extraction variables have been already studied. Preliminary MW experiments for stem powder did not show an enhancement on the TPC and TFC yields the final extracts. Nevertheless, a decrease in the required time to achieve a certain concentration is achieved when MW are applied (up to 4 times lower). This effect can be seen in Figure 2 since MW accelerates the extraction of flavonoids. The result was that a no clear enhancement on the extraction yield was be achieved. This fact can be due to the small particle size and high concentration of the polyphenols in the raw material decreasing the internal mass transfer limitation. In contrast, MWs are expected to have a mandatory role with the stem pieces because of their higher size, which also are the major fraction obtained from the milling. Furthermore, these stem pieces would also be the most attractive way from an industrial point of view.
Figure 2: comparison of the kinetic extraction curves of TFC values of the conventional extraction (50:50, EtOH:H2O; 75ºC ; 0.10 g/mL) and MW pre-treatment experiments MW-1(30s, 80:20, EtOH:H2O; 0.50 g/mL),
MW-2(90s, 50:50, EtOH:H2O; 0.50 g/mL), MW-3 (90s, 50:50, EtOH:H2O; 0.10 g/mL).
CONCLUSIONS
A whole study about the polyphenol extraction from grape stems has been performed. The best yield (TPC: 65.5 ± 0.5 mgGAE/gDRY STEM; TFC: 63.8 ± 4.7 mgCAT/gDRY STEM) was obtained at the following
conditions: RS-L of 0.10 g/mL, a hydroalcoholic mixture with a 50% vol. of ethanol and a temperature of
75ºC. MWs accelerated the extraction kinetics (up to 4 times) but had a minor effect on polyphenol extraction yield (%) was achieved for the powdery raw material due to the absence of internal mass transfer limitation. The effect of MWs on stem pieces is expected to be higher.
ACKNOWLEDGEMENTS
LITERATURE
[1] L. Ruggieri, E. Cadena, J. Martínez-Blanco, C. M. Gasol, J. Rieradevall, X. Gabarrell, T. Gea, X. Sort, and A. Sánchez, “Recovery of organic wastes in the Spanish wine industry. Technical, economic and environmental analyses of the composting process,” J. Clean. Prod., vol. 17, no. 9, pp. 830–838, 2009.
[2] C. Spatafora, E. Barbagallo, V. Amico, and C. Tringali, “Grape stems from Sicilian Vitis vinifera cultivars as a source of polyphenol-enriched fractions with enhanced antioxidant activity,” LWT - Food Sci. Technol., vol. 54, no. 2, pp. 542–548, Dec. 2013.
[3] Z. Piñeiro, A. Marrufo-Curtido, C. Vela, and M. Palma, “Microwave-assisted extraction of stilbenes from woody vine material,” Food Bioprod. Process., vol. 103, pp. 18–26, May 2017. [4] D. Pujol, C. Liu, N. Fiol, M. À. Olivella, J. Gominho, I. Villaescusa, and H. Pereira, “Chemical
characterization of different granulometric fractions of grape stalks waste,” Ind. Crops Prod., vol. 50, pp. 494–500, Oct. 2013.
[5] M. Anastasiadi, H. Pratsinis, D. Kletsas, A.-L. Skaltsounis, and S. A. Haroutounian, “Grape stem extracts: Polyphenolic content and assessment of their in vitro antioxidant properties,” LWT - Food Sci. Technol., vol. 48, no. 2, pp. 316–322, Oct. 2012.
[6] S. Brianceau, M. Turk, X. Vitrac, and E. Vorobiev, “High voltage electric discharges assisted extraction of phenolic compounds from grape stems: Effect of processing parameters on flavan-3-ols, flavonols and stilbenes recovery,” Innov. Food Sci. Emerg. Technol., vol. 35, pp. 67–74, Jun. 2016.
[7] Z. Piñeiro, R. F. Guerrero, M. I. Fernández-Marin, E. Cantos-Villar, and M. Palma, “Ultrasound-Assisted Extraction of Stilbenoids from Grape Stems,” J. Agric. Food Chem., vol. 61, no. 51, pp. 12549–12556, Dec. 2013.
[8] A. Álvarez, J. Poejo, A. A. Matias, C. M. M. Duarte, M. J. Cocero, and R. B. Mato, “Microwave pretreatment to improve extraction efficiency and polyphenol extract richness from grape pomace. Effect on antioxidant bioactivity,” Food Bioprod. Process., vol. 106, pp. 162–170, 2017.
[9] A. L. Waterhouse, Waterhouse, and A. L., “Determination of Total Phenolics,” in Current Protocols in Food Analytical Chemistry, Hoboken, NJ, USA: John Wiley & Sons, Inc., 2003. [10] A. Michalska, A. Ceglińska, and H. Zieliński, “Bioactive compounds in rye flours with different
extraction rates,” Eur. Food Res. Technol., vol. 225, pp. 545–551, 2007.
[1] L. Ruggieri, E. Cadena, J. Martínez-Blanco, C. M. Gasol, J. Rieradevall, X. Gabarrell, T. Gea, X. Sort, and A. Sánchez, “Recovery of organic wastes in the Spanish wine industry. Technical, economic and environmental analyses of the composting process,” J. Clean. Prod., vol. 17, no. 9, pp. 830–838, 2009.
[2] C. Spatafora, E. Barbagallo, V. Amico, and C. Tringali, “Grape stems from Sicilian Vitis vinifera cultivars as a source of polyphenol-enriched fractions with enhanced antioxidant activity,” LWT - Food Sci. Technol., vol. 54, no. 2, pp. 542–548, Dec. 2013.
[3] Z. Piñeiro, A. Marrufo-Curtido, C. Vela, and M. Palma, “Microwave-assisted extraction of stilbenes from woody vine material,” Food Bioprod. Process., vol. 103, pp. 18–26, May 2017. [4] D. Pujol, C. Liu, N. Fiol, M. À. Olivella, J. Gominho, I. Villaescusa, and H. Pereira, “Chemical
characterization of different granulometric fractions of grape stalks waste,” Ind. Crops Prod., vol. 50, pp. 494–500, Oct. 2013.
[5] M. Anastasiadi, H. Pratsinis, D. Kletsas, A.-L. Skaltsounis, and S. A. Haroutounian, “Grape stem extracts: Polyphenolic content and assessment of their in vitro antioxidant properties,” LWT - Food Sci. Technol., vol. 48, no. 2, pp. 316–322, Oct. 2012.
[6] S. Brianceau, M. Turk, X. Vitrac, and E. Vorobiev, “High voltage electric discharges assisted extraction of phenolic compounds from grape stems: Effect of processing parameters on flavan-3-ols, flavonols and stilbenes recovery,” Innov. Food Sci. Emerg. Technol., vol. 35, pp. 67–74, Jun. 2016.
[7] Z. Piñeiro, R. F. Guerrero, M. I. Fernández-Marin, E. Cantos-Villar, and M. Palma, “Ultrasound-Assisted Extraction of Stilbenoids from Grape Stems,” J. Agric. Food Chem., vol. 61, no. 51, pp. 12549–12556, Dec. 2013.
[8] A. Álvarez, J. Poejo, A. A. Matias, C. M. M. Duarte, M. J. Cocero, and R. B. Mato, “Microwave pretreatment to improve extraction efficiency and polyphenol extract richness from grape pomace. Effect on antioxidant bioactivity,” Food Bioprod. Process., vol. 106, pp. 162–170, 2017.
[9] A. L. Waterhouse, Waterhouse, and A. L., “Determination of Total Phenolics,” in Current Protocols in Food Analytical Chemistry, Hoboken, NJ, USA: John Wiley & Sons, Inc., 2003. [10] A. Michalska, A. Ceglińska, and H. Zieliński, “Bioactive compounds in rye flours with different
RUT ROMERO-DÍEZ
, J. RUBIO, A.A MATIAS, M. J. COCERO, S.RODRÍGUEZ-ROJO
Introduction
Objectives
Materials and Methods
Results
Conclusions
Outline
Winery residues, types and
quantities
Main goal of this research
Grape stems, procedures
Main yields and results
Introduction
Objectives
Materials and
Methods
Results
Conclusions
62%
14%
12%
12%
Grape marc
Wine lees
Grape stems
Dewatered sludge
Winery residues
3.5 ·10
5
tons of grape stems
generated per year only in
Spain
composted or burned for disposal
environmental problem
Phenolic compounds
Flavonoids
Stilbenes
Antioxidant
Anti-carcinogenic
Anti-microbial
Anti-fungical
Cardio-protective
Health-promoting effects
food constituents, cosmetics or drug adjuvants
Introduction
Objectives
Materials and
Methods
Results
Conclusions
Objectives
Total polyphenol and flavonoid extraction kinetics
•
Solid-liquid ratio, R
S-L
(g/mL)
•
Solvent composition (% ethanol hydroalcoholic mixtures)
•
Temperature (ºC)
Microwave (MW) pre-treatments
•
Solid-liquid ratio, R
S-L
(g/mL)
•
Solvent composition (% ethanol hydroalcoholic mixtures)
•
Time (s)
1. Polyphenol extraction maximization :
Introduction
Objectives
Materials and
Methods
Results
Conclusions
3
Statistical surface
area response
Extract characterization
•
Total Polyphenol Content - TPC
- Folin-Ciocalteou (mg
GAE
/g
DRY STEM
)
•
Total Flavonoid Content - TFC
- Aluminium Complexation Reaction (mg
CATE
/g
DRY STEM
)
•
ORAC
- µmol of Trolx Equivalents per gram of dry extract (µmol
TE
/g
DRY STEM
)
•
HPLC-DAD and MS/MS-MRM
- Identification of main compounds
Grape stems
•
Grape Stems (GS)
dry at 65ºC for 24 hours.
•
GS were ground using a chopper.
•
Small pieces with an average length of 3-6mm
Introduction
Objectives
Materials and
Methods
Results
Conclusions
Extraction kinetics
S-L
extraction
• Conventional polyphenol extraction kinetics curve.
•
300 rpm
•
pH = 3.0
•
t = 60 min
Fixed Conditions
- Solid-liquid ratio (g/mL): 0.07, 0.04, 0.02
- Solvent (%EtOH): hydro-alcoholic mixtures (20, 50, 80)
- Temperature: 25, 35 and 45ºC.
Parameters
0.0
20.0
40.0
60.0
80.0
100.0
120.0
140.0
0
20
40
60
TPC o
r
TFC
(mg
GAE
or CAT
/g
DRYSTE
M
)
t (min)
•
TPC - Folin-Ciocalteou
•
TFC - spectrophotometric method
Introduction
Objectives
Materials and
Methods
Results
Conclusions
MW pre-treatment
S-L
extraction
• Best conditions obtained for solid-liquid extractions.
S-L
extraction
Pre-treatment
• Statistical surface area response (Box-Behnken)
Total of 15 experiments
•
three levels (-1, 0, 1)
•
triplicate of the central point
Three main variables:
- Solid-liquid ratio (g/mL): 0.10, 0.30, 0.50
- Solvent composition (% EtOH): 20, 50, 80
- Time of microwaves (s): 30, 60, 90
Data
MW optimum point
Introduction
Objectives
Materials and
Methods
Results
Conclusions
Kinetic extraction curves
Study of the solid-liquid ratio
(at 25ºC, 20:80 (%vol.) H
2O:EtOH)
00
05
10
15
20
25
0
10
20
30
40
50
60
TPC (
mgGAE/
gDR
Y
STEM)
t (min)
Pieces Stem (0.10)
Pieces Stem (0.07)
Pieces Stem (0.04)
0
5
10
15
20
25
0
10
20
30
40
50
60
TF
C
(mgCA
T/
gDR
Y S
TEM)
t (min)
Pieces Stem (0.10)
Pieces Stem (0.07)
Pieces Stem (0.04)
Introduction
Objectives
Materials and
Methods
Results
Conclusions
Total polyphenols
Total flavonoids
Kinetic extraction curves
Study of the solvent composition
(at 25º, R
S-L= 0.10 g/mL)
Introduction
Objectives
Materials and
Methods
Results
Conclusions
Total polyphenols
Total flavonoids
0
5
10
15
20
25
30
35
0
10
20
30
40
50
60
TPC (
mgGAE/
gDR
Y
STEM)
t (min)
20:80 H2O:EtOH
50:50 H2O:EtOH
80:20 H2O:EtOH
0
5
10
15
20
25
30
35
0
10
20
30
40
50
60
TF
C(mgCA
T/
gDR
Y
STEM)
t (min)
80:20 EtOH:H2O
50:50 EtOh:H2O
20:80 EtOH:H2O
Kinetic extraction curves
Study of the temperature
(R
S-L= 0.10 g/mL and 50:50 (%vol.) EtOH:H2O)
Introduction
Objectives
Materials and
Methods
Results
Conclusions
Total polyphenols
Total flavonoids
0
5
10
15
20
25
30
35
40
45
0
10
20
30
40
50
60
TF
C
(mgCA
T/
gDR
Y S
TEM)
t (min)
25ºC
50ºC
75ºC
9
0
5
10
15
20
25
30
35
40
45
0
10
20
30
40
50
60
TPC (
mgGAE/
gDR
Y
STEM)
t (min)
MW pre-treatments
26 31 36 41 46 51
-2 -1 0 1 2
TPC
R
S-L-2 -1 0 1 2
%EtOH
-2 -1 0 1 2
Time
13 23 33 43 53
-1.5 -1 -0.5 0 0.5 1 1.5
TPC
Time
Introduction
Objectives
Materials and
Methods
Results
Conclusions
Main effect diagram for TPC
- Solid-liquid ratio (g/mL): 0.50
- Solvent composition (% EtOH): 59.944
- Time of microwaves (s): 35.79
Optimum point for TPC
Interaction diagram for TPC
10
R
S-L= +1
R
S-L= -1
-1
0
1
R
S-L0.1
0.3
0.5
%EtOH
20
50
80
MW pre-treatments
16 21 26 31 36 41 46
-2 -1 0 1 2
TFC
R
S-L-2 -1 0 1 2
%EtOH
-2 -1 0 1 2
Time
16
21
26
31
36
41
46
-1.5 -1 -0.5 0 0.5 1 1.5
TF
C
Time
Introduction
Objectives
Materials and
Methods
Results
Conclusions
- Solid-liquid ratio (g/mL): 0.10
- Solvent composition (% EtOH): 57.03
- Time of microwaves (s): 85.71
Optimum point for TFC
Interaction effect diagram for TFC
11
Main effect diagram for TFC
R
S-L= +1
R
S-L= -1
-1
0
1
R
S-L0.1
0.3
0.5
%EtOH
20
50
80
MW pre-treatments
Introduction
Objectives
Materials and
Methods
Results
Conclusions
0 10 20 30 40 50 60
0 5 10 15 20 25 30 35 40 45 50
0 5 10 15 20 25 30 35
TFC
(mgC
AE/
g DR
Y
ST
EM)
TPC
(mgG
AE/
g DR
Y
ST
EM)
t (min)
TPC - Conventional TPC- MW
TFC - Conventional TFC - MW