Association between dietary fibre intake and fruit, vegetable or whole grain consumption and the risk of CVD: results from the PREvención con DIeta MEDiterránea (PREDIMED) trial
13
0
0
Texto completo
(2) Fibre intake and CVD. 535. Abstract Prospective studies assessing the association between fibre intake or fibre-rich food consumption and the risk of CVD have often been limited by baseline assessment of diet. Thus far, no study has used yearly repeated measurements of dietary changes during follow-up. Moreover, previous studies included healthy and selected participants who did not represent subjects at high cardiovascular risk. We used yearly repeated measurements of diet to investigate the association between fibre intake and CVD in a Mediterranean cohort of elderly adults at high cardiovascular risk. We followed-up 7216 men (55–80 years) and women (60–80 years) initially free of CVD for up to 7 years in the PREvención con DIeta MEDiterránea study (registered as ISRCTN35739639). A 137-item validated FFQ was repeated yearly to assess diet. The primary end point, confirmed by a blinded ad hoc Event Adjudication Committee, was a composite of cardiovascular death, myocardial infarction and stroke. Time-dependent Cox’s regression models were used to estimate the risk of CVD according to baseline dietary exposures and to their yearly updated changes. We found a significant inverse association for fibre (Pfor trend = 0·020) and fruits (Pfor trend = 0·024) in age-sex adjusted models, but the statistical significance was lost in fully adjusted models. However, we found a significant inverse association with CVD incidence for the sum of fruit and vegetable consumption. Participants who consumed in total nine or more servings/d of fruits plus vegetables had a hazard ratio 0·60 (95 % CI 0·40, 0·96) of CVD in comparison with those consuming <5 servings/d. Key words: CVD: Primary prevention: Dietary fibre: Fruits: Vegetables. The US Department of Health and Human Services and other national agencies recommend a daily fibre intake between 20 and 30 g. This recommendation is based on several prospective cohort studies that have consistently shown that high consumption of fibre is associated with lower risk of stroke, CHD(1,2) and cardiovascular mortality(3). Moreover, in clinical trials and epidemiological studies, dietary fibre (DF) has been related to a lower incidence of type 2 diabetes (T2D)(4), obesity(5), dyslipaemia(6), high blood pressure(7,8) and other surrogate markers of clinical atherosclerosis(9). Fruits, vegetables, legumes and grains are the main sources of DF, but some investigators have suggested that fibre content is not the only reason for the above-mentioned preventive effects of these foods. Alternatively, the different components in their natural matrix may play a more important role than fibre per se. This possibility raises the interest in assessing the role of fibre-rich foods and not only of total DF intake. Although several cohort studies have shown inconsistent results for the association of fruit and vegetable consumption with stroke, Dauchet et al.(10) found an inverse association between fruits or the sum of fruits and vegetables and the risk of stroke, but not between vegetable consumption and the risk of stroke in a meta-analysis published in 2005. In another meta-analysis published 1 year later, He et al.(11) found an inverse association between fruit or vegetable consumption and the risk of stroke. On the other hand, Dauchet et al.(2) published another meta-analysis (including seven cohorts from USA and two from Finland), assessing the association between fruit and vegetable consumption and CHD. According to this latter meta-analysis, the risk of CHD decreased by 4 % for each additional daily serving of fruits and vegetables and by 7 % for fruit consumption (FC), but the funnel plot suggested a potential publication bias. In the European Prospective Investigation into Cancer and Nutrition (EPIC) study, Crowe et al.(12) observed that a higher consumption of fruits and vegetables was associated with a reduced risk of ischaemic heart disease mortality. The available prospective studies, especially those with the largest sample size, included in the aforementioned studies and other meta-analyses(13,14), were mostly conducted in highly selected subjects – that is, in healthy and well-educated participants with a low cardiovascular risk. Usually, participants at high cardiovascular risk at baseline, such as those with T2D or dyslipidaemia(1), were explicitly excluded, because they could have changed their dietary habits. Nevertheless, we. thought it would be interesting to assess the health effects of fibre, fruit and vegetable consumption, especially among these patients, because they are at high cardiovascular risk. To our knowledge, no prospective study has assessed the association between fibre intake or fibre-rich food consumption and the risk of CVD in a cohort entirely composed of subjects at moderate-to-high cardiovascular risk. On the other hand, prospective studies on this issue have often been limited to a single baseline assessment of diet without repeated measurements during follow-up. To our knowledge, no previous study has included yearly repeated measurements of diet to account for changes in the diets of participants during follow-up. This is an important methodological aspect frequently absent in studies of nutritional epidemiology, because the use of repeated measurements of diet allows to capture longer-term variation in diets and improves the validity estimates of FFQ(15). Therefore, the need for updating the information on dietary habits using repeated FFQ has been advocated, because the use of a single measurement of dietary data at baseline may lead to an increased measurement error and to an unrealistic assumption about the induction period, and thus to a potential attenuation of the true association(16,17). It is also possible that the cumulative averages, which reflect long-term diet, are more relevant aetiologically than either the most remote (baseline) or the most recent diets. Therefore, in the present study, we used repeated measurements of intake to investigate the association of fibre, fruit, vegetable and whole-grain consumption with CVD in a Mediterranean cohort of elderly adults at high cardiovascular risk.. Methods The present study was conducted within the framework of the PREvención con DIeta MEDiterránea (PREDIMED) trial, the design of which has been described in detail elsewhere(18,19). The PREDIMED study is a large, parallel-group, multicentre, randomised, controlled field clinical trial that aims to assess the effects of the Mediterranean diet on the primary prevention of CVD (www.predimed.es). The PREDIMED study was conducted in Spain and registered as ISRCTN35739639. Recruitment took place between October 2003 and January 2009, and the 7447 participants were randomly assigned to one. Downloaded from http:/www.cambridge.org/core. Universidad de Navarra, on 27 Sep 2016 at 11:45:00, subject to the Cambridge Core terms of use, available at http:/www.cambridge.org/core/terms. http://dx.doi.org/10.1017/S0007114516002099.
(3) 536. P. Buil-Cosiales et al.. of three interventions (two Mediterranean diets enriched with extra virgin olive oil or mixed nuts and a control low-fat diet). Participants were men aged between 55 and 80 years and women aged between 60 and 80 years, who were free of CVD at baseline but who had either T2D or at least three CHD risk factors out of current smoking, hypertension (blood pressure ≥140/90 mmHg or treatment with antihypertensive medication), high plasma LDLcholesterol (≥4·4 mmol/l or lipid lowering therapy), low plasma HDL-cholesterol (≤1·04 mmol/l in men and ≤1·295 mmol/l in women), overweight or obesity (BMI ≥25 kg/m2) and family history of premature CVD (≤55 years in men and ≤60 years in women). Exclusion criteria for the PREDIMED study were the presence of any severe chronic illness, previous history of CVD, alcohol or drug abuse, BMI ≥ 40 kg/m2 and history of allergy or intolerance to olive oil or nuts. The intervention took place in eleven different centres around Spain. At baseline examination and yearly at follow-up visits, trained personnel performed anthropometric and blood pressure measurements and obtained samples of fasting blood.. Dietary assessment Dietary intake was measured using a validated 137-item FFQ, repeatedly administered by trained dietitians every year in a face-to-face interview. Our published validation study indicated an adequate correlation between the information collected using the FFQ and the information collected using four 3-d dietary records. The correlation coefficients were 0·66 for fibre intake, 0·72 for FC and 0·81 for vegetable consumption(20). The reproducibility of the FFQ was also appropriate, as we have previously reported in a specific publication(21). The frequencies of consumption of the food items were reported on an incremental scale with nine categories (never or almost never, one to three times per month, once per week, two to four times per week, five to six times per week, once per day, two to three times per day, four to six and >6 times per day). We included thirteen vegetable items (a serving or 200 g of chard/spinach, cabbage/cauliflower, lettuce/chicory, tomato, carrot/pumpkin, zucchini/cucumber, pepper, asparagus, onion, mushrooms, thistle/leek, beans and ‘gazpacho’), ten fruit items (a piece of orange/tangerine/grapefruit, apple/pear, banana, peach/apricot/nectarine, melon, watermelon, strawberries, cherries/prune, kiwi and grapes) and three whole-grain products (bread, breakfast cereals and biscuits). Nutrient intakes were computed using a Spanish food composition database(22).. Primary end point The primary end point was the same as that in the final results of the PREDIMED trial. This CVD primary end point is a composite of cardiovascular death, myocardial infarction (MI) and stroke. Incident events were identified through four information sources: repeated contacts with the participants or their family, contacts with the participants’ family physicians, a comprehensive yearly review of medical records of all participants by a team of medical doctors who were blinded to group allocation and nutrient information and yearly consultation of the National Death Index. The Event Adjudication Committee, whose members were. unaware of the nutrient intakes of participants, blindly examined all medical records related to end points. Only end points that were confirmed by the Event Adjudication Committee and that occurred between 1 October 2003 and 30 June 2012, were included in this analysis. This corresponds to the time of the intervention plus 2 years and 6 months of extended follow-up without active intervention.. Statistical analysis Participants were categorised into quintiles of consumption for each of the assessed foods. We used the residual method to adjust DF, fruit, vegetable and whole-grain consumption for total energy intake(23). We excluded participants with total energy intake out of pre-defined limits (3347·2 and 16 736 kJ/d (800 and 4000 kcal/d) for men and 2092 and 14 644 kJ/d (500 and 3500 kcal/d) for women). Baseline characteristics are presented according to quintiles of baseline consumption of fruits and of vegetables, as means and standard deviations for quantitative traits and as numbers and percentages for categorical variables. Cox’s regression models were used to assess the relationship between quintiles of baseline fibre, fruit, vegetable and whole-grain consumption, and the subsequent incidence of CVD during follow-up. Hazard ratios (HR) and their 95 % CI were calculated using the first quintile as the reference category. Entry time was defined as the date at recruitment. Exit time was defined as the primary end point’s date, the date of completion of the last interview or date of death, whichever occurred first. To minimise any effects of variation in diet, we also calculated the average food consumption for each food group or food item using yearly updated information for each participant from the repeated FFQ collected at baseline and during follow-up after up to 8 years. Multivariate models were adjusted for known or suspected predictors of CVD. First, we adjusted only for age and sex. In model 2, additional adjustments for smoking status (current or former smokers and never smokers), T2D at baseline (dichotomous), baseline systolic blood pressure (mmHg) and diastolic blood pressure (mmHg), waist:height ratio, educational level (up to primary school, university graduate or others), use of statins (yes or no), dyslipidaemia at baseline, total energy intake (kJ/d (kcal/d)), physical activity (metabolic equivalent task-min/d), alcohol intake (g/d) and family history of early MI (defined as infarction before age 65 years for a participant’s mother or before age 55 years for a participant’s father) and intervention group were carried out and we stratified by recruitment centre. We also fitted model 3 with additional adjustment for extra-virgin olive oil consumption (g/d) and vegetable (g/d) and whole-grain (g/d) consumption in the analysis of FC, and/or fruit (g/d) and whole-grain (g/d) consumption in analyses that assessed vegetable consumption, and/or vegetable (g/d) and fruit (g/d) consumption in analyses of whole-grain consumption. To test for linear trends across successive quintiles, we created a continuous variable with the median value in each quintile of consumption and regressed the risk of CVD on this variable (which was treated as a continuous variable).. Downloaded from http:/www.cambridge.org/core. Universidad de Navarra, on 27 Sep 2016 at 11:45:00, subject to the Cambridge Core terms of use, available at http:/www.cambridge.org/core/terms. http://dx.doi.org/10.1017/S0007114516002099.
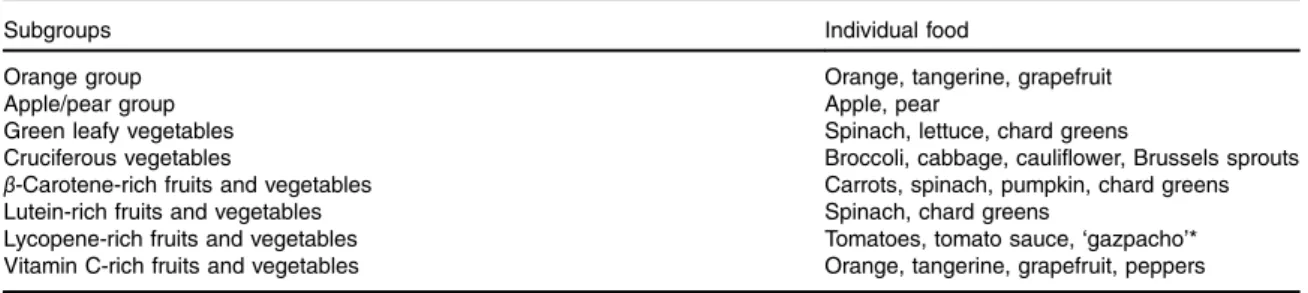
(4) Fibre intake and CVD. 537. Table 1. Definitions for various fruit and vegetable subgroups Subgroups. Individual food. Orange group Apple/pear group Green leafy vegetables Cruciferous vegetables β-Carotene-rich fruits and vegetables Lutein-rich fruits and vegetables Lycopene-rich fruits and vegetables Vitamin C-rich fruits and vegetables. Orange, tangerine, grapefruit Apple, pear Spinach, lettuce, chard greens Broccoli, cabbage, cauliflower, Brussels sprouts Carrots, spinach, pumpkin, chard greens Spinach, chard greens Tomatoes, tomato sauce, ‘gazpacho’* Orange, tangerine, grapefruit, peppers. * Cold tomato-based soup with pepper, cucumber, garlic and onion.. We also estimated the average of all the repeated measures of intake during follow-up, and participants were categorised into quintiles according to their cumulative average of fibre, fruit, vegetable and whole-grain consumption. Cox’s regression models with time-varying exposures were used to assess the relationship between quintiles of each nutritional exposure and the composite end point, after adjusting for the same variables mentioned above. Finally, we categorised the variables fruits and vegetables into servings per day instead of using quintiles. We defined a serving as 80 g of fruits or vegetables(24), and classified our participants according to the recommended intakes. We created a new variable with the sum of daily servings of fruits and vegetables, and we assessed the association between this variable and the incidence of CVD using the same Cox’s regression model. In addition, we analysed specific subgroups of fruits and vegetables. The definition of composite groups was based on a report by Joshipura et al.(25) and adapted to our FFQ and to the usual habits of the Spanish population. The fruits and vegetables in each subgroup are presented in Table 1. Finally, we performed restricted cubic spline analyses to assess a non-linear component in the association between fibre intake or vegetable, fruit or whole-grain consumption and CVD. Statistical tests were two-sided, and P values <0·05 were considered to be statistically significant. Statistical analyses were performed using STATA software, version SE 11 (College Station, 2009).. Results We recruited 7447 participants in the PREDIMED trial. For the present analyses, we excluded subjects who were outside of the pre-defined limits for total energy intake (n 153) and those who had missing values in baseline intake (n 78). Therefore, the final sample comprised 7216 participants. The median follow-up period was 6 years (mean = 5·8 years). We observed 342 confirmed cases of CVD during this extended follow-up period: 118 cases of acute MI, 169 of stroke and 104 cardiovascular deaths (participants could have more than one event). Table 2 presents the characteristics of the study population according to categories of baseline FC. Participants in the highest quintile were older, more likely to use statin medication, to be former smokers and also to be physically more active. On. the other hand, FC was positively related to carbohydrate, protein and fibre intakes and to whole-grain and vegetable consumption, but inversely associated with total energy, total fat, SFA, MUFA, PUFA and alcohol intakes. The main characteristics of the participants categorised according to their vegetable consumption are displayed in Table 3. Subjects with a lower consumption were older, had higher systolic and diastolic blood pressure values and were less physically active and more likely to be current smokers. These participants also had the lowest protein and fibre intakes and the lowest fruit and whole-grain consumption. Table 4 shows the association of fibre intake and fruit, vegetable or whole-grain consumption at baseline with the incidence of CVD. We observed that a higher consumption of fibre, fruits and vegetables at baseline was associated with a lower risk of developing CVD in the age- and sex-adjusted model. However, only the estimate for the fifth v. the first quintile of vegetable consumption remained significant after adjusting for further potential confounders: HR 0·67 (95 % CI 0·46, 0·97; Pfor trend = 0·050). The HR for the incidence of CVD according to the cumulative average of each dietary variable are shown in Table 5. We found almost the same results for fibre intake and FC during follow-up: a higher consumption was inversely associated with the risk of CVD in the age- and sex-adjusted model. This association persisted but slightly lost its significance after further adjustments. Regarding vegetable and whole-grain cumulative consumption, the comparison between extreme quintiles showed a decreased risk of CVD among those subjects with a higher cumulative consumption. Nevertheless, these associations were not statistically significant and there was no apparent significant linear trend for them. We did not find any association between whole-grain consumption and CVD in either the baseline or the cumulative analysis. When we stratified our analyses by intervention group, we found a strong inverse association between the cumulative average of FC and CVD only in the Mediterranean diet group supplemented with extra-virgin olive oil (HR for the fifth quintile v. the first quintile 0·48; 95 % CI 0·27, 0·86; P = 0·025). During follow-up, we found a higher average fruit and vegetable consumption compared with baseline, with median values for the first quintile increasing from 153 to 203 g/d for FC and from 178 to 205 g/d for vegetable consumption. When we analysed the consumption of food groups as servings/d, the linear inverse association between fruit or. Downloaded from http:/www.cambridge.org/core. Universidad de Navarra, on 27 Sep 2016 at 11:45:00, subject to the Cambridge Core terms of use, available at http:/www.cambridge.org/core/terms. http://dx.doi.org/10.1017/S0007114516002099.
(5) 538. P. Buil-Cosiales et al.. Table 2. Demographics, lifestyle characteristics and daily nutrient intakes according to baseline quintiles (Q) of fruit intake (Mean values and standard deviations; percentages) Q1 Mean Fruit consumption Median (g/d) n Age (years) Male sex (%) BMI (kg/m2)† Systolic blood pressure (mmHg) Diastolic blood pressure (mmHg) Use of statin medication (%) Current smokers (%) Former smokers (%) Olive oil intervention group (%) Nuts intervention group (%) Educational level University (%) High school (%) Physical activity (MET-min/d) Energy (kJ/d) Energy (kcal/d) Carbohydrate (% of energy) Protein (% of energy) Fat (% of energy) SFA (% of energy) MUFA (% of energy) PUFA (% of energy) Long-chain n-3 fatty acids (g/d)* Short-chain n-3 fatty acids (g/d)* Alcohol (g/d)* Fibre (g/d)* Whole grains (g/d)* Vegetable (g/d)*. Q2–Q4 SD. Mean. 153 1444 66·4. 200·5 9878 2361 40·1 16·2 40·5 10·6 20·2 6·4 0·8 1·3 11·3 20·4 27·5 291·8. SD. Mean. 333 4329 6·2. 67·2. 42·5 30·1 148·6 83·1. Q5. 613 1443 6·2. 67·1. 42·6 4·0 19·4 10·5. 29·9 148·8 82·8. SD. 6·1 42·6. 3·8 19·1 10·1. 30·0 148·2 82·4. 3·8 19 10·1. 37·9 19·9 23·7 33·0 31·5. 40·0 12·7 24·9 33·6 33·3. 43·3 11·6 24·6 37·6 32·3. 4·2 19·7. 3·5 19·0. 4·0 16·5. 230·1 2359 564 7·7 2·7 7·1 2·4 4·8 2·0 0·5 0·6 17·5 6·9 64·7 128·5. 232·8 9079 2170 41·2 16·8 39·7 10·0 19·8 6·3 0·8 1·4 7·9 24·9 29·3 337. 234·2 2216 530 6·7 2·9 6·6 2·1 4·5 2·1 0·5 0·7 13·4 6·3 55·4 132. 256·1 9657 2308 45·1 16·5 36·5 9·2 17·9 6·0 0·8 1·4 6·8 31·17 31·9 378·0. 257·5 2238 535 6·7 2·7 6·4 2·2 4·2 2·1 0·5 0·7 11·6 7·4 59·8 175. MET, metabolic equivalent task. * Adjusted for total energy intake by the residual method. † BMI was calculated as weight in kilograms divided by the square of height in metres.. vegetable consumption and CVD was not significant, although it approached the conventional limit of statistical significance for FC (Pfor trend = 0·07 for fruits and P = 0·27 for vegetables). The lowest risk of CVD was associated with the consumption of five to seven servings per d of fruits (HR 0·73; 95 % CI 0·51, 1·04) or five servings per d of vegetables (HR 0·63; 95 % CI 0·42, 0·97) (Fig. 1). When we added up the daily-consumed servings of both fruits and vegetables, the linear dose–response inverse association between fruit plus vegetable consumption and CVD was clearly significant (Pfor trend 0·005). The participants who consumed in total nine or more servings/d of fruits plus vegetables had a HR 0·60 (95 % CI 0·40, 0·96) of CVD in comparison with those consuming <5 servings/d. Higher intakes of cruciferous vegetables (HR 0·62 (95 % CI 0·42, 0·90)) were associated with a lower CVD risk in the baseline analysis (fifth v. first quintile HR 0·62 (95 % CI 0·42, 0·90)) and in the cumulative analysis (fifth v. first quintile HR 0·64 (95 % CI 0·42, 0·97)). Green leafy vegetables reached statistical association only in the baseline analysis (fifth v. first quintile HR 0·65 (95 % CI 0·47, 0·91)) and apple intake only in the cumulative analysis (fifth v. first quintile HR 0·48 (95 % CI 0·31, 0·74)). These results are shown in Table 6.. Finally, no non-linear component of the spline analyses for fibre intake or vegetable, fruit or whole-grain consumption and CVD was statistically significant.. Discussion To the best of our knowledge, our study is the first prospective study that has evaluated the association of fibre, fruit, vegetable and whole-grains consumption with CVD among elderly adults at high cardiovascular risk using repeated measurements of dietary information. We observed that higher baseline vegetable consumption (fifth quintile v. first quintile) was associated with a statistically significant reduction in CVD risk (HR 0·67 (95 % CI 0·46, 0·97); Pfor trend = 0·05) after adjusting for the main potential confounders. As far as fibre intake and fruit and whole-grain consumption are concerned, all comparisons between extreme categories suggested a protective association but the results were no longer statistically significant in our multivariable analyses. In the cumulative analyses using repeated measurements of diet, we again observed inversed associations between extreme categories for CVD but the differences were not statistically significant in the fully adjusted models. The inverse. Downloaded from http:/www.cambridge.org/core. Universidad de Navarra, on 27 Sep 2016 at 11:45:00, subject to the Cambridge Core terms of use, available at http:/www.cambridge.org/core/terms. http://dx.doi.org/10.1017/S0007114516002099.
(6) Fibre intake and CVD. 539. Table 3. Demographics, lifestyle characteristics and daily nutrient intakes according to baseline quintiles (Q) of vegetable consumption (Mean values and standard deviations; numbers and percentages) Q1 Mean Vegetable consumption Median (g/d) n Age (years) Male sex (%) BMI (kg/m2)† Systolic blood pressure (mmHg) Diastolic blood pressure (mmHg) Use of statin medication (%) Current smokers (%) Former smokers (%) Olive oil intervention group (%) Nuts intervention group (%) Educational level University (%) High school (%) Physical activity (MET-min/d) Energy (kJ/d) Energy (kcal/d) Carbohydrate (% of energy) Protein (% of energy) Fat (% of energy) SFA (% of energy) MUFA (% of energy) PUFA (% of energy) Long-chain n-3 fatty acids (g/d)* Short-chain n-3 fatty acids (g/d)* Alcohol (g/d)* Fibre (g/d)* Fruits (g/d)* Whole grains (g/d)*. Q2–Q4 SD. Mean. 178 1444 67·5. 197·9 9610 2297 42·2 15·7 39·4 10·4 20·0 6·2 0·7 1·3 9·5 20·6 317 21·4. SD. Mean. 314 4329 6·3. 67·1. 42·6 30·1 149·5 83·4. Q5. 503 1443 6·2. 66·5. 45·6 3·8 19·1 10·1. 30·0 148·8 82·7. SD. 6·1 42·6. 3·8 19·1 10·2. 29·8 147·2 82·2. 4·0 18·8 10·0. 38·5 16·3 23·1 32·3 31·2. 40·2 13·6 24·2 34·0 33·1. 42·1 12·4 27·0 37·0 33·0. 4·0 19. 3·4 17·6. 4·2 21·3. 200·3 2351 562 7·4 2·7 6·7 2·4 4·4 2·1 0·5 0·6 16·7 7·5 182 54·1. 232·3 9226 2205 41·4 16·6 39·5 10·0 19·7 6·3 0·8 1·4 8·3 24·8 365·0 29·8. 239·6 2230 533 7·0 2·7 6·7 2·2 4·5 2·1 1·4 0·7 13·7 7·6 185 57·4. 260·5 9493 2269 42·1 17·5 38·3 9·6 18·9 6·2 0·9 1·4 7·2 31·0 430 36·6. 266·5 2310 552 7·1 2·9 7·0 2·2 4·8 1·9 1·4 0·7 12·0 7·8 217·0 63·6. MET, metabolic equivalent task. * Adjusted for total energy intake by the residual method. † BMI was calculated as weight in kilograms divided by the square of height in metres.. association between FC and CVD was stronger and statistically significant in the group randomly assigned to the Mediterranean diet supplemented with extra-virgin olive oil. Thus, FC may exert its beneficial effect, especially when consumed within the frame of a Mediterranean diet with a very high consumption of extra-virgin olive oil. The risk of CVD appeared to decrease with a consumption of five servings/d (400 g/d) of fruits or vegetables, and higher intakes did not appear to provide additional protection. However, when we considered fruit and vegetable consumption together, we found a clear inverse linear trend. Fruit and vegetable consumption combined at levels beyond five servings/d was associated with a slight and non-statistically significant decreased risk for CVD, and further increments in consumption (≥9 servings/d or ≥720 g/d) showed statistically significant risk reductions. Our results have to be interpreted in the frame of an intervention trial where participants were encouraged to have a sufficiently high consumption of fruits and vegetables. As fruit and vegetable consumption were higher in the intervention groups during the follow-up compared with the control group(19), our results may be partially driven by the intervention effect.. Our findings are consistent with those of other studies: four meta-analysis conducted by He et al.(11), Dauchet et al.(2,10) Joshipura et al.(25) and more recently by Hu et al.(26) found an inverse association between fruit and vegetable consumption and the risk of stroke or CHD, but almost none of the individual studies alone reached statistical significance. In addition, most of the included studies had been conducted in North America, in the north of Europe or in Asia, but in Mediterranean populations only the EPIC study (that included Mediterranean populations) has analysed fatal CVD(27). This latter study found an inverse association between vegetable or vegetable and FC and fatal CVD, but not for FC alone. On the other hand, Eshak et al.(28) found in a Japanese population an inverse association between intakes of fruit fibre but not with vegetable fibre and risk of CHD mortality. Finally, compared with our study participants, the participants in previous studies were in general younger and had a lower cardiovascular risk. Crowe et al.(12) found in the EPIC study a HR of 0·78 (95 % CI 0·67, 0·91) for cardiovascular mortality for a consumption of five to seven servings per d of fruits and vegetables. A recent study(29) assessed the relationship between fruit and vegetable consumption and CVD according to their servings in the Nurses’ Health Study and the Health Professional Follow-Up study, and found similar. Downloaded from http:/www.cambridge.org/core. Universidad de Navarra, on 27 Sep 2016 at 11:45:00, subject to the Cambridge Core terms of use, available at http:/www.cambridge.org/core/terms. http://dx.doi.org/10.1017/S0007114516002099.
(7) 540. P. Buil-Cosiales et al.. Table 4. Hazard ratios (HR) of CVD according to baseline quintiles (Q) of fibre, fruit, vegetables and whole-grain intakes (HR and 95 % confidence intervals) Q1 Quintiles Dietary fibre intake Median (g/d) n Time at risk No. of cases Age and sex adjusted Multivariable adjusted†‡ Fruit consumption (g/d) Median n Time at risk No. of cases Age and sex adjusted Multivariable adjusted† Additional multivariable adjusted‡ Vegetable consumption (g/d) Median n Time at risk No. of cases Age and sex adjusted Multivariable adjusted† Additional multivariable adjusted§ Whole-grain consumption (g/d) Median n Time at risk No. of cases Age and sex adjusted Multivariable adjusted† Additional multivariable adjusted║. HR. Q2 HR. 95 % CI. Q3 HR. 95 % CI. Q4 HR. 95 % CI. Q5 HR. 95 % CI. Pfor. trend. 17 1444 8500 79 1 (Ref. ) 1 (Ref.). 21 1443 8491 77 0·96 0·70, 1·31 0·95 0·69, 1·30. 24 1443 8428 74 0·93 0·67, 1·28 0·94 0·68, 1·29. 28 1443 8240 62 0·78 0·56, 1·09 0·82 0·57, 1·16. 35 1443 8150 51 0·69 0·48, 0·99* 0·72 0·50, 1·04. 0·024 0·061. 153 1444 8676 81 1 (Ref.) 1 (Ref.) 1 (Ref.). 256 1443 8607 69 0·84 0·61, 1·16 0·86 0·61, 1·19 0·87 0·62, 1·22. 339 1443 8246 76 0·92 0·67, 1·26 0·91 0·65, 1·27 0·96 0·68, 1·33. 439 1443 8207 59 0·69 0·49, 0·96 0·70 0·50, 0·99 0·74 0·52, 1·10. 613 1443 8073 58 0·70 0·49, 1·00 0·72 0·50, 1·04 0·76 0·52, 1·10. 0·031 0·046 0·098. 178 1444 8493 92 1 (Ref.) 1 (Ref.) 1 (Ref.). 255 1443 8557 72 0·81 0·60, 1·11 0·84 0·62, 1·16 0·88 0·64, 1·20. 316 1443 8323 64 0·74 0·54, 1·02 0·75 0·54, 1·10 0·80 0·57, 1·12. 386 1443 8246 68 0·81 0·59, 1·12 0·80 0·58, 1·11 0·86 0·62, 1·21. 503 1443 8189 47 0·59 0·41, 0·85* 0·60 0·42, 0·87* 0·67 0·46, 0·97*. 0·009 0·010 0·050. 5·06 1443 8304 73 1·05 0·79, 140 1·01 0·72, 1·42 1·02 0·73, 1·43. 19·39 1443 8142 68 1·03 0·77, 1·37 1·04 0·73, 1·49 1·06 0·74, 1·53. 84 1443 8455 62 0·84 0·62, 1·15 0·86 0·61, 1·19 0·89 0·64, 1·25. 0·225 0·275 0·396. 0 2887 85 478 359 140 1 (Ref.) 1 (Ref.) 1 (Ref.). Ref., referent values. * Statistically significant. † Adjusted for age (years), sex, smoking status (current smokers or former and never smoked), type 2 diabetes at baseline (yes or no), waist:height ratio (continuous variable), baseline systolic (mmHg) and diastolic arterial blood pressure (mmHg), intervention group, use of statins (yes or no), alcohol intake (g/d), educational level (elementary school, high school and university), physical activity (metabolic), total energy intake (kJ/d (kcal/d)), family history of premature CHD (yes or no) and dyslipidaemia at baseline (yes or no), stratified by intervention centre. ‡ Additionally adjusted for vegetable intake (g/d), whole-grain consumption (g/d) and extra-virgin olive oil intake (g/d). § Additionally adjusted for fruit intake (g/d), whole-grain consumption (g/d) and extra-virgin olive oil intake (g/d). || Additionally adjusted for fruit consumption (g/d), vegetable consumption (g/d) and extra-virgin olive oil intake (g/d).. results with a statistically significant HR of 0·84 (95 % CI 0·77, 0·91) for four servings/d and 0·80 (95 % CI 0·72, 0·90) for nine or more servings/d. Therefore, a smaller fruit and vegetable consumption was enough to show a significant association. The large sample size (123 276 participants), the long follow-up period (>22 years) and the participant characteristics in these cohorts (younger age, conscious and responsible healthcare professionals, without T2D) could contribute to explain the slight differences between their findings and our results. Our participants were older subjects at high cardiovascular risk and roughly half of them had T2D. Thus, a higher level of fruit and vegetable consumption might be necessary to achieve the same degree of protection in a higher-risk population. Another difference between our study and previous reports is the higher average fruit and vegetable consumption in our participants, which represents the typical amount of fruits and vegetables consumed in previous studies conducted in the Mediterranean area(30–32). Nevertheless, our FFQ had the same items for fruits compared with the Nurses and the Health Professionals Study, but fewer items for vegetables.. A higher consumption of whole grains did not have any association with the risk of CVD in our cohort in either the baseline or the cumulative analysis. This can be probably explained by the low average consumption of whole-grain products (mean 29·9 g/d, median 5·06g/d) and the small between-subjects variability in consumption in our participants. Moreover, in our study, brown bread (wheat whole-grain bread) was the principal whole-grain product consumed, and in our country whole-grain bread is almost always made from wheat and not from other cereals. Studies on the cardiovascular effects of whole-grain wheat bread are scarce. Helnæs et al. assessed in a Scandinavian cohort the association of total whole grain and whole-grain species (wheat, rye and oats) with the risk of MI. When the specific cereal species were considered, rye and oats, but not wheat, were associated with lower risk of MI(33). As far as we know, no other studies have assessed the association between different species of whole grains and CVD. As far as intermediate cardiovascular markers are concerned, a recent meta-analysis failed to find a statistically significant association between whole-grain wheat consumption and blood cholesterol concentrations(34).. Downloaded from http:/www.cambridge.org/core. Universidad de Navarra, on 27 Sep 2016 at 11:45:00, subject to the Cambridge Core terms of use, available at http:/www.cambridge.org/core/terms. http://dx.doi.org/10.1017/S0007114516002099.
(8) Fibre intake and CVD. 541. Table 5. Hazard ratios (HR) of CVD according to cumulative average quintiles of fibre, fruit, vegetable and whole-grain intakes (yearly updated measurements of diet) (HR and 95 % confidence intervals) Q1 Quintiles. HR. Dietary fibre intake (g/d) Median No. of cases Age and sex adjusted Multivariable adjusted* Fruit consumption (g/d) Median No. of cases Age and sex adjusted Multivariable adjusted* Additional multivariable adjusted† Vegetable consumption (g/d) Median No. of cases Age and sex adjusted Multivariable adjusted* Additional multivariable adjusted‡ Whole-grain consumption (g/d) Median No. of cases Age and sex adjusted Multivariable adjusted* Additional multivariable adjusted§. 95 % CI 19 85 1 (Ref.) 1 (Ref.) 203 76 1 (Ref.) 1 (Ref.) 1 (Ref.) 205 87 1 (Ref.) 1 (Ref.) 1 (Ref.) − 3·5 82 1 (Ref.) 1 (Ref.) 1 (Ref.). Q2. Q3. Q4. HR. 95 % CI. HR. 95 % CI. 0·91 0·92. 22 77 0·67, 1·24 0·67, 1·26. 0·77 0·83. 25 66 0·56, 1·06 0·59, 1·16. 0·85 0·87 0·91. 299 66 0·61, 1·19 0·62, 1·23 0·64, 1·28. 364 82 0·99 0·73, 1·37 1·03 0·73, 1·41 1·09 0·78, 1·52. 0·97 1·01 1·07. 276 80 0·72, 1·32 0·74, 1·38 078, 1·46. 327 63 0·78 0·56, 1·08 0·80 0·56, 1·11 0·87 0·61, 1·20. 0·71 0·66 0·69. 0·61 56 0·50, 1·00 0·49, 0·99 0·45, 1·02. 7·17 78 0·74, 1·38 0·50, 1·32 0·63, 1·41. 1·01 0·76 0·95. HR. 95 % CI. 0·67 0·71. 28 57 0·47, 0·94 0·50, 1·02. 0·68 0·72 0·76. 443 50 0·48, 0·97* 0·51, 1·04 0·53, 1·10. 0·72 0·74 0·82. 381 57 0·51, 1·01 0·51, 1·06 0·56, 1·09. 0·78 0·75 0·83. 33 60 0·56, 1·09 0·49, 1·14 0·54, 1·26. Q5 Pfor. HR. 95 % CI. 0·67 0·73. 33 57 0·47, 0·95* 0·50, 1·06. 0·018 0·083. 0·68 0·70 0·74. 586 58 0·47, 0·97* 0·48, 1·02 0·51, 1·08. 0·025 0·052 0·095. 0·72 0·75 0·85. 475 55 0·50, 1·05 0·51, 1·10 0·57, 1·26. 0·054 0·087 0·309. 0·79 0·76 0·82. 89 66 0·56, 1·11 0·52, 1·10 0·57, 1·20. 0·338 0·381 0·620. trend. Ref., referent values. * Adjusted for age (years), sex, smoking status (current smokers or former and never smoked), type 2 diabetes at baseline (yes or no), waist:height ratio (continuous variable), baseline systolic (mmHg) and diastolic arterial blood pressure (mmHg), intervention group, use of statins (yes or no), alcohol intake (g/d), educational level (elementary school, high school and university), physical activity (metabolic), total energy intake (kJ/d (kcal/d)), family history of premature CHD (yes or no) and dyslipidaemia at baseline (yes or no), stratified by intervention centre. † Additionally adjusted for vegetable consumption (g/d), whole-grain consumption (g/d) and extra-virgin olive oil intake (g/d). ‡ Additionally adjusted for fruit consumption (g/d), whole-grain consumption (g/d) and extra-virgin olive oil intake (g/d). § Additionally adjusted for fruit consumption (g/d), vegetable consumption (g/d) and extra-virgin olive oil intake (g/d).. 1 .4. Pfor trend 0.069. Pfor trend 0.265. Pfor trend 0.005. 1.2. HR for CVD (95 % CI). 1.0. 0.8. 0.6. 0.4. <3 3–4 5–7 >7 Fruit consumption. <3 3 4 5 >5 Vegetable consumption. <5 5–6 7–8 9–10 >10 Fruit and Vegetable consumption. Fig. 1. Hazard ratios (HR) for CVD according to cumulative servings per d of fruits and vegetables. Adjusted for age (years), sex, smoking status (current smokers or former and never smoked), type 2 diabetes at baseline (yes or no), waist:height ratio (continuous variable), baseline systolic (mmHg) and diastolic arterial blood pressure (mmHg), use of statins (yes or no), alcohol intake (g/d), educational level (elementary school, high school and university), physical activity (metabolic), total energy intake (kJ/d (kcal/d)), family history of premature CHD (yes or no), dyslipidaemia at baseline (yes or no) and intervention group; stratified by intervention centre.. Downloaded from http:/www.cambridge.org/core. Universidad de Navarra, on 27 Sep 2016 at 11:45:00, subject to the Cambridge Core terms of use, available at http:/www.cambridge.org/core/terms. http://dx.doi.org/10.1017/S0007114516002099.
(9) 542. P. Buil-Cosiales et al.. Table 6. Hazard ratios (HR) of CVD according to baseline and cumulative average quintiles (Q) (yearly updated measurements of diet) of specific fruit and vegetable consumption (HR and 95 % confidence intervals)* Q1 HR. Q2 HR. Basal analysis Orange group Median (g/d) 8·6 Multivariate HR 1 0·87 Apple/pear group Median (g/d) 10·4 Multivariate HR 1 0·95 Green leafy vegetables group Median (g/d) 24·7 Multivariate HR 1 0·58 Cruciferous vegetables group Median (g/d) 0·10 Multivariate HR 1 0·96 Carotene-rich fruits and vegetables Median (g/d) 11·0 Multivariate HR 1 0·90 Lutein-rich fruits and vegetables Median (g/d) 0·7 Multivariate HR 1 0·84 Lycopene-rich fruits and vegetables Median (g/d) 16·0 Multivariate HR 1 0·95 Vitamin C-rich fruits and vegetables Median (g/d) 26·6 Multivariate HR 1 0·73 Cumulative analysis Orange group Median (g/d) 21·4 Multivariate HR 1 0·95 Apple/pear group Median (g/d) 38·6 Multivariate HR 1 1·05 Green leafy vegetables Median (g/d) 32·16 Multivariate HR 1 0·89 Cruciferous vegetables Median (g/d) 3·1 Multivariate HR 1 1·0 β-Carotene-rich fruits and vegetables Median (g/d) 16·7 Multivariate HR 1 0·96 Lutein-rich fruits and vegetables Median (g/d) 9·3 Multivariate HR 1 0·72 Lycopene-rich fruits and vegetables Median (g/d) 29·7 Multivariate HR 1 1·03 Vitamin C-rich fruits and vegetables Median (g/d) 46·3 Multivariate HR 1 0·71. 95 % CI. Q3 HR. Q4. 95 % CI. HR. 95 % CI. 52·6 0·62, 1·22. 0·77. 74·3 0·53, 1·12. 1·07. 141·6 0·77, 1·47. 62·9 0·68, 1·34. 1·02. 107 0·72, 1·44. 0·89. 0·63, 1·28. 49·5 0·41, 0·82. 0·76. 70·8 0·56, 1·04. 0·65. 8·8 0·69, 1·34. 0·91. 9·9 0·66, 1·26. 24·1 0·65, 1·24. 0·76. 9·6 0·60, 1·17. Q5 HR. 95 % CI. Pfor. trend. 167·6 0·65, 1·33. 0·703. 0·70. 0·48, 1·03. 0·141. 88·15 0·47, 0·91. 0·65. 118·26 0·47, 0·91. 0·037. 0·75. 19·7 0·53, 1·06. 0·62. 0·42, 0·90. 0·005. 33·1 0·54, 1·07. 0·78. 50·7 0·55, 1·11. 0·90. 89·55 0·64, 1·27. 0·643. 0·89. 19·7 0·63, 1·25. 0·84. 20·3 0·59, 1·20. 0·94. 59·84 0·67, 1·32. 0·961. 28·1 0·69, 1·32. 0·88. 78·5 0·63, 1·23. 0·96. 104·1 0·69, 1·33. 0·75. 123·2 0·52, 1·09. 0·224. 73·2 0·51, 1·04. 1·01. 112·6 0·72, 1·41. 0·96. 163·6 0·69, 1·32. 0·94. 244·4 0·66, 1·33. 0·853. 64·3 0·68, 1·34. 1·03. 93·6 0·72, 1·48. 1·21. 139·28 0·88, 1·68. 1·29. 208·9 0·91, 1·85. 0·126. 67·9 0·76, 1·45. 0·87. 107 0·63, 1·21. 1·02. 0·73, 1·42. 0·48. 262·5 0·31, 0·74. 0·011. 53·6 0·65, 1·24. 0·82. 70·0 0·59, 1·14. 0·86. 0·62, 1·21. 0·74. 9·3 0·74, 1·35. 0·79. 12·9 0·56, 1·11. 0·88. 0·63, 1·23. 0·64. 0·60, 1·25. 0·90. 30. 148. 0·81. 14·6 0·52, 1·17. 165. 22·8. 150. 85. 113. 20. 40 0·71, 1·31. 0·93. 0·50, 1·09. 0·174. 0·42, 0·97. 0·013. 0·61, 1·31. 0·432. 0·57, 1·15. 0·320. 30. 50. 75. 0·57, 1·16. 0·87. 0·82. 0·61, 1·12. 0·86. 0·58, 1·28. 0·80. 56·4 0·75, 1·43. 0·84. 79·5 0·60, 1·18. 0·94. 101·7 0·67, 1·33. 0·80. 0·56, 1·15. 0·241. 87·9 0·50, 1·02. 0·90. 121·1 0·63, 1·27. 1·07. 1·03. 239·5 0·73, 1·46. 0·328. 20. 27. 40. 125. 161 0·77, 1·48. * Adjusted for age (years), sex, smoking status (current smokers or former and never smoked), type 2 diabetes at baseline (yes or no), waist:height ratio (continuous variable), baseline systolic (mmHg) and diastolic arterial blood pressure (mmHg), intervention group, use of statins (yes or no), alcohol intake (g/d), educational level (elementary school, high school and university), physical activity (metabolic), total energy intake (kJ/d (kcal/d)), family history of premature CHD (yes or no) and dyslipidaemia at baseline (yes or no), stratified by intervention centre.. Most of the previous studies conducted their analyses using only one dietary assessment of diet at baseline, whereas we updated the information yearly using the FFQ from baseline to the censoring event. Some investigators(15–17) have postulated that the cumulative average of nutrient intake better represents the long-term integration of dietary exposures, and thus helps minimise undue effects of within-person variations. Moreover, changes. in diet over time may confound the diet–disease association(35). Nevertheless, we are aware that this model may likely underestimate the magnitude of the inverse association between nutrient intake and CVD(16). Unlike other authors, we did not stop updating the dietary information after an intermediate outcome occurred because our participants had risk factors before study entry (e.g. dyslipidaemia, hypertension and T2D). In addition, we. Downloaded from http:/www.cambridge.org/core. Universidad de Navarra, on 27 Sep 2016 at 11:45:00, subject to the Cambridge Core terms of use, available at http:/www.cambridge.org/core/terms. http://dx.doi.org/10.1017/S0007114516002099.
(10) Fibre intake and CVD. assumed that nutrient intakes before and after the identification of cardiovascular risk factors were equally important regarding CVD. Various studies have assessed the association between various fruits or subgroups of fruits with CVD with heterogeneous results(29,36–38). We found an inverse association between cruciferous vegetable consumption and CVD in the baseline analysis and in the cumulative analysis. We also observed a significant trend between apple and pear consumption and CVD, but only the highest cumulative consumption seemed to be inversely associated with CVD risk. Our participants increased their consumption of these fruits during follow-up, and the median of the fifth quintile became higher (265 v. 165 g/d). On the other hand, we found an inverse association between green leafy vegetables and CVD only in the baseline analysis. As the participants in the first quintile increased their consumption, we might not have had a wide enough range to appraise the association. Other authors have found different associations between some individual foods or food groups of fruits or vegetables and CVD(26,29,39), although evidence is inconsistent(36,37). The inverse association has mostly been observed for green leafy vegetables in the literature(26,29). Thus, the association between subtypes of fruits and vegetables remains unclear. The mechanisms behind the protective effect of fruit and vegetables on CVD are unclear but there is some biological basis to explain this association. Fruits and vegetables are rich sources of fibre and also antioxidants (vitamin C, Mn, β-carotene and flavonoids), K, folate and others phytochemicals. All of them could play an important role in the atherosclerosis process; they have been shown in randomised clinical trials to be associated with a reduced risk of intermediate indicators (high blood pressure(40–42), carbohydrate metabolism(43), oxidised LDL(44–46), plasma C-reactive protein(47) and vascular function(48)). Moreover, there are cohort studies that have inversely associated fruit and vegetable consumption with blood pressure(49,50), dyslipaemia(51), weight loss(52) and T2D(53), but randomised clinical trials are scarce(54). Possibly, the combined or even synergistic effects of different bioactive components in their natural food matrix may be important in the prevention of CVD(55). We are aware that the present study has the following limitations. First, although the used self-reported FFQ was validated(20,21), this method for dietary assessment may lead to some measurement errors and misclassification bias. However, the FFQ used has been extensively validated in Spain for dietary assessment, and the cumulative average estimate of consumptions may be more representative of long-term diet than a one-time assessment. Moreover, a dietitian checked the FFQ with the participant to ensure that there were no missing data. Second, even though we have adjusted for a wide range of cardiovascular risk factors, residual confounding may still explain part of the observed associations. Third, our participants have had an intervention to increase their fruit and vegetable consumption. Finally, the generalisability of our study results may be limited, because the studied population was composed of Mediterranean elderly individuals at high cardiovascular risk. However, the findings from our study are broadly consistent with those from other populations.. 543. The strengths of our study are its prospective design, the large sample size, excellent completion rates, its good compliance, the use of cumulative dietary exposures during follow-up, the homogeneity of the participants and the wide adjustment for potential confounders. In summary, this study provides further evidence for the inverse association of fruit and vegetable consumption with CVD in an elderly Mediterranean population at high cardiovascular risk. Our results suggest that people at high cardiovascular risk may need to eat more of both fruits and vegetables (more than nine servings per d) compared with people at moderate or low cardiovascular risk.. Acknowledgements The authors are very grateful to all the participants of the study for their enthusiastic collaboration; the PREDIMED personnel for their excellent assistance; and the personnel of all affiliated primary care centres for their continuous support. The study was financially supported by the official funding agency for biomedical research of the Spanish government, Instituto de Salud Carlos III (ISCIII), through grants provided to research networks specifically developed for the trial (RTIC G03/140, to RE; RTIC RD 06/0045, to MAM-G) and through Centro de Investigación Biomédica en Red de Fisiopatología de la Obesidad y Nutrición (CIBERobn), and by grants from Centro Nacional de Investigaciones Cardiovasculares (CNIC 06/2007), the Fondo de Investigación Sanitaria–Fondo Europeo de Desarrollo Regional (Proyecto de Investigación (PI) 04-2239, PI 05/2584, CP06/00100, PI07/0240, PI07/1138, PI07/0954, PI 07/ 0473, PI10/01407, PI10/02658, PI11/01647, P11/02505 and PI13/00462), the Ministerio de Ciencia e Innovación (Recursos y teconologia agroalimentarias (AGL)-2009-13906-C02 and AGL2010-22319-C03 and AGL2013-49083-C3-1-R), the Fundación Mapfre 2010, the Consejería de Salud de la Junta de Andalucía (PI0105/2007), the Public Health Division of the Department of Health of the Autonomous Government of Catalonia, the Generalitat Valenciana (Generalitat Valenciana Ayuda Complementatia (GVACOMP) 06109, GVACOMP2010181, GVACOMP2011-151), Conselleria de Sanitat y AP; Atención Primaria (CS) 2010-AP-111, and CS2011-AP-042) and Regional Government of Navarra (P27/2011). Funding sources had no role in the design and conduct of the study; collection, management, analysis and interpretation of the data; and preparation, review or approval of the manuscript. P. B.-C., D. C., J. S.-S., J. D.-E., E. R., R. E. and M. A. M.-G. designed the study; P. B.-C., I. Z., E. T., D. C., J. S.-S., J. D.-E., F. A., L. S.-M., X. P., R. E., E. G.-G., M. O.-C. and M. A. M.-G. conducted the study; P. B.-C., I. Z., E. T. and M. A. M.-G. analysed the data; P. B.-C., I. Z., E. T. and M. A. M.-G. wrote the paper and had primary responsibility for final content of the manuscript. All authors have read and approved the final version of the manuscript. P. B.-C., E. T., I. Z., M. F.-M., F. J. B.-G., J. D.-E., D. C., A. M., E. G.-G., M. O.-C., L. S.-M., X. P., R. M. L.-R., N. B., J. I. G., M. F. reports no conflicts of interest. J. S.-S. reports grants from RTIC G03/140, ISCIII, Spain, grants from CIBERobn, ISCIII, Spain,. Downloaded from http:/www.cambridge.org/core. Universidad de Navarra, on 27 Sep 2016 at 11:45:00, subject to the Cambridge Core terms of use, available at http:/www.cambridge.org/core/terms. http://dx.doi.org/10.1017/S0007114516002099.
(11) 544. P. Buil-Cosiales et al.. non-financial support from California Walnut Commission, Sacramento, CA, USA, non-financial support from Patrimonio Cultural Olivarero, Spain, non-financial support from La Morella Nuts, Spain, non-financial support from Borges SA, Spain, during the conduct of the study; non-financial support from Nut and Dried Foundation, personal fees from Instituto Danone, personal fees from Danone SA, grants from Nut and Dried Foundation, outside the submitted work. R. E. reports serving on the board of and receiving lecture fees from the Research Foundation on Wine and Nutrition (FIVIN); serving on the boards of the Beer and Health Foundation and the European Foundation for Alcohol Research (ERAB); and receiving lecture fees from Cerveceros de España. E. R. received research grants from the California Walnut Commission (Sacramento, CA) and is a non-paid member of its Scientific Advisory Committee. F. A. reports grants from Instituto de Salud Carlos III - FIS. Spain, during the conduct of the study, and personal fees from Menarini, Astra-Zeneca, outside the submitted work. M. M. reports grants from Instituto de Salud Carlos III during the conduct of the study. M. A. M.-G. received research grants from Danone and the International Nut Council.. References 1. Pereira MA, O’Reilly E, Augustsson K, et al. (2004) Dietary fiber and risk of coronary heart disease: a pooled analysis of cohort studies. Arch Intern Med 164, 370–376. 2. Dauchet L, Amouyel P, Hercberg S, et al. (2006) Fruit and vegetable consumption and risk of coronary heart disease: a meta-analysis of cohort studies. Nutr 136, 2588–2593. 3. Streppel MT, Ocké MC, Boshuizen HC, et al. (2008) Dietary fiber intake in relation to coronary heart disease and all-cause mortality over 40 y: the Zutphen Study. Am J Clin Nutr 88, 1119–1125. 4. de Munter JS, Hu FB, Spiegelman D, et al. (2007) Whole grain, bran, and germ intake and risk of type 2 diabetes: a prospective cohort study and systematic review. PLoS Med 4, e261. 5. Howarth NC, Saltzman E & Robert SB (2001) Dietary fiber and weight regulation. Nutr Rev 59, 129–139. 6. Brown L, Rossner B, Willet W, et al. (1999) Cholesterollowering effects on dietary fiber: a meta-analysis. Am J Clin Nutr 69, 30–42. 7. Whelton SP, Hyre AD, Pedersen B, et al. (2005) Effect of dietary fiber intake on blood pressure: a meta-analysis of randomized controlled clinical trials. J Hypertens 23, 475–481. 8. Streppel M (2005) Dietary fiber and blood pressure. A metaanalysis of randomized placebo-controlled trials. Arch Intern Med 165, 150–156. 9. Buil-Cosiales P, Irimia P, Ross E, et al. (2009) Dietary fibre intake is inversely associated with carotid intima-media thickness: a cross-sectional assessment in the PREDIMED study. Eur J Clin Nutr 63, 1213–1219. 10. Dauchet L, Amouyel P & Dallongeville J (2015) Fruit and vegetable consumption and risk of stroke: a meta-analysis of cohort studies. Neurology 65, 1193–1197. 11. He FJ, Nowson CA & MacGrefor GA (2006) Fruit and vegetable consumption and stroke: meta-analysis of cohort studies. Lancet 367, 320–326. 12. Crowe FL, Roddam AW, Key TJ, et al. (2011) Fruit and vegetables intakes and mortality from ischaemic heart disease. Results from the European prospective investigation into cancer and nutrition EPIC-heart study. Eur Heart J 32, 1235–1243.. 13. Liu L, Wang S & Liu J (2015) Fiber consumption and all-cause, cardiovascular and cancer mortality. A systematic review and meta-analysis of cohort studies. Mol Nutr Food Res 59, 139–146. 14. Threapleton DE, Greenwood DC, Evans CE, et al. (2013) Dietary fibre intake and risk of cardiovascular disease: systematic review and meta-analysis. BMJ 347, f6879. 15. Satija A, Yu E, Willett C, et al. (2015) Understanding nutritional epidemiology and its role in policy. Adv Nutr 6, 5–18. 16. Bernstein A, Rosner B & Willet W (2011) Cereal fiber and coronary heart disease: a comparison of modeling approaches for repeated dietary measurements, intermediate outcomes and long follow-up. Eur J Epidemiol 26, 877–886. 17. Hu FB, Stampfer MJ, Rimm E, et al. (1999) Dietary fat and coronary heart disease: a comparison of approaches for adjusting for total energy intake and modeling repeated dietary measurements. Am J Epidemiol 149, 531–540. 18. Martínez-González MÁ, Corella D, Salas-Salvadó J, et al. (2012) Cohort profile: design and methods of the PREDIMED study. Int J Epidemiol 41, 377–385. 19. Estruch R, Ros E, Salas-Salvadó J, et al. (2013) Primary prevention of cardiovascular disease with a Mediterranean diet. N Engl J Med. 368, 1279–1290. 20. Fernández-Ballart JD, Piñol JL, Zazpe I, et al. (2010) Relative validity of a semi-quantitative food-frequency questionnaire in an elderly Mediterranean population of Spain. Br J Nutr 103, 1808–1816. 21. de la Fuente-Arrillaga C, Vázquez Ruiz Z, Bes-Rastrollo M, et al. (2010) Reproducibility of an FFQ validated in Spain. Public Health Nutr 13, 1364–1372. 22. Moreiras O, Carbajal A & Cabrera L (2005) Tablas de composición de alimentos (Food Composition Tables), 9th ed. Madrid: Editorial Pirámide. 23. Willett W & Stampfer MJ (1998) Implications of total energy intake for epidemiologic analisys. In Nutritional Epidemiology, pp. 273–301 [W Willet, editor]. 2nd ed. New York: Oxford University Press. 24. Agudo A (2004) Mesasuring intake of fruit and vegetables. Background Paper for the Joint of FAO/WHO Workshop on Fruit and Vegetables for Health, 1–3 September, Kobe. www. who.int/dietphysicalactivity/publications/f&v_intake_meaurement.pdf (accessed May 2016). 25. Joshipura KJ, Hu FB, Manson JE, et al. (2001) The effect of fruit and vegetable intake on risk of coronary heart disease. Ann Inter Med 134, 1106–1114. 26. Hu D, Huang J, Wang Y, et al. (2014) Fruits and vegetables consumption and risk of stroke. A meta-analysis of prospective cohort studies. Stroke 45, 1613–1619. 27. Leenders M, Sluijs I, Ros MM, et al. (2013) Fruit and vegetable consumption and mortality. European prospective investigation into cancer and nutrition. Am J Epidemiol 178, 590–602. 28. Eshak ES, Iso H, Date C, et al. (2010) Dietary fiber intake is associated with reduced risk of mortality from cardiovascular disease among Japanese men and women. J Nutr 140, 1445–1453. 29. Bhupathiraju SN, Wedick NM, Pan A, et al. (2013) Quantity and variety in fruit and vegetable intake and risk of coronary heart disease. Am J Clin Nutr 98, 1514–1523. 30. Bamia C, Trichopoulos D, Ferrari P, et al. (2007) Dietary patterns and survival of older Europeans: the EPIC-Elderly Study (European Prospective Investigation into Cancer and Nutrition). Public Health Nutr 10, 590–598. 31. Trichopoulou A, Costacou T, Bamia C, et al. (2003) Adherence to a Mediterranean diet and survival in a Greek population. N Engl J Med 348, 2599–2608. 32. Varela-Moreiras G, Ruiz E, Valero T, et al. (2013) The Spanish diet: an update. Nutr Hosp 28, Suppl. 5, 13–20.. Downloaded from http:/www.cambridge.org/core. Universidad de Navarra, on 27 Sep 2016 at 11:45:00, subject to the Cambridge Core terms of use, available at http:/www.cambridge.org/core/terms. http://dx.doi.org/10.1017/S0007114516002099.
(12) Fibre intake and CVD 33. Helnæs A, Kyrø C, Andersen I, et al. (2016) Intake of whole grains is associated with lower risk of myocardial infarction: the Danish Diet, Cancer and Health Cohort. Am J Clin Nutr 103, 999–1007. 34. Hollænder PL, Ross AB & Kristensen M (2015) Whole-grain and blood lipid changes in apparently healthy adults: a systematic review and meta-analysis of randomized controlled studies. Am J Clin Nutr 102, 556–572. 35. Maki KC, Slavin JL, Rains TM, et al. (2014) Limitations of observational evidence: implications for evidence-based dietary recommendations. Adv Nutr 5, 7–15. 36. Oude Griep LM, Verschuren WMM, Kromhout D, et al. (2011) Colors of fruit and vegetables and 10-year incidence of stroke. Stroke 42, 3190–3195. 37. Oude Griep LM, Verschuren WMM, Kromhout D, et al. (2011) Colors of fruit and vegetables and 10-year incidence of CHD. Br J Nutr 106, 1562–1569. 38. Lai HT, Threapleton DE, Day AJ, et al. (2015) Fruit intake and cardiovascular disease mortality in the UK Women’s Cohort Study. Eur J Epidemiol. 30, 1035–1048. 39. Larsson SC, Männistö S, Virtanen MJ, et al. (2009) Dietary fiber and fiber-rich food intake in relation to risk of stroke in male smokers. Eur J Clin Nutr 63, 1016–1024. 40. Rodrigo R, Prat H, Passalacqua W, et al. (2008) Decrease in oxidative stress through supplementation of vitamins C and E is associated with a reduction in blood pressure in patients with essential hypertension. Clin Sci (Lond) 114, 625–634. 41. Aaron KJ & Sanders PW (2013) Role of dietary salt and potassium intake in cardiovascular health and disease: a review of the evidence. Mayo Clin Proc 88, 987–995. 42. John JH, Ziebland S, Yudkin P, et al. (2002) Effects of fruit and vegetable consumption on plasma antioxidant concentrations and blood pressure: a randomised controlled trial. Lancet 359, 1969–1974. 43. Bahadoran Z, Mirmiran P & Azizi F. (2013) Dietary polyphenols as potential nutraceuticals in managemens of diabetes: a review. J Diabetes Metab Disord 12, 43. 44. Yubero N, Sanz-Buenhombre M, Guadarrama A, et al. (2013) LDL cholesterol-lowering effects of grape extract used as a dietary supplement on healthy volunteers. Int J Food Sci Nutr 64, 400–406. 45. Razavi SM, Gholamin S, Mohsenian N, et al. (2013) Red grape seed extract improves lipid profiles and decreases oxidized low-density lipoprotein in patients with mild hyperlipidemia. J Med Food 16, 255–258. 46. Annuzzi G, Bozzetto L, Costabile G, et al. (2014) Diets naturally rich in polyphenols improve fasting and postprandial dyslipidemia and reduce oxidative stress: a randomized controlled trial. Am J Clin Nutr 99, 463–471. 47. Macready AL, George TW, Chong MF, et al. (2014) Flavonoid-rich fruit and vegetables improve microvascular reactivity and inflammatory status in men at risk of cardiovascular diseaseFLAVURS: a randomized controlled trial. Am J Clin Nutr 99, 479–489. 48. McCall DO, McGartland CP, McKinley MC, et al. (2009) Dietary intake of fruits and vegetables improves microvascular function in hypertensive subjects in a dose-dependent manner. Circulation 119, 2153–2160. 49. Alonso A, de la Fuente C, Martín-Arnau AM, et al. (2004) Fruit and vegetable consumption is inversely associated with blood pressure in a Mediterranean population with a high vegetablefat intake: the Seguimiento Universidad de Navarra (SUN) Study. Br J Nutr 92, 311–319. 50. Ascherio A, Hennekens C, Willett WC, et al. (1996) Prospective study of nutritional factors, blood pressure, and hypertension among US women. Hypertension 27, 1065–1072.. 545. 51. Djoussé L, Arnett DK, Coon H, et al. (2004) Fruit and vegetable consumption and LDL cholesterol: the National Heart, Lung, and Blood Institute Family Heart Study. Am J Clin Nutr 79, 213–217. 52. Buijsse B, Feskens EJ, Schulze MB, et al. (2009) Fruit and vegetable intakes and subsequent changes in body weight in European populations: results from the project on Diet, Obesity, and Genes (DiOGenes). Am J Clin Nutr 90, 202–209. 53. Li M, Fan Y, Zhang X, et al. (2014) Fruit and vegetable ntake and risk of type 2diabetes mellitus: meta-analysis of prospective cohort studies. BMJ Open 4, e005497. 54. Champagne CM, Broyles ST, Moran LD, et al. (2011) Dietary intakes associated with successful weight loss and maintenance during the weight loss maintenance trial. J Am Diet Assoc 111, 1826–1835. 55. Jacobs DR Jr, Gross MD & Tapsell LC (2009) Food synergy: an operational concept for understanding nutrition. Am J Clin Nutr 89, 1543S–1548S.. Appendix: PREDIMED study investigators University of Navarra, Primary Care Centers, Pamplona, Spain: B. Sanjulian, J. A. Martínez, M. Serrano-Martinez, A. Sánchez-Tainta, A. Garcia-Arellano, J. V. ExtremeraUrabayen, M. Ruiz-Canela, Garcia-Perez L., Arroyo-Azpa C., Sola-Larraza A., Barcena F., Oreja-Arrayago C., Lasanta-Saez M. J., Amezquta-Goñi C., Cia-Lecumberri P., Elcarte-Lopez T., Artal-Moneva F., Esparza-Lopez J. M., Figuerido-Garmendia E., Tabar-Sarrias J. A., Fernandez-Urzainqui L., Ariz-Arnedo M. J., Cabeza-Beunza J. A., Pascual-Pascual P., Martinez-Mazo M. D., Arina-Vergara E., Macua-Martínez T., Parra-Oses A. Hospital Clinic, Institut d’Investigacions Biomediques August Pi i Sunyer, Barcelona, Spain: M. Serra, A. Perez-Heras, C. Vinas, R. Casas, L. de Santamaria, S. Romero, J. M. Baena, M. Garcia, M. Oller, J. Amat, I. Duaso, Y. Garcia, C. Iglesias, C. Simon, L. l. Quinzavos, L. l. Parra, M. Liroz, J. Benavent, J. Clos, I. Pla, M. Amoros, M. T. Bonet, M. T. Martin, M. S. Sanchez, J. Altirruba, E. Manzano, A. Altes, M. Cofan, C. Valls-Pedret, A. Sala-Vila and M. Domenech. University Rovira i Virgili, Reus, Spain: M. Bullo, J. Basora, R. González, C. Molina, F. Marquez, P. Martinez, N. Ibarrola, R. Balanza, M. Sorli, J. Garcia Roselló, F. Martin, R. Tort, A. Castro, A. Isach, J. J. Cabre, J. Segarra, G. Mestres, M. GuaschFerré, A. Díaz-López, F. Paris, M. Llauradó, R. Pedret, J. Balsells, J. Vizcaíno, I. Megias, N. Guillen and J. Fernandez-Ballart. Institute de Recerca Hospital del Mar, Barcelona, Spain: M. Fitó, S. Tello, J. Vila, R. de la Torre, D. Munoz-Aguayo, R. Elosua, J. Marrugat and M. Ferrer. University of Valencia, Valencia, Spain: P. Carrasco, C. Ortega-Azorín, E. M. Asensio, R. Osma, R. Barragán, F. Francés, M. Guillén, C. Saiz, O. Portolés, F. J. Giménez, O. Coltell, P. Guillem-Saiz, L. Quiles, V. Pascual, C. Riera, M. A. Pages, D. Godoy, A. Carratalá-Calvo, M. J. Martín-Rillo, E. Llopis-Osorio, J. Ruiz-Baixauli and A. Bertolín-Muñoz. University Hospital of Alava, Vitoria, Spain: I. Salaverria, T. del Hierro, J. Algorta, S. Francisco, A. Alonso, J. San Vicente, A. Casi, E. Sanz, I. Felipe, J. Rekondo and A. Loma-Osorio. University of Malaga, Malaga, Spain: E Gómez-Gracia, J. Wärnberg, R. Benitez Pont, M. Bianchi Alba, Navajas, R. Gomez-Huelgas, J. Martinez-Gonzalez, V. Velasco Garcia, J. de. Downloaded from http:/www.cambridge.org/core. Universidad de Navarra, on 27 Sep 2016 at 11:45:00, subject to the Cambridge Core terms of use, available at http:/www.cambridge.org/core/terms. http://dx.doi.org/10.1017/S0007114516002099.
(13) 546. P. Buil-Cosiales et al.. Diego Salas, A. Baca Osorio, J. Gil Zarzosa, J. J. Sanchez Luque and E. Vargas Lopez. Instituto de la Grasa, Consejo Superior de Investigaciones Científicas, Sevilla, Spain: J. Sanchez Perona, E. Montero Romero, M. Garcia-Garcia and E. Jurado-Ruiz. Instituto de Investigación Sanitaria de Palma (IdISPa), Hospital Universitario Son Espases, Palma de Mallorca, Spain. M. Fiol, D. Romaguera, M. García-Valdueza, A. Proenza, R. Prieto, G. Frontera, S. Munuera, M. Vivó, F. Bestard, J. A. Munar, L. Coll, F. Fiol, M. Ginard, A. Jover, J. García. Department of Family Medicine, Primary Care Division of Sevilla, Sevilla, Spain: J. Lapetra. M. Leal, E. Martinez, M. Ortega-Calvo, P. Roman, P. Iglesias, Y. Corchado, E. Mayoral, L. Mellado, L. Miró, J. M. Lozano and C. Lama. School of Pharmacy, University of Barcelona, Barcelona, Spain: A. I. Castellote-Bargallo, A. Medina-Remon and A. Tresserra-Rimbau.. University of Las Palmas de Gran Canaria, Las Palmas, Spain: J. Alvarez-Perez, E. Diez Benitez, I. Bautista Castaño, I. Maldonado Diaz, A. Sanchez-Villegas, M.J. Férnandez-Rodríguez, F. Sarmiendo de la Fe, C. Simon Garcia, I. Falcon Sanabria, B. Macias Gutierrez, and A. J. Santana Santana. Hospital Universitario de Bellvitge, Hospitalet de Llobregat, Barcelona, Spain: E. de la Cruz, A. Galera, Y. Soler, F. Trias, I. Sarasa, E. Padres and E. Corbella. Primary Care Division, Catalan Institute of Health, Barcelona, Spain: M. A. Muñoz, C. Cabezas, E. Vinyoles, M. A. Rovira, L. Garcia, G. Flores, P. Baby, A. Ramos, L. Mengual, P. Roura, M. C. Yuste, A. Guarner, A. Rovira, M. I. Santamaria, M. Mata, C. de Juan and A. Brau. Other investigators of the PREDIMED network: J. A. Tur (University of Balearic Islands), M. P. Portillo (University of Basque Country) and G. Saez (University of Valencia).. Downloaded from http:/www.cambridge.org/core. Universidad de Navarra, on 27 Sep 2016 at 11:45:00, subject to the Cambridge Core terms of use, available at http:/www.cambridge.org/core/terms. http://dx.doi.org/10.1017/S0007114516002099.
(14)
Figure


Documento similar
The difficulty of obtaining an index of historical social welfare in the province of Almeria to demonstrate whether Almeria's fruit and vegetable industry represents a
In the present study, whilst controlling for socio-economic status and lifestyle factors (physical activity and screen time), we assess the relationships between nutrient intake or
Significant differences in cardiometabolic, renal, and anthropometric parameters among choline/betaine consumption quartiles at baseline were compared by 1-factor ANCOVA test
The main findings of our study suggest that a combi- nation of health behaviors (daily physical activity, appropriate TV viewing time, sufficient sleep and adequate daily fruit
The validity of food and nutrient intake obtained with DH-E was estimated using Pearson correlation coefficients between the DH-E conducted at the end of the study (DH-E2) and the
Combined effects of water stress and fruit thinning on fruit and vegetative growth of a very early-maturing peach cultivar: assessment by means of a fruit tree model,
In the south-east of Spain, some of the main producer groups or marketing companies of fruit and vegetable products are developing short agri-food channels for fresh fruits
High consumption of fruit and vegetables is one of the most usual recommendations for a healthy diet to reduce the risk of cancer and cardiovascular disease, which are the two
