The Synaptic Protein Neuroligin 1 Interacts with the Amyloid beta Peptide Is There a Role in Alzheimer's Disease?
11
0
0
Texto completo
(2) Biochemistry. Article. C-terminal domain that contains a type I PDZ-binding motif which interacts with the third PDZ domain of PSD-95 protein.18 There are four types of neuroligins: NL-1 is enriched in glutamatergic excitatory synapses, while NL-2 is present in GABAergic inhibitory synapses.16,17 On the other hand, NL-3 and NL-4 have been found in both synapses; also, NL-4 has been found in extraneuronal tissues.15,16 Initially NLs were identified as ligands for β-neurexin; thereby a role in mediation of cell−cell adhesion was proposed.14 Later, NLs were shown to be sufficient to induce the formation of new functional presynaptic terminals in vitro, suggesting a key role in the specification and consolidation of the synapse.16 We report here that Aβ interacts with the extracellular domain of NL-1, suggesting a relevant role in the targeting of Aβo to the postsynaptic sites of excitatory synapses.. ■. carboxymethylated dextran matrix of a research grade CM5 chip (Biacore, Uppsala, Sweden). Reference channel was prepared in the absence of sNL. Reference data were subtracted from the sample flow channel to obtain specific NL binding. Aβ42 was injected over the sNL surfaces as a set of 5 increasing concentrations. A flow rate of 50 μL/min was used. sNL surface was regenerated by a 50 μL/min injection of regeneration solution (10 mM HEPES, pH 7.4, 1 M NaCl, 5 mM EDTA, 0.005% (v/v) surfactant P20) for 30 s. For kinetic experiments sensorgrams were fitted using a 1:1 stoichiometry model (Bievaluation 3.1, Biacore Inc.).21 Aβ Aggregation Assay. Aβ was dissolved in anhydrous and sterile DMSO at 15 mg/mL concentration and then was diluted in PBS, pH 7.4. The sample was subjected to a basic shock adding 2 M NaOH to reach pH 12. Then, the sample was neutralized with 1 M HCl. For the kinetics assays we used thioflavin-T (ThT) assay. In this case to make the analysis of the polymerization process easier we used Aβ1-40 instead of Aβ1-42. Aβ1-40 at a final concentration of 50 μM PBS (pH 7.4) was incubated at room temperature with increasing concentrations of sNL-1. ThT (0.5 mM) fluorescence was measured by excitation at 450 nm and emission at 485 nm.24,25 For kinetics experiments, we incubated 50 μM Aβ42 in the absence or the presence of 1 nM or 1 μM NL-1, and the amyloid formation was measured by the increasing in ThT fluorescence, using 96-well plates. Each point was the average of 6 points. The data were analyzed using GraphPad prims software. Electron Microscopy. Fresh aliquots of samples were diluted 1:3 in water, and 5 μL was placed on Parlodion/carbon coated 300-mesh copper grids for 1 min. Excess sample was removed, and 15 μL of 2% aqueous uranyl acetate was placed onto the grid for 30 s, followed by removal of excess staining solution with filter paper and air drying. Observations were carried out using Philips Tecnai 12 electron microscope. The measurements of Aβ assemblies were carried out using Image J software (NIH), and quantification of amyloid aggregates and fibrils was done using Sigma software. The quantification was made in blind, analyzing 5 pictures and 3 different microscopic fields in each case. Where the aggregates were highly electron dense we quantify the material at the edge of the observed aggregate. Also, the Aβo used in these studies were defined by electron microscopy as mainly protofibril assemblies.24 Immunofluorescence and Image Analysis. Hippocampal neurons were prepared as described24 on coverslips within 24-well plates at a plating density of 30,000 cells/coverslip, fixed with 4% paraformaldehyde/4% sucrose in PBS for 20 min, permeabilized with 0.2% Triton X-100 for 5 min, blocked with 0.2% gelatin, and stained with NL-1 and Aβ oligomer (A11 Chemicon International) antibody. Digital images of neurons on coverslips were captured with a Zeiss confocal microscope using a 63X/1.4 numerical aperture oil-immersion objective. Statistical Analysis. Data were expressed as the mean ± SE of the values from the number of experiments, as indicated in the corresponding figures. Data were evaluated statistically by using Student’s t test, with p < 0.01 or p < 0.05 considered significant.24. MATERIALS AND METHODS. Materials. Aβ (1-40) and (1-42) were purchased from Genemed Biotechnology (San Francisco, CA). Monoclonal antibody 6E10 against Aβ total and polyclonal (rabbit) antibody A11 against Aβo were purchased from Chemicon International (Temecula, CA). Extracellular domain of NL-1 (sNL-1) and 2 (sNL-2) and the full length NL-1 and 2 plasmids were constructed as previously described.21 The concentrations of these proteins were determined using the Micro BCA Protein Assay Kit from Pierce. The biological activity of sNL-1 and sNL-2 was assayed by their ability to bind the extracellular domain of β-neurexin using Surface Plasmon resonance (SPR) with a Biacore 3000 instrument. 21 Fluorescence Spectroscopy. The fluorescence spectra of the extracellular domains of NL-1 (sNL-1) and NL-2 (sNL-2) were measured on a Jasco FP6200 spectrofluorometer. The emission spectra obtained in the Aβ and acrylamide quenching experiments were produced with an excitation wavelength of 295 nm and a bandwidth of 5 nm. The samples were diluted in filtered PBS, pH 7.4, and the spectra were corrected for solvent and dilution effects, using as a blank for each point the solution with Aβ in the absence of NL. It has been shown that the intensity of the fluorescence quenching depends on the concentration of a quencher [Q], and this behavior is described by the Stern−Volmer equation (eq 1.0 in Supporting Information).23 The intensity of initial fluorescence corresponds to F0 , and the fluorescence intensity on function of the quencher [Q], to F. The slope of Stern−Volmer plot corresponds to the Stern−Volmer constant Ksv , and this value is proportional to the dynamic quenching of the fluorophore and reflexes its degree of exposition to the solvent.23 The Stern−Volmer experiments with Aβ and acrylamide as quencher were performed using these settings: Titrations were made by adding small aliquots of Aβ42 stock solution (or acrylamide) to 3 mL of NL-1 or NL-2 solution (100 nM) assuring that no more than a 2% dilution was made by the end of each experiment.22,23 Also, the blank used for each point was the solution with acrylamide and Aβ (when corresponded) in the absence of NL. Analysis of the data was done following the Stern−Volmer equation, and a mathematical derivation of this equation was made. The equations are in the Supporting Information. Surface Plasmon Resonance Analysis of Aβ−NL Interaction. NL−Aβ1-42 binding was analyzed at 25 °C using HEPES buffer, pH 7.4, on a Biacore 3000 instrument. NL-1 or NL-2 extracellular domain was covalently bound to the. ■. RESULTS AND DISCUSSION. Interaction between Extracellular Domain of NL-1 and Aβ. In order to study the interaction between Aβ and NLs, we first purified the extracellular domain of NL-1. 8128. dx.doi.org/10.1021/bi201246t | Biochemistry 2011, 50, 8127−8137.
(3) Biochemistry. Article. (FLAG-NL-1-691) and NL-2 (FLAG-NL-2-615).26 We tested that the purified proteins kept their biological binding capacity of β-neurexin using surface plasmon resonance as described by Comoletti et al.21 To determine a possible in vitro interaction between the extracellular domain of NL-1 (sNL-1) with Aβ1− 42, we monitored the wavelength of maximum intrinsic fluorescence emission of the tryptophan (Trp). The extracellular domain of NL-1 contains 13 residues of Trp, 21 whereas Aβ1-42 has no Trp residues. We therefore reasoned that binding of Aβ1-42 to sNL-1 might be detectable if Aβ quenched Trp fluorescence. Samples of 100 nM sNL-1 mixed with excess Aβ1-42 were excited at 295 nm, and Trp emission spectra were collected (Figure 1A). Emission spectra of sNL-1 with Aβ showed a decrease in the fluorescence intensity with increasing Aβ concentration (Figure 1A) and a 4 nm red shift in the wavelength for maximum fluorescence from 338 to. 342 nm (arrow in Figure 1A). This red shift suggests an exposition of the Trp from sNL-1 to more polar environment in the presence of Aβ1-42. Then, we evaluated the symmetry degree of sNL-1 emission spectrum by analysis of the spectrum moments.23 The curves obtained for the normalized spectrum were asymmetric, suggesting the presence of different Trp populations in sNL-1, and this asymmetry was kept in the presence of Aβ (SI Figure 1A). The values obtained for M0 and M1 were different in all the treatments, confirming the initial idea that sNL-1 has at least two Trp populations exposed differentially to polar environments, and the presence of Aβ could stimulate the exposition of more Trp from sNL-1 to a more polar environment (SI Figure 1B). Then, we evaluated the linearity of sNL-1 quenching by Aβ. We used 1.4 μM sNL-1 that were titrated with increasing concentrations of Aβ1-42, a linear reduction in the maximum of fluorescence intensity of. Figure 1. Aβ-NL-1 complex association. The binding between Aβ with sNL-1 was monitored by Trp fluorescence spectra. (A) Trp spectrum of 100 nM sNL-1 in the presence of 0 (red line), 10 (blue line), 100 (light green line), 1,000 (dark green line), and 10,000 nM (pink line) Aβ1-42. The arrow shows the shift in the maximum of sNL-1 fluorescence intensity. (B) Stern−Volmer graph for sNL-1 in the presence of Aβ. The graph shows a representative curve of static quenching of 1.4 μM sNL-1 in presence of increasing Aβ1-42 concentration. The data used to calculate F0 /F was the fluorescence intensity obtained at 339 nm. (C) Mathematical derivation of the original Stern−Volmer formula was graphed (eq 1.6 in Supporting Information). (D) Graph corresponding to eq 1.8 from Supporting Information, using a model of fractional accessibility of the quencher toward the fluorophores. The cooperative value for Aβ−sNL-1 interaction obtained was 1.4. (E) Stern−Volmer analysis of sNL-1 in the presence of the dynamic quencher acrylamide. The white circles represent the curve of Stern−Volmer for 1.4 μM sNL-1 in the presence of increasing acrylamide concentrations. The black circles represent curve for 1.4 μM sNL-1 preincubated with equimolar Aβ1-42 concentration for 15 min. Then, titration with increasing acrylamide concentration was performed. (F) Interaction between Aβ and sNL-1 by SPR. Increasing concentrations of Aβ were injected over a surface of sNL-1 attached to a CM5 Biacore chip. RU = resonance units. 8129. dx.doi.org/10.1021/bi201246t | Biochemistry 2011, 50, 8127−8137.
(4) Biochemistry. Article. sNL-1 in the presence of Aβ was observed (SI Figure 1C). Then, we used as a control the reverse sequence of Aβ1-42 (Aβ42-1). The presence of the reverse peptide did not affect the fluorescence of NL-1 even at high concentrations (15 μM) (SI Figure 1D). Then, the type of quenching suffered by sNL-1 in the presence of Aβ1-42 was analyzed: dynamic or static. The analysis of quenching for sNL-1 induced by Aβ using the Stern−Volmer equation yielded a typical curve of a protein with more than one Trp population (Figure 1B); the sNL-1 fluorescence quenching was proportional until 1.6 μM Aβ1-42. Therefore, just one fraction of the total Trps from sNL-1 was quenched by Aβ1-42. On the other hand, the second part of the curve shows populations with different sensitive degree to quenching induced by the peptide (Figure 1B). The sNL-1 fluorescence intensity is given for both population of Trp: Aβ-accessible and Aβ-inaccessible (eq 1.1). Because of the complexity of the curve obtained with the Stern−Volmer analysis, we performed a mathematical derivation of the original Stern−Volmer (eq 1.6). 23 Figure 1C shows the curve obtained, where a clear exponential tendency was observed, suggesting the formation of a complex between sNL-1 and Aβ, which correspond to static quenching of sNL-1 intrinsic fluorescence and a cooperation degree between both interacting molecules different than 1. Then, a mathematical correction for the cooperative value was performed, which resulted to be 1.44 (eqs 1.7 and 1.8). When eq 1.8 was graphed, using a model of fractional accessibility of the quencher toward the fluorophores, a linear tendency was obtained, where the fa −1 was the “y” intersection and (fa Ksv n )−1 was the slope according with this analysis (Figure 1D); the fraction of fluorophores that are accessible to the quencher was 0.079 ± 0.003, and its Ksv was 0.75 ± 0.02 μM, which is considered the dissociation constant at equilibrium in a static quenching. Finally, we compared the effect of Aβ as a quencher respect to acrylamide a dynamic quencher widely used.23 We performed a titration of 1.4 μM sNL-1 with increasing acrylamide concentrations. The data obtained were graphed for Stern−Volmer analysis. Figure 1E shows in the white circles curve the existence of different Trp populations in sNL-1, in agreement with our previous observations. The first population identified corresponds to the first 10 points (Figure 1E, red line), where the sNL-1 quenching was proportional to the acrylamide concentration. The other population was less exposed to the quencher. Then, we preincubated 1.4 μM sNL-1 with equimolar amount of Aβ142 for 15 min, and the effect of acrylamide on sNL-1 Trp fluorescence was evaluated. As shown in Figure 1E (black circles) acrylamide quenching behavior changed from a downward curvature to a linear response with estimation of Ksv of 2.8 nM, suggesting that in the presence of Aβ sNL-1 has Trp residues in an environment more accessible to acrylamide. These results suggest that sNL-1 binds Aβ1-42, forming a complex. This interaction triggers in sNL-1 a conformational change, consistent with an exposition of occluded Trp residues to the solvent; however, more studies are necessary to determine the contribution of each Trp residue to this conformational change. On the other hand, we decided to evaluate the interaction between NL-1 and Aβ using another technique: surface plasmon resonance (SPR). 21 The extracellular domain of NL-1 was attached to the sensor surface until reach 1,000 response units, then a range of Aβ concentrations from 1 nM to 50 μM was injected, and the. binding was monitored and obtained as a sensogram (Figure 1F and SI Figure 2A). The binding response was proportional to increasing Aβ concentrations, and using rates of association and dissociation, we estimated an equilibrium constant KD of ∼250 nM. Regardless, the KD obtained by SRP was lower than using intrinsic fluorescence; both values are in the nanomolar range. We think that the difference between both values could be explained because in the case of the intrinsic fluorescence the KD obtained is related to the TRP population in NL-1; however, for the SRP measurement is related to the whole protein. We want to stress, however, that using two different experimental approaches, we were able to determine that the extracellular region of NL-1 directly interacts with Aβ. Since, NL-2 is found in inhibitory synapses.28 Therefore, we decided to evaluate whether Aβ1-42 peptide interacts with the extracellular domain of NL-2 (sNL-2) using intrinsic fluorescence and SPR. The fluorescence emission spectrum of 100 nM sNL-2 was registered (Figure 2A, red line).. Figure 2. Interaction of sNL-2 with Aβ. (A) Spectrum of fluorescence quenching of 100 nM sNL-2 with increasing concentration of Aβ1-42 as follows: 0 (red line), 10 (blue line), 100 (light green line), 1,000 (dark green line), 10,000 (pink line) nM. The presence of Aβ1-42 produces a small decrease in the fluorescence intensity, and no shift in the fluorescence intensity maximum was observed. (B) Stern−Volmer graph for 1.4 μM sNL-2 in the presence of increasing Aβ1-42 concentrations. A small quenching of the sNL-2 was observed in the presence of Aβ, suggesting a weak interaction of both molecules. (C) Interaction between Aβ and sNL-2 by surface plasmon resonance. Increasing concentrations of Aβ1-42 were injected over a surface of sNL-2 attached to a CM5 Biacore chip. RU = resonance units. 8130. dx.doi.org/10.1021/bi201246t | Biochemistry 2011, 50, 8127−8137.
(5) Biochemistry. Article. The maximum of fluorescence intensity was reached at 341 nm, and this value did not change in the presence of Aβ1-42 (Figure 2A). The graph for the quenching of 1.4 μM sNL-2 fluorescence in the presence of increasing Aβ concentrations showed poor quenching of sNL-2 fluorescence, suggesting that the interaction between both proteins is weak (Figure 2B). Additionally, sNL-2 was attached to the SPR sensor and increasing Aβ concentrations were injected; no apparent interaction between both proteins was observed, compared to sNL-1-Aβ (Figure 2C and SI Figure 2B). Many proteins have been described as possible Aβo receptors at the synapse, including NMDAr,29 Frizzled,30 and Prion protein (PrP),31,32 among others; however, biochemical approaches using purified synaptic proteins have been poor used to corroborate a direct biochemical interaction of a protein with Aβ.29−32 Using biochemical approaches, we showed that Aβ interacts directly with the extracellular domain of NL-1; however, the Aβ interaction with NL-2 is uncertain. Extracellular Domain of NL-1 Modulates Amyloid Polymerization. Since we determined that sNL-1 interacts with Aβ, we decided to study whether this interaction may influence the aggregation process of Aβ using ThT fluorescence.6,33−36 For this experiment we used Aβ1-40, which has a slower polymerization kinetic than Aβ1-42 and is the most abundant Aβ peptide in the brain.33−35 50 μM Aβ1-40 was incubated at room temperature, and the increase in ThT fluorescence associated with amyloid fibril formation was measured at different times in the absence or the presence of increasing concentrations of sNL-1 (Figure 3). We observed that Aβ1-40 incubated in the absence of sNL-1, increased the ThT fluorescence after a lag phase of 400 min, and reached a plateau within 600 min (Figure 3A). At the end of the incubation (24 h), a sample was examined by transmission electron microscopy (TEM),37 confirming the formation of amyloid fibrils (Figure 3B). On the other hand, when Aβ1-40 was incubated with increasing concentrations of sNL-1, the rise in ThT fluorescence was inversely proportional to sNL-1 concentration. 1 nM sNL-1 accelerated the amyloid formation, with an absence of lag phase (Figure 3C). 10 nM sNL-1 accelerated the amyloid formation, similar to the 1 nM effect (data not shown). Also, after 24 h incubation the presence of fibrillar aggregates was detected by TEM (Figure 3D). The amount of amyloid aggregate formed under control condition and 1 nM NL-1 was similar after 24 h of incubation, with big electron dense aggregates as can be appreciated in SI Figure 3A,B corresponding to a representative picture taken with electron microscope using a magnification of 6.8×. In contrast, 100 nM sNL-1 showed a lag phase of 500 min, with a subtle decrease in maximum fluorescence (Figure 3E), in agreement with the lower amount of fibrillar aggregates observed by TEM (Figure 3F). Aβ1-40 incubated with 1 μM sNL-1 showed a lag phase of 600 min, and the maximum fluorescence reached was half of the control, suggesting that Aβ1-40 aggregation was inhibited by high sNL-1 concentrations (Figure 3G); however, at a low magnification some small aggregates were observed (SI Figure 3C). No big amyloid aggregates were found after 24 h incubation (SI Figure 3D) nor were mature amyloid fibrils observed after 24 h aggregation in the presence of 1 μM sNL-1; however, the presence of Aβ oligomers with a protofibrillar assembly was detected (Figure 3H). The aggregation kinetics of Aβ1-42 using a well plate reader was also studied. Aβ1-42 was incubated with 1 nM or 1 μM NL-1,. Figure 3. sNL-1 modulates Aβ aggregation. To follow the formation of amyloid aggregates, ThT fluorescence measurements and electron microscopy were performed. (A) Time course of 50 μM Aβ1-40 aggregation monitored by ThT fluorescence, where Aβ follows a typical sigmoid curve with nucleation, elongation, and plateau phases. (B) After 24 h incubation, the presence of amyloid fibrils was observed. (C) 50 μM Aβ1-40 was incubated with 1 nM sNL-1; the complete absence of a nucleation phase was observed compared with the control curve (discontinue line). (D) At 24 h, the presence of amyloid fibrils similar to the control was observed. (E) 50 μM Aβ1-40 was incubated with 100 nM, where the aggregation kinetics was similar to the control curve, but the maximum of aggregation reached was less than the control. (F) After 24 h, the morphology of the aggregates observed was mostly amyloid fibrils accompanied by amyloid oligomers. (G) 50 μM Aβ1-40 was incubated with 1 μM sNL-1; the aggregation kinetic curve showed an increase in the nucleation phase time, with a critical decrease in the maximum of aggregation reached. (H) Morphology of Aβ aggregates after 24 h incubation showed abundant amyloid oligomers present. Scale bar = 100 nm.. and the polymerization was followed using ThT fluorescence. As we showed for Aβ1-40, 1 nM NL-1 accelerated the aggregation (SI Figure 3E). On the other hand, 1 μM NL-1 inhibited the Aβ polymerization (SI Figure 3F). All together, these results suggest that at high ratio Aβ: sNL-1 the peptide aggregation is accelerated; however, when the ratio decreases, 8131. dx.doi.org/10.1021/bi201246t | Biochemistry 2011, 50, 8127−8137.
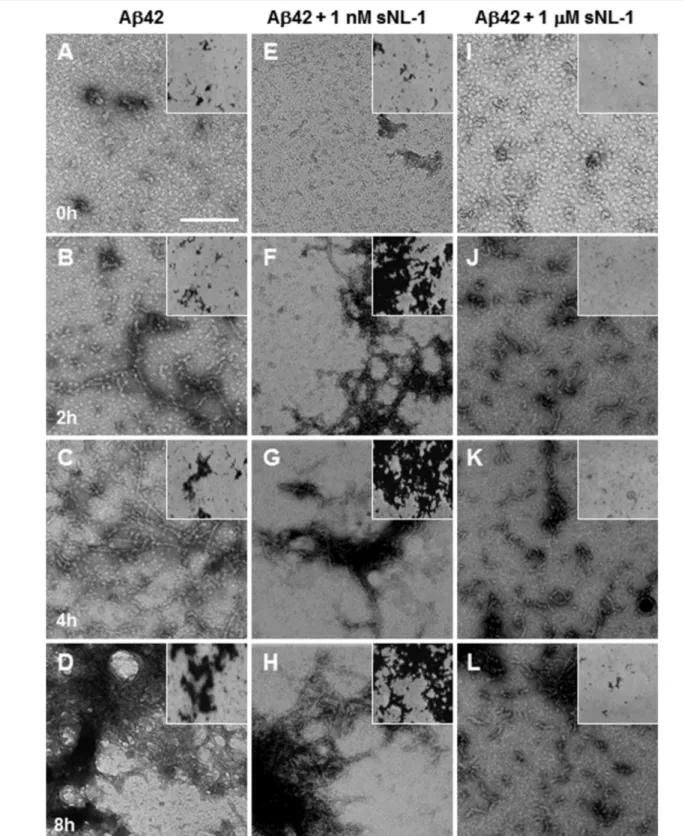
(6) Biochemistry. Article. the aggregation process seems to be inhibited. Furthermore, 1 μM sNL-1 produces Aβo, mostly protofibril assemblies, even after 24 h incubation, suggesting a stabilization of these oligomeric forms.. NL-1 Stabilizes Oligomeric Assemblies of Aβ. To determine the effect of sNL-1 on the formation of Aβo, we followed Aβ1-42 polymerization by TEM. In these experiments, 50 μM Aβ1-42 alone or in the presence of 1 nM or 1 μM sNL-1. Figure 4. sNL-1 stabilizes the Aβ oligomer conformation. Negative staining of samples after a time course aggregation of 50 μM Aβ1-42 (A−D) or in the presence of 1 nM (E−H) or 1 μM (I−L) sNL-1 followed by transmission electron microscopy after 0, 2, 4, and 8 h incubation at 37 °C. (A, E, I) correspond to control at 0 incubation time; (B, F, J) 2 h incubation, where the presence of amyloid fibrils was observed for Aβ plus 1 nM sNL-1. On the other hand, with 1 μM sNL-1 almost pure oligomeric assemblies rich in protofibrils structures were observed; (C, G, K) 4 h incubation and (D, H, L) 8 h incubation, only a few amyloid fibrils were observed. The images were obtained at 49,000×. Each inset corresponds to the same condition, but the photo was obtained at 23,000×. Scale bar = 100 nm. 8132. dx.doi.org/10.1021/bi201246t | Biochemistry 2011, 50, 8127−8137.
(7) Biochemistry. Article. incubation the assemblies grew up over 750 nm (Figure 5B, black bars). In the case of Aβ1-42 incubated with 1 μM sNL-1, at 2 h incubation the major assembly population was between 10 and 50 nm length (Figure 5C, blue bars). This high amount of short length assemblies were observed also at 4 h incubation (Figure 5C, blue bars). At 8 h incubation, the main assembly population had a length between 25 and 100 nm (Figure 5C, black bars). Finally, we evaluated the molecular size of aggregates formed by Aβ1-42 in the absence or presence of sNL-1 using nondenaturant gradient gels. Following the same experimental approach used before, 50 μM Aβ1-42 was incubated alone or with 1 nM or 1 μM sNL-1, and at 0, 2, 4, and 8 h of incubation at 37 °C an aliquot was taken, centrifuged, and the supernatant analyzed by Western blotting (Figure 5D). At the beginning Aβ1-42 was mostly a monomer (∼4 kDa) and with increasing incubation times, higher molecular weight species were formed. For Aβ1-42 with 1 nM sNL-1, initially a 4 kDa band corresponding to Aβ monomer was observed, and thereafter several bands with higher molecular band in ladder (bands multiple of 4 kDa) were observed, in which the molecular weight increases in a time-dependent manner. On the other hand, Aβ1-42 incubated with 1 μM sNL-1 immediately formed an aggregate of 52 kDa, which was present throughout the experiment until 8 h incubation (Figure 5D). This band corresponds to an Aβo assembly formed by 12-mers, assembly broadly described.4,5 These results suggest that the amyloid fibril formation is accelerated when Aβ was incubated with 1 nM sNL-1 whereas 1 μM sNL-1 inhibited the formation of amyloid fibrils, while increasing the formation of Aβo, which remained intact in time.. was incubated up to 8 h at 37 °C without any stirring. A clearly defined amyloid aggregate was not observed at time 0 of incubation neither with Aβ alone nor with sNL-1 (Figure 4A,E,I). Following 2 h incubation at 37 °C, we observed some Aβ fibrils accompanied by small protofibrillar oligomeric assemblies (Figure 4B). This oligomeric population decreased with increasing incubation times, while the fibril population increased (Figure 4C,D). After 8 h incubation a larger amount of amyloid fibril aggregates were observed (Figure 4D). In the case of Aβ incubated with 1 nM sNL-1, the presence of more mature amyloid aggregates were observed after 2 h incubation at 37 °C (Figure 4F), which formed more compact aggregates as the incubation time increased (Figure 5G,H). On the other hand, the presence of 1 μM sNL-1 produced oligomeric assemblies in the absence of amyloid fibrils at 2 h incubation (Figure 5J). After 4 and 8 h incubation, the oligomeric assemblies rich in protofibrils structures were conserved as is shown in parts K and L of Figure 5, respectively. Then, a quantitative analysis of Aβ1-42 assemblies formed was achieved. Serial microphotographs were selected and the amount of different assemblies was grouped by their length. In the case of Aβ1-42, the predominant assembly population at 2 h incubation was between 25 and 100 nm length (Figure 5A, blue bars) and the length increased with the incubation time to 100−500 nm at 4 h (Figure 5A, red bars) and to 200−750 nm at 8 h incubation (Figure 5A, black bars). When Aβ was incubated with 1 nM sNL-1, the main assembly population at 2 h incubation was found between 200 and 500 nm length (Figure 5B, blue bars), at 4 h incubation most of the assemblies were longer than 500 nm (Figure 5B, red bars), and after 8 h. Figure 5. sNL-1 possible nucleating agent in Aβ aggregation. Quantification of the effect of sNL-1 on Aβ assemblies length. (A) Aβ1-42 alone, (B) Aβ1-42 in the presence of 1 nM sNL-1, or (C) Aβ1-42 plus 1 μM sNL-1 at time 0 (green), 2 (blue), 4 (red), and 8 h (black) incubation at 37 °C. The quantification was made using Image J software of 3 photographs of 3 independent experiments of the aggregate found in the length range specify in the graph. (D) Western blot of soluble aggregates of 50 μM Aβ1-42 in the presence of 1 nM or 1 μM sNL-1 incubated at 37 °C. At the different incubation times, an aliquot was taken and centrifuged at 20,500g to obtain the soluble material, which was loaded in a 10−15% acrylamide nondenaturant gradient gel. Aβ was visualized using the antibody anti-Aβ 6E10. The Western blot shows that in the presence of 1 μM sNL-1 a predominant band around 52 kDa, molecular weight corresponding to 12-mer Aβ, is indicated by the arrow. 8133. dx.doi.org/10.1021/bi201246t | Biochemistry 2011, 50, 8127−8137.
(8) Biochemistry. Article. With the results obtained, we hypothesized that the possible mechanism by which sNL-1 could be interacting with Aβ and acting as nucleating agent. In that case, when sNL-1 is aggregated at high Aβ:sNL-1 ratio, low Aβ nucleus are formed and there are abundant Aβ free to elongate and generate amyloid fibrils. However, at a low Aβ:sNL-1 ratio an increased amount of Aβ nucleus are formed, and there are not enough free Aβ to elongate and form amyloid fibrils. To test this hypothesis, we performed two different experiments. First, we evaluated Aβ incorporation to formed fibrils, as the fibril elongation process occurs in the presence of increasing sNL-1 concentrations. The experimental approach is shown in Figure 6A, where 50 μM Aβ1-42 was aggregated for 24 h at 37 °C in a 96-well plate. Then, after blocking the wells, Aβ fibrils were incubated with monomers of Aβ-biotinylated in the absence or presence of 1, 100 nM or 1 μM sNL-1 for 4 h and then revealed with a neutravidin conjugated to a fluorescence tag. The presence of 1 nM sNL-1 increased the incorporation of new monomers to preformed Aβ1-42 fibrils compared to the control in the absence of sNL-1. On the other hand, the presence of 100 nM and 1 μM sNL-1 decreased the incorporation of new monomers to the fibrils, suggesting that the Aβ-sNL-1 nucleus formed were not able to incorporate and elongate Aβ fibrils (Figure 6B). The second experimental approach was based on the hypothesis that a low Aβ:sNL-1 ratio could produce lots of Aβ-sNL-1 nucleus, decreasing the amount of free Aβ available to elongate and form Aβ fibrils, so under this condition, when more Aβ monomer is aggregated an increase in Aβ polymerization should be observed. Figure 6C shows the aggregation of 50 μM Aβ1-42 alone or with 1 μM sNL-1 followed with ThT fluorescence. As we showed before using Aβ1-40 (Figure 3G), the presence of 1 μM sNL-1 inhibited Aβ1-42 aggregation analyzed by ThT fluorescence (Figure 6C, compared red line with black line) until 24 h aggregation at room temperature and under continuous stirring. After 24 h, we added to both conditions 20 μM Aβ1-42 monomers, and the amyloid formation was measured by ThT fluorescence. The graph shows a small increase in the ThT fluorescence for Aβ1-42 alone, as expected. However, a fast increase in ThT fluorescence was observed for Aβ incubated with 1 μM sNL-1, suggesting that Aβ-sNL-1 nucleus were formed, and they were expecting new free Aβ to initiate further polymerization (Figure 6C). Therefore, our results suggest that sNL-1 forms a complex with Aβ; however, more experiments are necessary to confirm this suggestion. Finally, to have a more physiological idea of the interaction between NL-1 and Aβ, we performed some immunoprecipitation experiments. Full length FLAG-NL-1 or FLAG-NL-2 was transfected in HEK-293 cell line (or mock transfected with empty plasmid). Then, 2 × 10⁶ cells were incubated with increasing Aβo concentrations for 2 h at 4 °C. The material was then solubilized and immunoprecipitated with antiFLAG antibody and probed by Western blotting with anti-Aβ, anti-NL-1, and anti-NL-2 antibodies. We observed that Aβo were bound specifically to HEK-293 which express NL-1 and not to NL-2 (Figure 7A), suggesting a preference of Aβ oligomers to interact with NL-1. The precise concentration of synaptic proteins in the postsynaptic membrane has still not been determined. Moreover, to have a precise determination of these concentration will not be easy because the amount of proteins found in the synaptic membrane is not constant and response to the normal synaptic activity process. However, Sheng et al. did an estimation of the concentration of important components of the postsynaptic density. For example, PSD-95 has been found in a concentration of 1.7 pmol/20 μg of PSD, whereas NR1 subunit from the. Figure 6. Incorporation of Aβ monomers to Aβ fibrils. (A) Experimental design for the incorporation of Aβ monomers to preformed fibrils. 50 μM Aβ1-42 was aggregated for 24 h at 37 °C in a 96-well plate. Then, the plate was blocked with 1% BSA at 4 °C and washed with PBS several times. Then, 10 μM Aβ1-42-biotinylated monomer (Aβ-Biot) was added in the absence or presence of 1, 10, 100, and 1,000 nM sNL-1 for 4 h, with slow stirring at room temperature. Then, the wells were washed with PBS/BSA and developed with neutravidin bound to a fluorophore. The three possible results are represented in the scheme. (B) Incorporation of Aβ to preformed amyloid fibrils. The presence of 1 nM sNL-1 significant increase the amount of Aβ incorporated to the preformed fibrils, whereas 1 μM sNL-1 reduces the incorporation of new Aβ monomers to the fibrils, suggesting an inhibition in the Aβ fibrils elongation. (C) 50 μM Aβ1-42 was aggregated in the absence (black circle) or presence of 1 μM sNL-1 (red circle). After 24 h incubation, 20 μM Aβ42 monomers were added to both conditions. The graph shows that the aggregation of Aβ with 1 μM sNL-1 initially seems to be inhibited, but after the addition of new Aβ monomers, amyloid aggregation increased immediately. *p ≤ 0.001.. NMDA glutamate receptor is 0.24 pmol/20 μg of PSD preparation; however, the concentration of NL-1 has not been determined.45 Finally, we studied whether NL-1 expressed in hippocampal neurons could be colocalizing with amyloid oligomers in neuronal culture. Using immunofluorescence studies, we found that NL-1 and Aβo were distributed along neurites in a puncta pattern (Figure 7B), and both proteins seem to be colocalizing. Therefore, our results are suggesting that in 8134. dx.doi.org/10.1021/bi201246t | Biochemistry 2011, 50, 8127−8137.
(9) Biochemistry. Article. Figure 7. Interaction between neuroligin and Aβo in cell culture. (A) HEK-293 cells were transfected with full length FLAG-NL-1 (upper panel) or FLAG-NL-2 (bottom panel) and incubated for 2 h at 4 °C with increasing Aβo concentration. The proteins were detergent-solubilized and immunoprecipitated with anti-FLAG. After SDS-PAGE and transfer to nitrocellulose, the membranes were probed with anti-Aβ, anti-NL-1, and antiNL-2. The result shows that Aβo immunoprecipites with NL-1 and no with NL-2. (B) Representative images of an immunofluorescence of hippocampal neurons (21 DIV) treated with 1 μM Aβo for 60 min and stained for NL-1 (green) and Aβo (red). Scale = 10 μm.. hippocampal neurons NL-1 and Aβo are colocalizing at the excitatory synapse.. ■. to NL-1 and NL-2 by SPR, and aggregation of Aβ with NL-1. This material is available free of charge via the Internet at http://pubs.acs.org.. CONCLUSIONS. ■. AUTHOR INFORMATION Corresponding Author *Tel: 56-2-6862720. Fax: 56-2-6862959. E-mail: ninestrosa@ bio.puc.cl. Funding This work was supported by grants from the Basal Center for Excellence in Science and Technology CARE (PFB12/2007) to N.C.I., Fondecyt No. 1095121 to O.M., and Predoctoral fellowship from Conicyt to M.C.D.. We present here the first evidence of an interaction between the synaptic protein NL-1 and Aβo. The current “amyloid hypothesis” proposes that the steady accumulation of soluble Aβo initiates a slow but deadly cascade that adversely affects synaptic function, which in turn leads to the cognitive failure, associated with AD.38,39 To understand the role of oligomeric Aβ species in AD pathology, it is critical to elucidate the mechanism by which oligomers are targeted to synaptic terminals. Besides, NL-1 is an important synaptic protein involved in the specificity of the synaptic contact validation17,40−43 with neurexin;44 its extracellular sequence is composed of a single domain that is homologous with AChE but lacks crucial residues in the active site.15 We demonstrated that Aβo interacts with the extracellular domain of NL-1, generating the exposition of Trp residues to the solvent. Indeed, the interaction NL-1-Aβo has effect on Aβ aggregation, where we showed that NL-1 stabilized the oligomeric assemblies of Aβ. This observation could have an important physiological significance. In the excitatory synapse when Aβ is released to the intersynaptic space, the peptide will bind NL-1 present in the postsynaptic membrane, and this macromolecule would be acting as a local aggregation of more Aβo that eventually would impact the postsynaptic region triggering the synaptic toxicity in AD.. ■. ACKNOWLEDGMENTS We thank Dr. Palmer Taylor and Dr. Davide Comoletti from the University of California, San Diego, CA, for his help during the initial stages of this work. This work was supported by grants from the Basal Center for Excellence in Science and Technology CARE (CONICYT, PFB12/2007) to NCI, Fondecyt No. 1095121 to O.M. and a Predoctoral fellowship from Conicyt to M.C.D.. ■. ABBREVIATIONS. ■. REFERENCES. AD, Alzheimer’s disease; Aβ, amyloid β-peptide; AChE, acetylcholinesterase; NL-1, neuroligin-1; NL-2, neuroligin-2; SPR, surface plasmon resonance; EM, electron microscopy.. ■. ASSOCIATED CONTENT S Supporting Information * Formulas used to calculate the affinity constant between NL-1 and Aβ as well the spectrum symmetry analysis, binding of Aβ. (1) Ballard, C., Gauthier, S., Corbett, A., Brayne, C., Aarsland, D., and Jones., E. (2011) Alzheimerś disease. Lancet 377, 1019−1030.. 8135. dx.doi.org/10.1021/bi201246t | Biochemistry 2011, 50, 8127−8137.
(10) Biochemistry. Article. ́ (22) Diaz-Espinoza, R., Garcés, A. P., Arbildua, J. J., Montecinos, F., Brunet, J. E., et al. (2007) Domain folding and flexibility of Escherichia coli FtsZ determined by tryptophan site-directed mutagenesis. Protein Sci. 16, 1543−1556. (23) Lakowitz, J. R. (2006) Principles of Fluorescence Spectroscopy, 3rd ed., Plenum Press, New York. (24) Dinamarca, M. C., Cerpa, W., Garrido, J., Hancke, J. L., and Inestrosa, N. C. (2006) Hyperforin prevents β-amyloid neurotoxicity and spatial memory impairments by disaggregation of Alzheimer’s amyloid-β-deposits. Mol. Psychiatry 11, 1032−1048. (25) De Ferrari, G. V., Canales, M. A., Shin, I., Weiner, L. M., Silman, I., and Inestrosa, N. C. (2001) A structural motif of acetylcholinesterase that promotes amyloid β-peptide fibril formation. Biochemistry 40, 10447− 10457. (26) Comoletti, D., Flynn, R. E., Boucard, A. A., Demeler, B., Schirf, V., Shi, J., et al. (2006) Gene selection, alternative splicing, and posttranslational processing regulate neuroligin selectivity for β-neurexins. Biochemistry 45, 12816−12827. (27) Dinamarca, M. C., Colombres, M., Cerpa, W., Bonansco, C., and Inestrosa, N. C. (2008) β- amyloid oligomers affect the structure and function of the postsynaptic region: role of the Wnt signaling pathway. Neurodegener. Dis. 5, 149−152. (28) Varoqueaux, F., Jamain, S., and Brose, N. (2004) Neuroligin 2 is exclusively localized to inhibitory synapses. Eur. J. Cell Biol. 83, 449− 456. (29) Decker, H., Jürgensen, S., Adrover, M. F., Brito-Moreira, J., Bomfim, T. R., Klein, W. L., et al. (2010) N-Methyl-d-aspartate receptors are required for synaptic targeting of Alzheimer’s toxic amyloid-β peptide oligomers. J. Neurochem. 115, 1520−1529. (30) Magdesian, M. H., Carvalho, M. M., Mendes, F. A., Saraiva, L. M., Juliano, M. A., et al. (2008) Amyloid-β binds to the extracellular cysteine-rich domain of Frizzled and inhibits Wnt/β-catenin signaling. J. Biol. Chem. 283, 9359−9368. (31) Laurén, J., Gimbel, D. A., Nygaard, H. B., Gilbert, J. W., and Strittmatter, S. M. (2009) Cellular prion protein mediates impairment of synaptic plasticity by amyloid-β oligomers. Nature. 457, 1128−1132. (32) Balducci, C., Beeg, M., Stravalaci, M., Bastone, A., Sclip, A., et al. (2010) Synthetic amyloid-β oligomers impair long-term memory independently of cellular prion protein. Proc. Natl. Acad. Sci. U. S. A. 107, 2295−2300. (33) Liu, D., Xu, Y., Feng, Y., Liu, H., Shen, X., Chen, K., et al. (2006) Inhibitor discovery targeting the intermediate structure of βamyloid peptide on the conformational transition pathway: implications in the aggregation mechanism of β-amyloid peptide. Biochemistry 45, 10963−10972. (34) El-Agnaf, O. M., Guthrie, D. J., Walsh, D. M., and Irvine, G. B. (1998) The influence of the central region containing residues 19−25 on the aggregation properties and secondary structure of Alzheimer’s β-amyloid peptide. Eur. J. Biochem. 256, 560−569. (35) Lansbury, P. T. Jr., Costa, P. R., Griffiths, J. M., Simon, E. J., Auger, M., et al. (1995) Structural model for the β-amyloid fibril based on interstrand alignment of an antiparallel-sheet comprising a Cterminal peptide. Nat. Struct. Biol. 2, 990−998. (36) LeVine, H. III (1993) Thioflavine T interaction with synthetic Alzheimer ś disease β-amyloid peptides: detection of amyloid aggregation in solution. Protein Sci. 2, 404−410. (37) Dinamarca, M. C., Sagal, J. P., Quintanilla, R. A., Godoy, J. A., Arrazola, M. S., and Inestrosa, N. C. (2010) Amyloid-β-Acetylcholinesterase complexes potentiate neurodegenerative changes induced by the Aβ peptide. Implications for the pathogenesis of Alzheimerś disease. Mol. Neurodegener. 5, 4. (38) Coleman, P. D., and Yao, P. J. (2003) Synaptic slaughter in Alzheimer’s disease. Neurobiol. Aging 24, 1023−1027. (39) Hardy, J. A., and Higgins, G. A. (1992) Alzheimer’s disease: the amyloid cascade hypothesis. Science 256, 184−185.. (2) Walsh, D. M., and Selkoe, D. J. (2004) Deciphering the molecular basis of memory failure in Alzheimer’s disease. Neuron 44, 181−193. (3) Haass, C., and Selkoe, D. J. (2007) Soluble protein oligomers in neurodegeneration: lessons from the Alzheimer’s amyloid β-peptide. Nat. Rev. Mol. Cell Biol. 8, 101−112. (4) Fezoui, Y., and Teplow, D. B. (2002) Kinetic studies of amyloid β-protein fibril assembly:Differential effects of alpha-helix stabilization. J. Biol. Chem. 277, 36948−36954. (5) Belli, M., Ramazzotti, M., and Chiti, F. (2011) Prediction of amyloid aggregation in vivo. EMBO Rep. 12, 657−663. (6) Terzi, E., Hölzemann, G., and Seelig, J. (1994) Reversible random coil-β-sheet transition of the Alzheimer β-amyloid fragment (25−35). Biochemistry 33, 1345−1350. (7) Morgan, C., Colombres, M., Nuñez, M. T., and Inestrosa, N. C. (2004) Structure and function of amyloid in Alzheimer’s disease. Prog. Neurobiol. 74, 323−349. (8) Roychaudhuri, R., Yang, M., Hoshi, M. M., and Teplow, D. B. (2009) Amyloid β-protein assembly and Alzheimer disease. J. Biol. Chem. 284, 4749−4753. (9) Terry, R. D., Masliah, E., Salmon, D. P., Butters, N., DeTeresa, R., et al. (1991) Physical basis of cognitive alterations in Alzheimer’s disease: synapse loss is the major correlate of cognitive impairment. Ann. Neurol. 30, 572−580. (10) Lacor, P. N., Buniel, M. C., Chang, L., Fernandez, S. J., Gong, Y., et al. (2004) Synaptic targeting by Alzheimer’s-related amyloid-β oligomers. J. Neurosci. 24, 10191−10200. (11) Wei, W., Nguyen, L. N., Kessels, H. W., Hagiwara, H., Sisodia, S., and Malinow, R. (2010) Amyloid β from axons and dendrites reduces local spine number and plasticity. Nature Neurosci. 13, 190− 196. (12) Snyder, E. M., Nong, Y., Almeida, C. G., Paul, S., Moran, T., et al. (2005) Regulation of NMDA receptor trafficking by amyloid-β. Nature Neurosci. 8, 1051−1058. (13) Roselli, F., Tirard, M., Lu, J., Hutzler, P., Lamberti, P., et al. (2005) Soluble β-amyloid1−40 induces NMDA-dependent degradation of postsynaptic density-95 at glutamatergic synapses. J. Neurosci. 25, 11061−11070. (14) Ichtchenko, K., Hata, Y., Nguyen, T., Ullrich, B., Missler, M., Moomaw, C., and Sudhof, T. C. (1995) Neuroligin 1: a splice sitespecific ligand for β-neurexins. Cell 81, 435−443. (15) Scholl, F. G., and Scheiffele, P. (2003) Making connections: cholinesterase-domain proteins in the CNS. Trends Neurosci. 26, 618− 624. (16) Scheiffele, P., Fan, J., Choih, J., Fetter, R., and Serafini, T. (2000) Neuroligin expressed in nonneuronal cells triggers presynaptic development in contacting axons. Cell 101, 657−669. (17) Dean, C., and Dresbach, T. (2006) Neuroligins and neurexins: linking cell adhesion, synapse formation and cognitive function. Trends Neurosci. 29, 21−29. (18) Bolliger, M. F., Frei, K., Winterhalter, K. H., and Gloor, S. M. (2001) Identification of a novel neuroligin in humans which binds to PSD-95 and has a widespread expression. Biochem. J. 356, 581−588. (19) Inestrosa, N. C., Alvarez, A., Pérez, C. A., Moreno, R. D., Vicente, M., et al. (1996) Acetylcholinesterase accelerates assembly of amyloid-β-peptides into Alzheimer’s fibrils: possible role of the peripheral site of the enzyme. Neuron 16, 881−891. (20) Inestrosa, N. C., Dinamarca, M. C., and Alvarez, A. (2008) Amyloid-cholinesterase interactions. Implications for Alzheimer’s disease. FEBS J. 275, 625−632. (21) Comoletti, D., Flynn, R., Jennings, L. L., Chubykin, A., Matsumura, T., et al. (2003) Characterization of the interaction of a recombinant soluble neuroligin-1 with neurexin-1β. J. Biol. Chem. 278, 50497−50505. 8136. dx.doi.org/10.1021/bi201246t | Biochemistry 2011, 50, 8127−8137.
(11) Biochemistry. Article. (40) Chih, B., Engelman, H., and Scheiffele, P. (2005) Control of excitatory and inhibitory synapse formation by neuroligins. Science 307, 1324−1328. (41) Ko, J., Zhang, C., Arac, D., Boucard, A. A., Brunger, A. T., and Südhof, T. C. (2009) Neuroligin-1 performs neurexin-dependent and neurexin-independent functions in synapse validation. EMBO J. 28, 3244−3255. (42) Blundell, J., Blaiss, C. A., Etherton, M. R., Espinosa, F., Tabuchi, K., Walz, C., et al. (2010) Neuroligin-1 deletion results in impaired spatial memory and increased repetitive behavior. J. Neurosci. 30, 2115−2129. (43) Graf, E. R., Zhang, X., Jin, S. X., Linhoff, M. W., and Craig, A. M. (2004) Neurexins induce differentiation of GABA and glutamate postsynaptic specializations via neuroligins. Cell 119, 1013−1026. (44) Song, J. Y., Ichtchenko, K., Südhof, T. C., and Brose, N. (1999) Neuroligin 1 is a postsynaptic cell-adhesion molecule of excitatory synapses. Proc. Natl. Acad. Sci. U. S. A. 96, 1100−1125. (45) Sheng, M., and Hoogenraad, C. C. (2007) The postsynaptic architecture of excitatory synapses: a more quantitative view. Annu. Rev. Biochem. 76, 823−847.. 8137. dx.doi.org/10.1021/bi201246t | Biochemistry 2011, 50, 8127−8137.
(12)
Figure


+3


Documento similar
In this post-hoc analysis of the ISAACC study, we identified specific inflammatory and cardiovascular disease protein biomarkers associated with severe OSA in patients with a
With the entangled stories of the different characters featured in this movie and with the metaphors appearing there I shall attempt to show that the narrative experience may offer
Protein tyrosine phosphatase 1B (PTP1B) is a negative regulator of insulin signaling and a therapeutic target for type 2 diabetes (T2DM). In this study, we have evaluated the role
Incidence of dementia and probable Alzheimer´s disease in a general population: The Framingham study.. Hendiré H., Ogunniyi A.,
Simultaneous expression of PI3K and any of the three Aβ peptides also produced an increase in the number of active zones, boutons and branches when compared to Aβ express- ing NMJs
We consider this is an intrinsic property of this complex, since Hsp90 interacts with many distinct proteins; depending on the nature of the substrate, it uses a binding site
Por otra parte, nuestros resultados confirman que tanto especies altamente agregadas como oligómeros de A 25-35 y A 1-40 interaccionan con ADN in vitro,
Through this process we find that there are four primary constructs that may be associated with a firm's intention to adopt the use of mobile advertising: (1) the ability to build
