Equilibrium partition of vegetable extracts between pretreated vegetable substrates and pure or oil modified supercritical CO2
177
0
0
Texto completo
(2)
(3) Dedicated to all those who drove me, accompanied and supported during this process, especially to my parents Efrén A. Urrego and Luz A. Camelo, my wife Julia A. Arango, and finally to my little angel, my daughter, Emma S. Urrego. ii.
(4) AKNOWLEDGEMENTS. My gratitude is first for my parents, Efrén and Luz, who have always been my greatest support, and for my wife, Julia, who shared the good and bad things of this road with me, with infinite love and understanding. I would like to thank my advisor Dr. José M. del Valle. Your firm grasp made me know my limits and extend them in many ways, and I grew because of it. I hope, that in some way, this experience brought you something that you find valuable. I would also like to thank Dr. Feral Temelli (University of Alberta, Canadá), Dr. María J. Cocero (Universidad de Valladolid, España), and Dr. Helena Sovová (Academy of Sciences of the Czech Republic, Czech Republic), who made decisive and invaluable suggestions to my work during their visits to our laboratory. To all the High Pressure Processes Research Group (Universidad de Valladolid, España) members, thanks for the time we shared, but most of all, thanks for the efforts to help me achieve the goals of my internship, in such an event that I arrived just after the fire in the building. I hope that everything went back to normal fast enough. A special thanks to my partners in science from the Laboratorio de Extracción de Materiales Biológicos (LEMaB): Karina Araus, Raúl Aravena, Lorena Mödinger, Yazmin Donaire, Fabián Reyes, Arturo Bejarano, Eduardo Richter, Sofía Andrighetti, Caroline Sielfeld, Soledad Murias, and Andrea Reveco. Last, but most important, I would like to thanks Gonzalo Nuñez, because of his friendship and help. Finally, I would like to thanks funding by: “Comisión de Investigación Científica y Tecnológica CONICYT”, specifically the program “Becas de doctorado en Chile para extranjeros sin permanencia definitiva”; “Fondo Nacional de Desarrollo Científico y Tecnologico FONDECYT”, specifically projects 108-0211, 108-0469, and 111-1008; “Fondo de Fomento al Desarrollo Científico y Tecnológico FONDEF”, specifically the project D09I1207. And finally, funding by the “Dirección de Postgrados de la Escuela de Ingeniería DIPEI” from the Pontificia Universidad Católica de Chile is greatly acknowledged. iii.
(5) CONTENTS DEDICATORY ..................................................................................................................... ii AKNOWLEDGEMENTS .................................................................................................... iii LIST OF FIGURES ............................................................................................................ viii LIST OF TABLES ............................................................................................................ xvii RESUMEN ............................................................................................................. xviii ABSTRACT................................................................................................................ xx LIST OF PAPERS .................................................................................................................. 1 1.. INTRODUCTION ........................................................................................................ 2 1.1. Hypothesis ............................................................................................................ 3 1.2. Objectives ............................................................................................................. 3. 2.. FREE SOLUTE CONTENT AND SOLUTE-MATRIX INTERACTIONS AFFECT. APPARENT. SOLUBILITY. AND. APPARENT. SOLUTE. CONTENT IN SUPERCRITICAL CO2 EXTRACTIONS. A HYPOTHESIS PAPER .......................................................................................................................... 5 2.1. Introduction .......................................................................................................... 5 2.2. Motivation ............................................................................................................ 7 2.3. Approach ............................................................................................................ 13 2.4. Results ................................................................................................................ 16 2.4.1. The initial solute content in the substrate affects its apparent solubility .................................................................................................. 17 2.4.2. Solute partition between the substrate and supercritical CO2 affects extraction yield ........................................................................................ 24 2.4.3. Discriminating solute partition and mass transfer effects is difficult from integral extraction curves ................................................................ 30 2.4.4. Best-fit parameters from a mathematical model are adequate only when the model fits reality....................................................................... 34 2.4.5. Inadequate mathematical models and best-fit parameters fail simulating process scale-up ..................................................................... 40 2.5. Discussion and practical implications of results ................................................ 42.
(6) 2.6. Concluding remarks ........................................................................................... 48 3.. EQUILIBRIUM. PARTITION. OF. RAPESEED. OIL. BETWEEN. SUPERCRITICAL CO2 AND PREPRESSED RAPESEED ..................................... 50 3.1. Introduction ........................................................................................................ 50 3.2. Materials and methods ....................................................................................... 53 3.2.1. Substrate................................................................................................... 53 3.2.2. Experimental device ................................................................................ 54 3.2.3. Experimental procedure ........................................................................... 55 3.2.4. Experimental plan .................................................................................... 58 3.3. Results ................................................................................................................ 58 3.4. Discussion .......................................................................................................... 71 4.. EQUILIBRIUM PARTITION OF RED PEPPER EXTRACT BETWEEN PURE OR VEGETABLE-OIL MODIFIED CO2 AND PELLETIZED AND MILLED RED PEPPER ............................................................................................. 75 4.1. Introduction ........................................................................................................ 75 4.2. Materials and methods ....................................................................................... 78 4.2.1. Materials .................................................................................................. 78 4.2.2. Experimental methodology ...................................................................... 78 4.2.3. Experimental plan .................................................................................... 79 4.2.4. Mathematical modelling .......................................................................... 79 4.3. Results and discussion ........................................................................................ 80 4.3.1. Effect of the pressure on the sorption equilibrium of red pepper oleoresin ................................................................................................... 82 4.3.2. Effect of the temperature on the sorption equilibrium of red pepper oleoresin at isodensity condition of SC CO2 ........................................... 82 4.3.3. Modelling the oleoresin isotherm/isobar curves ...................................... 83 4.3.4. Effect of the addition of vegetable oil on the sorption equilibrium of red pepper oleoresin ............................................................................ 86 4.3.5. Equilibrium partition of carotenoids ........................................................ 86.
(7) 4.3.6. Inclusion of the isotherm/isobar model into the BIC extraction model ....................................................................................................... 89 4.4. Conclusions ........................................................................................................ 93 5.. DYNAMIC MEASUREMENT OF THE EQUILIBRIUM PARTITION OF TOMATO. EXTRACT. BETWEEN. SUPERCRITICAL. CO2. AND. PRETREATED TOMATO ......................................................................................... 94 5.1. Introduction ........................................................................................................ 94 5.2. Chromatographic methodologies to measure isotherm/isobar curves ................ 96 5.3. Materials and methods ....................................................................................... 98 5.3.1. Tomato, tomato products, and analysis ................................................... 98 5.3.2. Experimental device ................................................................................ 99 5.3.3. Measurement of sorption isotherm/isobar curves using a static procedure ............................................................................................... 102 5.3.4. Measurement of sorption isotherm/isobar curves using a dynamic procedures .............................................................................................. 103 5.3.5. Mathematical model .............................................................................. 104 5.4. Results and discussion ...................................................................................... 106 5.5. Conclusions ...................................................................................................... 120 6.. CONCLUSIONS AND FUTURE PERSPECTIVES ............................................... 121. NOMENCLATURE ........................................................................................................... 124 REFERENCES ................................................................................................................... 129 A P P E N D I X E S .......................................................................................................... 141 APPENDIX A: DETAILS OF MATHEMATICAL MODELS APPLIED IN SECTION (2). ........................................................................................................... 142 A1. Initial condition ................................................................................................ 142 A2. Boundary condition .......................................................................................... 144 A3. Model 1 ............................................................................................................ 145 A4. Model 2 ............................................................................................................ 145 A5. Model 3 ............................................................................................................ 145 A6. Yield ................................................................................................................. 147.
(8) APPENDIX B: STANDARDIZATION OF THE METHODOLOGY ............................. 148 B1. Implications of the close and open sampling modes ........................................ 148 B2. Effect of weight ratio on the gravimetric determination of oil ........................ 151 B2. Uncertainty analysis ......................................................................................... 152.
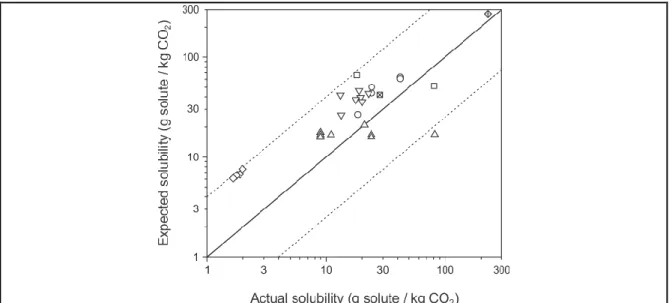
(9) LIST OF FIGURES Figure 2-1. Main zones of a typical integral extraction curve. Zone I solubility dominated where Cfo is the “apparent” solubility, Zone II transition between solubility and mass transfer dominions, Zone III mass transfer dominated where segmented lines Cso represents the “apparent” initial solute content. ..................................................................... 7 Figure 2-2. Equilibrium partition of oil between supercritical CO2 an pre-pressed oilseed when there is no interaction between the solutes and the solid matrix in (A) a case where CO2 cannot dissolve all oil so that there is excess oil deposited in pores and the CO2 phase is saturated with oil, and (B) a case where CO2 can dissolve all oil. ........... 18 Figure 2-3. (A) Effect of initial oil content in pre-pressed oilseed on integral extraction curves with supercritical CO2 at 353 K and 90 MPa. The initial solute content is expressed as a percentage of the amount required to saturate the CO2 during the static extraction period (60% indicates that the oilseed contains 60% of the oil required to saturate CO2). (B) Effect of dynamic extraction time on residual oil concentration profiles oil in pre-pressed oilseed along the extraction vessel for the 60% curve in Fig. (2-3A). Times are expressed as a fraction of the residence time of supercritical CO2 in the extraction vessel (0.6 tres corresponds to 60% of U/L). ...................................... 19 Figure 2-4. Modified integral extraction curve of cumulative essential oil yield versus specific solvent consumption in a volume-by-weight basis for the extraction of ginger using high-pressure (near- and super-critical) CO2 at ( ) 293 K and 15 MPa, ( ) 303 K and 15 MPa, ( ) 313 K and 15 MPa, ( ) 313 K and 20 MPa, and ( ) 313 K and 25 MPa. Adapted data from Martinez et al. (2003). ........................................... 21 Figure 2-5. Relationship between actual (Cfo) and expected (Cf*) apparent solubilities of essential oils from herbs and spices extracted using high-pressure (near- and supercritical) CO2, where values of Cf* were estimated using Eq. (2.11) by assuming there were no interactions between extracts and the solid matrices. Literature data corresponds to the extraction of ( ) nutmeg seed particles (0.300 ≤ dp ≤ 1.45 mm) at 296 K and 9 MPa (Spricigo et al., 2001), ( ) nutmeg seed particles (0.556 ≤ dp ≤ 2.12 mm) at 313-323 K and 10-20 MPa (Machmudah et al., 2006), ( ) 383-m viii.
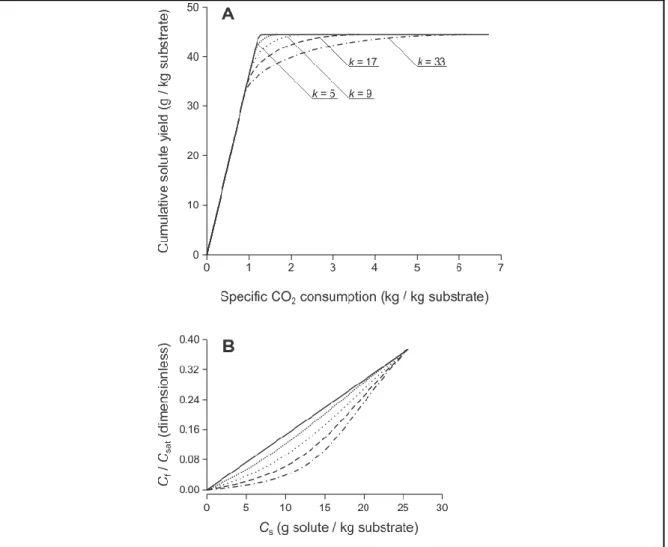
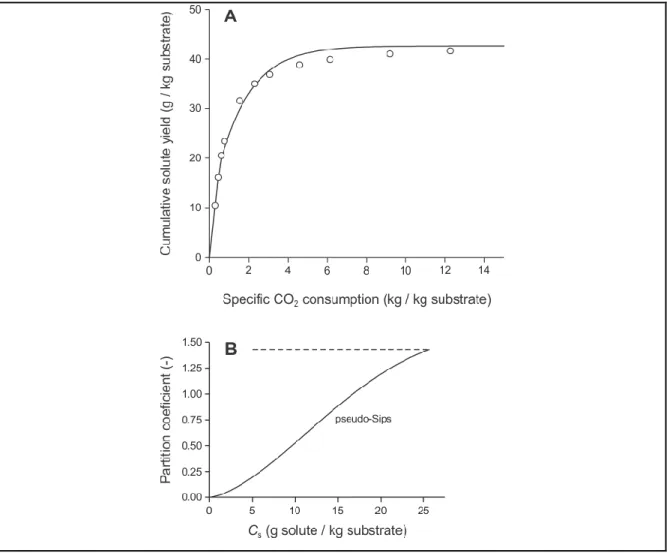
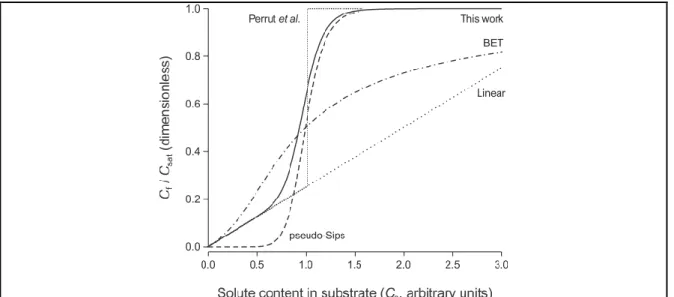
(10) caraway seed particles at 313 K and 9 or 10 MPa (Sovová et al., 1994), ( ) 720-m rosemary bract particles at 308 or 313 K and 10 or 12.5 MPa (Coelho et al., 1997), ( ) 375-m Lippia sidoides leaf particles at 282-298 K and ca. 7 MPa (Sousa et al., 2002), ( ) 520-m Croton zehnteri leaf particles at 288 K and 6.7 MPa (Sousa et al., 2005), and ( ) 860-m milled clove bud particles at 298 K and 10 MPa using extraction vessels of two sizes (Martínez et al., 2007)......................................................... 23 Figure 2-6. (A) Effect of sorption parameters on integral extraction curves of oil in prepressed oilseed using supercritical CO2 at 353 K and 90 MPa, when sorption follows pseudo-Sip’s model. (B) Corresponding sorption isotherm/isobar for the partition of oil between pre-treated oilseed and supercritical CO2 at 353 K and 90 MPa (insert provides a detailed view of the initial slopes of the sorption isotherms/isobars). ................ 25 Figure 2-7. (A) Effect of sorption parameters on integral extraction curves of oil in prepressed oilseed using supercritical CO2 at 353 K and 90 MPa, when sorption follows BET’s model. (B) Corresponding sorption isotherm/isobar for the partition of oil between pre-treated oilseed and supercritical CO2 at 353 K and 90 MPa. .......................... 29 Figure 2-8. (A) Effect of inner mass transfer on integral extraction curves of oil in prepressed oilseed using supercritical CO2 at 353 K and 90 MPa. The ratio between the internal and external resistance to mass transfer, which is characterized by Biot’s number was modified by changing particle diameter: 0.25 mm for Bi = 16; 0.40 mm for Bi = 24; 0.55 mm for Bi = 31; and, 0.70 mm for Bi = 37. (B) Effect of dynamic extraction time on residual concentration profiles of oil in pre-pressed oilseed along the extraction vessel for the Bi = 16 curve if Fig. (2-3A). Times are expressed as a fraction of the residence time (tres) of SC-CO2 in the extraction vessel. .............................. 31 Figure 2-9. Comparison between the curve for K = 17 in Fig. (2-6A) (equilibrium partition defined by BET’s sorption model and no resistance to mass transfer) and Bi = 16 in Fig. (2-8A) (equilibrium partition defined by a linear sorption model, Eq. (2.9b), and resistance to mass transfer): (A) Integral extraction curves. (B) Residual concentration profiles of oil in pre-pressed oilseed along the extraction vessel for the time note (symbol) in Fig. (2-9A). ....................................................................................... 33 ix.
(11) Figure 2-10. (A) Comparison between assumed (symbols) and best-fitted integral extraction of oil in pre-pressed oilseed using supercritical CO2 at 353 K and 90 MPa. Synthetic data and best-curves were obtained using Model 3 for pseudo-Sips’s sorption (continuous lines in B) and linear sorption (segmented line in B). (B) Comparison between assumed (continuous line) and best-fitted (segmented line) partition coefficient of oil between supercritical CO2 at 353 K and 90 MPa and prepressed oilseed...................................................................................................................... 35 Figure 2-11. (A) Comparison between assumed (symbols) and best-fitted integral extraction of oil in pre-pressed oilseed using supercritical CO2 at 353 K and 90 MPa. Synthetic data and best-curves were obtained using Model 3 for BET’s sorption (continuous lines in B) and linear sorption (segmented line in B). (B) Comparison between assumed (continuous line) and best-fitted (segmented line) partition coefficient of oil between supercritical CO2 at 353 K and 90 MPa and pre-pressed oilseed................................................................................................................................... 37 Figure 2-12. (A) Comparison between assumed (symbols) and best-fitted integral extraction of oil in pre-pressed oilseed using supercritical CO2 at 353 K and 90 MPa. Synthetic data (symbols) was obtained using Model 3 for sorption according to Eq. (2.21) (continuous lines in B). Best-fitted line was obtained using a simplified version of Sovová (2005) model for PCPR-type sorption (segmented line in B). (B) Comparison between assumed (continuous line) and best-fitted (segmented line) sorption isotherms/isobars for the partition of oil between pre-treated oilseed and supercritical CO2 at 353 K and 90 MPa. .............................................................................. 39 Figure 2-13. Effect of a change of scale on simulated integral extraction curves of supercritical extractions (1-m3 extractor using 2-mm particles versus 100-cm3 extraction vessel using 0.55-mm particles) using CO2 at 353 K and 90 MPa simulated using Model 3. Continuous lines represent simulation using assumed parameter values whereas segmented lines represent simulation using best-fitted parameters for (A) pseudo-Sip’s applied sorption (same conditions as in Fig.2-10) and (B) BET’s sorption (same conditions as in Fig 2-11). .................................................. 41 x.
(12) Figure 2-14. Sorption isotherms/isobars for canola seed oil at 313 K and ( ) 30 MPa or ( ) 35 MPa. Symbols are experimental data taken from (Bulley et al., 1984) and trend lines were obtained using Eq. (2.21) and Csat values estimated using the equation of del Valle et al. (2012). ....................................................................................... 44 Figure 2-15. Comparison of sorption isotherm/isobar models presented in this manuscript. ....... 44 Figure 3-1. Schematic diagram of the high-pressure equilibration unit. The loading subsystem includes a liquid CO2 cylinder, on-line filter (olF), ooling bath (CB), syringe pump (SP), and heating coil (HC). The equilibration sub-system consist of a gear pump (GP), equilibrium cell (EC), injection valve (IV), and UV/Vis detector held in thermostated air bath together with HC. The sampling subsystem consists of a micrometric valve (mv), a two-inlet sampling valve (TiSV), a sampling tube (ST) located in a dewar with a cooling mixture, and volumetric gas meter (GM). Valves a and b are on-off (quarter-turn-type) valves. ......................................................................... 55 Figure 3-2. Graphical representation of loading, equilibration, and sampling operations. (A) In the loading step the system is pressurized with the syringe pump (not included) operating at constant flow, valve a (cf. Fig. 3-1) is opened, and valves b and mv are closed. (B) In the equilibration step the gear pump recirculates CO2, valves a and mv are closed, valve b is opened, and valve IV is switched to the inject position to obtain a UV/Vis reading of the supercritical CO2 phase in the detector. (C) In the sampling step the syringe pump (not included) is operated at constant pressure, valves a and mv are opened, and valve b is closed. Opened valves are marked white whereas closed valves are marked black. ...................................................... 56 Figure 3-3. Effects of sampling in a closed loop mode in the pressure and apparent concentration of oil in CO2 for the three different equilibrium concentrations noted. Assumed initial conditions were 50 °C and 28 MPa............................................................ 60 Figure 3-4. Effects of sampling in a closed loop mode in the pressure and apparent concentration of oil in CO2 for the three different equilibrium concentrations noted. Dashed lines indicate perfect mixing, continuous lines indicate dispersed plug flow. xi.
(13) for “ground” pellets, and dotted lines indicated dispersed plug flow for “square” pellets. Assumed initial conditions were 50 °C and 28 MPa. .............................................. 61 Figure 3-5. Uncertainty analysis of the measurands (Cf, Cs) for “ground” pellets isotherm/isobar curve at 50 °C and 28 MPa. Parallel horizontal bars signal uncertainties in oil concentration in the SC CO2 phase, whereas parallel vertical bars signal uncertainties in oil concentration in the oilseed phase. The dotted line represents the isotherm/isobar estimated neglecting sorption effects in the oilseed, whereas the continuous line represents the trend line for the experimental data. ................ 63 Figure 3-6. Effect of the replication and substrate pre-treatment on isotherm/isobar curves at 50 ºC and 28 MPa, where (△ ,▽ ) represent duplicates using “square” pellets and (○) data obtained using “ground” pellets. Lines represent predictions using pseudoSips‟ model using complete models to study the effect of replication and substrate pretreatment. ......................................................................................................................... 66 Figure 3-7. Effect of pressure on isotherm/isobar curves measured at 40 °C. (◊) 22 MPa, (□) 25 MPa, and (○) 28 MPa. ............................................................................................... 66 Figure 3-8. Effect of temperature on isotherm/isobar curves measured at the same SC CO2 density (857.1 kg/m3). (◊) 40 °C-22 MPa, (□) 45 °C-25 MPa, and (○) 50 °C-28 MPa. ...... 68 Figure 3-9. Arrehnius-type plot of oil concentration in CO2 (Cf) versus reciprocal of absolute temperature (T-1) as a function of the residual oil content in the substrate (Cs). ...................................................................................................................................... 68 Figure 3-10. Dependence of the total heat of desorption from the substrate and solvation in CO2 (ΔH) of the oil as a function of the residual oil contecnt in the substrate (Cs). ............ 70 Figure 4-1. Integral extraction curves of oleoresin from red pepper at 40 (■) and 60 ºC (♦) 28 MPa. Experimental data provided by Uquiche et al. (in preparation)............................. 77 Figure 4-2. Exhaustive isotherm/isobar curve of red pepper oleoresin at 67ºC -28 MPa. ............ 81 Figure 4-3. Effect of the pressure on the equilibrium partition of red pepper oleoresin. Measurements at 60ºC and 22 (■), 25 (●), and 28 (♦) MPa. ................................................ 82. xii.
(14) Figure 4-4. Effect of the temperate on the equilibrium partition of red pepper oleoresin at isodensity condition of SC CO2. Measurements at SC CO2 density of 785 kg m-3, 54ºC-22MPa (▲), 60ºC-25 MPa (●), and 67ºC-28 mPa (◊). ............................................... 83 Figure 4-5. Effect of the addition of vegetable oil on the equilibrium partition of red pepper oleoresin at 60ºC-25 MPa. Isotherm/isobar curve without modified SC CO2 (●), with modified SC CO2 (+), and a simulated isotherm/isobar curve of vegetable oil (-) for the same operating conditions as reference. ......................................................................... 87 Figure 4-6. Equilibrium concentration of carotenoid for isotherms/isobars measured with pure (●) and modified (○) SC CO2 at 60 °C and 25 MPa. (A) carotenoids concentration in the extract, (B) carotenoid concentration in SC CO2. ............................... 88 Figure 4-7. Simulated integral extraction curves of oleoresin from red pepper at 40 (■) and 60 ºC (♦) - 28 MPa. .............................................................................................................. 92 Figure 5-1. Experimental device constituted of (1) CO2 cylinder, (2) cooling bath, (3) syringe pump, (4) positive-displacement (HPLC-type) pump, (5, 6) 6-m heating coils, (7) recirculation (gear-type), (8) 40-cm3 equilibrium cell, (9, 10) 12-cm3 sorption columns, (11) automatized injection valve, (12) four-port, two-way manual valve, (13) two-port, two-way manual valve, (14) UV/Vis detector equipped with high-pressure cell, (15) back-pressure regulator, (16) two-inlet sampling valve, (17) micrometric valve, (18) 50-cm3 sampling tube with dewar flask, and (19) drum-type volumetric gas meter. ......................................................................................................... 100 Figure 5-2. Configuration of switching valves (11, 12, and 13 in Fig. 5-1), for different tasks when applying dynamic procedures to study sorption isotherm/isobars. Column 2 (10 in Fig. 5-1) was packed with glass beads when calibrating the UV/Vis detector, which applied two configurations: (A) to equilibrate the dynamic system to operation conditions; and, (B) to inject pulses of supercritical CO2 saturated with tomato extract. Column 1 (9 in Fig. 5-1) was packed with glass beads and column 2 with fully extracted tomato when studying breakthrough curves of solutions of tomato extract in supercritical CO2, which applied three configurations: (C) to equilibrate the dynamic system to operation conditions; (D) to inject and homogenize pulses of xiii.
(15) supercritical CO2 saturated with tomato extract; and, (E) to apply a negative perturbation (pulse of pure supercritical CO2). Valve configurations in (A) and (E) are identical ........................................................................................................................ 101 Figure 5-3. Equilibrium partition of tomato extract between supercritical CO2 and dried, pelletized, milled, and size-classified tomato measured using the static procedure at 40 °C and 29 MPa. Open circles represent experimental data points, and the line model predictions using best-fitted parameters of Freundlich’s equation, Eq. (5.4). ........ 106 Figure 5-4. Carotenoid concentrations in (A) tomato extract, and (B) supercritical CO2, of the extracts sampled while measuring the sorption isotherm/isobar curve using the static procedure (Fig. 5-3). ................................................................................................. 107 Figure 5-5. (A) Response signal for different switching times of tomato extract diluted in supercritical CO2 in a column packed with glass beads. (B) Pulses (1.5 s) of supercritical CO2 saturated with tomato extract (50-L portions) injected into the packed column for different switching times (4, 9, and 21-s). (C) Actual traces (full lines) and moving averages (segmented lines) for times equal to the switching times in (B) for the boxes noted in (A). ....................................................................................... 109 Figure 5-6. Correlation between average absorbance at 486 nm (wavelength of maximal absorbance of tomato extract in CO2) and average carotenoid concentration in supercritical CO2. ............................................................................................................... 111 Figure 5-7. (A) Dimensionless concentration responses to injection of different concentrations of tomato in supercritical CO2 to a column packed with glass beads. (B) Curves from (A) following adjustment of time so as to make coincide the dimensionless concentrations for the half-height (0.5) value. ........................................... 112 Figure 5-8. Summary of results for the frontal analysis, perturbation analysis, and desorption analysis for the partition of carotenes in tomato extract between supercritical CO2 and fully extracted tomato at 40 ºC and 29 MPa. (A) Experimental response for the adsorption breakthrough curves as a function of the carotene concentrations in supercritical CO2 (0.9‒4.6 mg kg-1 carotene/CO2), where arrows signal times when negative perturbation were induced. (B) Experimental response for xiv.
(16) the desorption breakthrough curves using pure supercritical CO2 following equilibration of fully extracted tomato with CO2 containing these same carotene concentrations..................................................................................................................... 113 Figure 5-9. Details of the two perturbation peaks for the breakthrough curve for 4.1 mg kg1. carotene/CO2 in Figure 5-2 (close symbols) lined to the initiation of the. perturbation, together with best-fits to the normal distribution function (lines); each end of arrow marks the onset of the negative peak, corresponding to the best-fit average (time for the minimal) minus twice the standard deviations. ............................... 114 Figure 5-10. Difference in the breakthrough curves between a column packed with glass beads (Fig. 5-5A) and a similar column packed with fully-extracted tomato (Fig. 58A), represented the carotenoids adsorbed by the solid substrate at 40 ºC and 29 MPa as a function of the carotenoid concentration in the supercritical CO2 fed to the columns. The area under each curve represents the total amount of tomato carotenoids adsorbed by the fully-extracted tomato. ......................................................... 115 Figure 5-11. Best-fitting of the transport-dispersive model to breakthrough curves for carotene partition between supercritical CO2 and fully extracted tomato at 40 ºC and 29 MPa. (A) Application of the inversion method to the desorption curve following equilibration of a column packed with fully-extracted tomato with a supercritical CO2 solution containing 4.6 mg kg-1 carotene/CO2; open circles represent experimental data points, and the line represents model predictions using best-fitted parameters of Freunlich’s equation, Eq. (5.4). (B) Slope of the sorption isotherm/isobar versus carotene concentration in supercritical CO2; open circles represent experimental data points from perturbation analysis (Fig. 5-9); whereas the line represented model predictions using Freundlich’s equation with best-fit parameters from (A). .......................................................................................................... 118 Figure 5-12. Sorption isotherm/isobars for tomato carotene partition between supercritical CO2 and dried, pelletized, milled, and size-classified tomato. (A) Tomato desorption using the static method; closed circles outside highlighted area represent experimental data points. (B) Zoom of highlighted area in (A) showing results xv.
(17) obtained applying dynamic methods to fully-extracted tomato. Symbols represent experimental data points using frontal analysis for the sorption (closed circles) and desorption (open symbols) steps. Line represent predicts using best-fitted parameters obtained using inverse analysis (Fig. 5-11). ....................................................................... 119 Figure A-1. Identification of elements defining mass transfer in packed bed extraction vessel in which porous spherical particles are extracted by a supercritical CO2 upflowing stream. ................................................................................................................... 143 Figure A-2. Schematic representation of the algorithm used to solve differential mass balance equations for the supercritical CO2 extraction of solid substrate particles in a packed bed extraction vessel, including actualization of concentration values in the solid and fluid phase as a function of axial position in the vessel and time....................... 146 Figure B-1. Uncertainty of oil weight measurements as a function of the ratio between the weight of the sample holder and the oil. ............................................................................ 152. xvi.
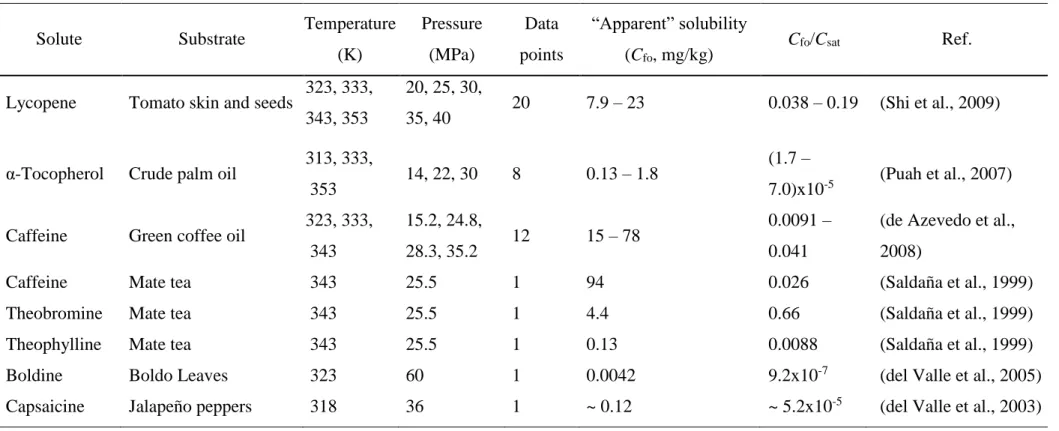
(18) LIST OF TABLES Table 2-1. Comparison of apparent (Cfo) and thermodynamic (Csat) solubilites in supercritical CO2 of different compounds in vegetable substrates. (Continued) ................. 10 Table 2-2. Comparison of thermodynamic solubilities of orange essential oil components (limonene, linalool) in supercritical CO2 in binary, ternary, and complex systems, and apparent solubility in orange peel.................................................................................. 12 Table 2-3. Comparison between adopted (non-linear sorption isotherm/isobar) and best-fit values (assuming linear partition of oil between SC CO2 and pre-pressed oilseed) of model parameters. ................................................................................................................ 36 Table 2-4. Isotherm/isobar sorption models presented in this manuscript. ................................... 46 Table 4-1. Experimental conditions, physical properties of SC CO2, and model parameters. ...... 91 Table B-1. Definition and values of parameters applied while modelling the sampling step with an open loop mode with a kinetic extraction model. Operation conditions of 50 °C and 28 MPa were assumed. ........................................................................................... 151 Table B-2. Variance of selected variables affecting calculations using Eqs. (B.7) and (B.8). .... 155. xvii.
(19) PONTIFICIA UNIVERSIDAD CATOLICA DE CHILE ESCUELA DE INGENIERIA. EQUILIBRIO DE PARTICIÓN DE EXTRACTOS VEGETALES ENTRE SUSTRATOS VEGETALES PRETRATADOS Y CO2 SUPERCRÍTICO PURO O MODIFICADO CON ACEITE Tesis enviada a la Dirección de Investigación y Postgrado en cumplimiento parcial de los requisitos para el grado de Doctor en Ciencias de la Ingeniería.. FREDDY ANEIDHER URREGO CAMELO RESUMEN En la modelación de la extracción de sustratos vegetales con CO2 supercrítico (CO2 SC), es común considerar a las variables del equilibrio de partición (función que relaciona la concentración máxima que podría alcanzar un soluto en la fase fluida, Cf, con base en la concentración residual del soluto en la fase sólida, Cs, Cf = f (Cs)) como parámetros de ajuste, algunas veces desconociendo si los resultados obtenidos reflejan la realidad física. El objetivo de esta tesis fue estudiar (experimentalmente), el equilibrio de partición de extractos vegetales entre CO2 SC y sustratos vegetales, modelar los resultados, y evaluar su inclusión en modelos de extracción. Para esto, se desarrolló, estandarizó, y validó una metodología que intercala etapas de equilibramiento (y muestreo), con etapas de extracción (para agotar el sustrato), midiendo el equilibrio de partición de aceite de raps entre CO2 SC y raps preprensado, a 40-60ºC y 22-28 MPa. Luego, se aplicó en la medición del equilibrio de partición de oleorresina de pimentón (y carotenoides), entre CO2 SC puro o modificado xviii.
(20) con aceite vegetal, y pimentón peletizado-molido-tamizado, a 54-67ºC y 22-28 MPa. Por último, se diseñó y evaluó una metodología basada en principios cromatográficos, para medir el equilibrio de partición de oleorresina de tomate (y carotenoides) disuelta en CO2 SC, en tomate peletizado-molido-tamizado que fue totalmente extraído. En las isotermas/isobaras de aceite de raps se observó un valor máximo de concentración en CO2 SC que correspondió al valor de saturación, mientras que en las isotermas/isobaras de oleorresinas, la interacción soluto-sustrato impidió la saturación. En todos los casos, sin embargo, se observó un efecto positivo de la presión y la temperatura sobre la partición de los solutos hacia la fase de CO2. Se propuso y aplicó una nueva ecuación matemática que modela los resultados obtenidos, y se observó un buen ajuste al aplicarla en modelos de extracción. Adicionalmente, se observó que la partición de carotenoides hacia la fase CO2 SC se ve favorecida por la presencia ya sea de compuestos lipídicos propios de las oleorresinas, tanto como de un aceite vegetal añadido. Miembros de la Comisión de Tesis Doctoral Dr. José M. del Valle Dr. César Saez Dr. Juan C. de la Fuente Dr. Paz Roberts Dr. María J. Cocero Dr. Cristian Vial Santiago, Enero, 2015. xix.
(21) PONTIFICIA UNIVERSIDAD CATOLICA DE CHILE ESCUELA DE INGENIERIA. EQUILIBRIUM PARTITION OF VETABLE EXTRACTS BETWEEN PRETREATED VEGETABLE SUBSTRATES AND PURE OR OIL-MODIFIED SUPERCRITICAL CO2 Thesis submitted to the Office of Research and Graduate Studies in partial fulfillment of the requirements for the Degree of Doctor in Engineering Sciences by. FREDDY A. URREGO ABSTRACT It the modelling of the extraction of vegetable substrates with supercritical CO2 (SC CO2), it is common to use the variables of the equilibrium partition (a function relating the maximal concentration of a solute in the fluid phase, Cf, with the residual concentration of the solute in the solid substrate, Cs, Cf = f (Cs)) as best-fitting parameters, sometimes ignoring if results are a real picture of the physical reality. The objective of this thesis was to experimentally measure the equilibrium partition of vegetable extracts between SC CO2 and vegetable substrates, to model the results, and to evaluate the effect of introducing these results in the modelling of supercritical extraction processes. An experimental methodology that intersperses equilibrium (and sampling), and extraction steps (to accelerate the depletion of the substrate) was developed, standardized, and validated, by measuring the partition of rapeseed oil between SC CO2 and prepressed rapeseed at 4060ºC, and 22-28 MPa. The methodology was then applied to measure the partition of red pepper oleoresin (and carotenoids), between pure or vegetable-oil-modified SC CO2, and xx.
(22) peletized-milled-sieved red pepper, at 54-67 ºC and 22-28 MPa. Finally, a methodology based on chromatographic principles was designed and evaluated to measure the partition of tomato oleoresin (and carotenoids) dissolved in SC CO2 in peletized-milled-sieved tomato that was extracted to exhaustion. The rapeseed oil isotherm/isobar curves show a horizontal asymptote related to the saturation concentration of oil in SC CO2 at the operation conditions, whereas in the oleoresin isotherm/isobar curves the solute-substrate interactions impeded the saturation. However, and in all cases, the increase of pressure and temperature had a positive effect on the partition of the solutes to the SC CO2. A new equation was proposed to model the results, showing a good fit after applying it to supercritical extraction models. Additionally, it was observed that the partition of carotenoids to the SC CO2 phase was enhanced by the presence of either the lipid components of the substrate or added vegetable oil. Members of the Doctoral Thesis Committee: Dr. José M. del Valle Dr. César Saez Dr. Juan C. de la Fuente Dr. Paz Roberts Dr. María J. Cocero Dr. Cristian Vial Santiago, January, 2015. xxi.
(23) 1. LIST OF PAPERS This thesis is based on the next scientific articles: 1. del Valle, J. M., & Urrego, F. A. (2012). Free solute content and solute-matrix interactions affect apparent solubility and apparent solute content in supercritical CO2 extractions. A hypothesis paper. The Journal of Supercritical Fluids (66), 157-175. 2. Urrego, F. A., Nuñez, G. A., Donaire, Y. D., & del Valle, J. M. Equilibrium partition of rapeseed oil between supercritical CO2 and prepressed rapeseed. The Journal of Supercritical Fluids. The Journal of Supercritical Fluids (102), 80-91. 3. Urrego, F. A., del Valle, J. M. & de la Fuente, J. C. Equilibrium partition of rapeseed oil between supercritical CO2 and prepressed rapeseed. (in progress). 4. Urrego, F. A., del Valle, J. M., Cocero, M. J., & de la Fuente, J. C. Dynamic measurement of the equilibrium partition of tomato extract between supercritical CO2 and pretreated tomato. The Journal of Chromatography A. (in progress)..
(24) 2. 1.. INTRODUCTION In extraction processes is always expected to find the conditions that improve the. yield and reduce the processing time. In the case of the extraction of vegetable substrates with supercritical CO2 (SC CO2) this is influenced by the solubility of the solute (or mixture of solutes) in SC CO2, and the interactions between the solute and the solid matrix (del Valle & de la Fuente, 2006; del Valle, Germain, Uquiche, Zetzl, & Brunner, 2006). On one hand, the solubility in SC CO2 is a property that has been widely studied, and in literature is possible to find data compilations both for pure solutes, i.e., the solubility of carotenoids in SC CO2 (Shi, Mittal, Kim, & Xue, 2007), as well as for complex systems, i.e., an equation to predict the solubility of vegetable oils based on experimental data compilation (del Valle, de la Fuente, & Uquiche, 2012). The addition of substances (cosolvents) that enhance the solubility of a solute in SC CO2 has also been studied, i.e., the application of vegetable oils to enhance the solubility of carotenoids (Q. X. Ma, Xu, Gao, Wang, & Zhao, 2008; Sun & Temelli, 2006; Vasapollo, Longo, Rescio, & Ciurlia, 2004). On the other hand, the experimental research on the solute-matrix interactions, in the SC CO2 extraction of vegetable systems, had less attention, and it was mainly used as a best-fit parameter in the modelling of supercritical fluid extraction (SCFE) processes. In the SCFE of vegetable substrates, the solute-matrix interactions are quantified by measuring the equilibrium partition, which is a correlation (named sorption isotherm/isobar) between the concentration of a solute in the SC CO2 (fluid, Cf) phase, and the concentration of the solute in the substrate (solid, Cs) phase, (Cf = f (Cs)), when phases are in contact enough time allowing the solute to migrate to the SC CO2 until the two phases are in equilibrium. Therefore, this equilibrium represent a limitation to the mass transfer that should be included and properly measured in the modelling of the SCFE process. This thesis consist of four articles that study the equilibrium partition of vegetable extracts between pretreated substrates and pure or oil-modified SC CO2, so as to include it in the modeling of SCFE processes. Briefly, the first article (section 2) presents an introduction that highlights the importance, and presents a justification to experimentally.
(25) 3. measure the equilibrium partition; the second article (section 3) presents the development, standardization, and validation of an experimental methodology (based on static methods) to measure sorption isotherm/isobar curves, applied to the partition of rapeseed oil between prepressed rapeseed and SC CO2; the third article (section 4) presents the application of the aforementioned methodology to the partition of red pepper oleoresin (and carotenoids) between peletized-milled-sieved red pepper and pure or oil-modified SC CO2; finally, the forth article (section 5) presents the application of a different methodology, based on chromatographic (dynamic) principles, to measure the partition of tomato oleoresin (and carotenoids) between peletized-milled-sieved and completely extracted tomato, and SC CO2 loaded with tomato oleoresin. 1.1.. Hypothesis In the extraction of a vegetable substrate with pure or oil-modified SC CO2, a. vegetable and solid matrix interacts with their solutes through sorption phenomena, and its measurement, modelling, and inclusion in extraction models, improves the simulation of experimental extraction data. 1.2.. Objectives The main objective of this thesis is to study the equilibrium partition of vegetable. extracts between pre-treated substrates and pure or modified SC CO2, and its application on SCFE models. The specific objectives of this thesis are: 1. to study the state of the art of the research on equilibrium partition of vegetable extracts between pre-treated substrates and pure or oil-modified SC CO2, by identifying its relevance. 2. to develop a (static) methodology to measure the equilibrium partition, applied to a rapeseed oil – prepressed rapeseed – SC CO2 system. 3. to measure and model the equilibrium partition of the red pepper (carotenoids) – peletized-milled-sieved red pepper – pure of oil-modified SC CO2 system, and to apply it in the simulation of experimental extraction data..
(26) 4. 4. to develop a (dynamic) methodology to measure and model the equilibrium partition of the tomato oleoresin (carotenoids) – peletized-milled-sieved (and completely extracted) tomato – SC CO2 system, and to compare the differences between the methodologies..
(27) 5. 2.. FREE. SOLUTE. INTERACTIONS. CONTENT AFFECT. AND. APPARENT. SOLUTE-MATRIX SOLUBILITY. AND. APPARENT SOLUTE CONTENT IN SUPERCRITICAL CO2 EXTRACTIONS. A HYPOTHESIS PAPER Abstract This manuscript stresses the need of experimental measurements and mathematical models of sorption isotherms/isobars to properly account for mass transfer in the SuperCritical (SC) Fluid Extraction (SCFE) processes. A reliable sorption isotherm/isobar model is a requirement, on one hand, for the determination of relevant inner mass transfer coefficients in SC CO2 extractions of vegetable substrates and other biological materials at the laboratory scale, and on the other hand, for a simulation tool successfully applicable to describe industrial SCFE process, which should be based both on a reliable mathematical descriptions of SC CO2 extraction processes. Having a reliable simulation model and model parameters would allow limiting expensive experimental pilot-scale work to validation purposes. Based on simulations of oil extraction from pre-pressed oilseeds using SC CO2 at 353 K and 90 MPa, this manuscript shows that the initial oil content in the pretreated seed affects the apparent solubility of the oil, that the partition of the oil between the seed and CO2 affects oil yield, that it is difficult to discriminate oil partition from inner mass transfer effects, that the best-fit parameters from a mathematical model are adequate only when the model accounts for the true physical picture of the extraction process, and that failure of the mathematical model to account the true physical picture of the extraction process impedes reliable simulations, scale-up, and economical evaluation of industrial SCFE process. Being sorption phenomena of such paramount importance to build a reliable mathematical model for simulation of SCFE processes, this manuscript proposes a mathematical model that fits experimental sorption isotherm/isobars for oil from seeds. 2.1.. Introduction SuperCritical (SC) Fluids (SCFs) are conveniently applied in environment-friendly. extraction processes because of their liquid-like solvent properties and gas-like transport.
(28) 6. properties, that allow efficient and fast extraction processes, and complete elimination of solvent traces (SCFs are gases under normal conditions) from extracts and treated substrates. Among potential candidates, inexpensive carbon dioxide (CO2), offers safe and selective SCF Extraction (SCFE) processes at near-environmental temperatures, which justifies commercial applications of SC CO2 extraction over the last three decades, particularly for high-value compounds in vegetable substrates (Brunner, 1994). Modelling and simulation are important for process design purposes, particularly of SCFE processes. Commercial SCFE plants for vegetable substrates can be designed estimating relevant equilibrium and rate parameters from integral extraction curves obtained in the laboratory (Núñez, Gelmi, & del Valle, 2011). An integral extraction curve is a plot of cumulative yield (e.g., grams of extract per kilogram of substrate) versus specific solvent consumption (e.g., kilograms of CO2 per kilogram of substrate) that, according to Brunner (Brunner, 1994), “is of relative simple form… (so that) it is not possible to calculate many parameters with significance from such a curve” (p. 181). Typical integral extraction curves have three zones (Sovová, 1994) (Fig. 2-1). In Zone I the curve has a constant slope having as units, e.g. grams of solute per kilogram of CO2, which represents a so-called “apparent” solubility of the extract (a multicomponent mixture of solutes in the substrate that can be extracted simultaneously) in SC CO2 (Cfo). When there is free solute on the surface of the substrate particles, this migrates to the interparticle SC CO2 phase in an amount that is restricted only by the solubility of the solute in SC CO2 under process conditions. The slope of the integral extraction curve decreases continuously in Zone II because there is no enough free solute on the surface of the particle, there are constraints to mass transfer within the substrate and a stationary film of CO2 next to the particle, and/or there are equilibrium constraints to the liberation of solute from the substrate to the intra-particle SC CO2 phase. Finally, in Zone III the integral extraction curve approaches a horizontal asymptote that represents the total amount of solute in the substrate that SC CO2 can remove under process conditions. Integral extraction curves can be used for scaling-up purposes and determining the cost of the SCFE process. Indeed, Rosa and Meireles (2005) claim that “the minimum estimated cost (can be) obtained in extraction times close to the end of the constant extrac-.
(29) 7. Figure 2-1. Main zones of a typical integral extraction curve. Zone I solubility dominated where Cfo is the “apparent” solubility, Zone II transition between solubility and mass transfer dominions, Zone III mass transfer dominated where segmented lines Cso represents the “apparent” initial solute content. tion rate region and thus, in order to have low (cost of manufacturing) the constant extraction rate region should have short time and high yields” (p. 238). This is not entirely true because, as authors’ will show in this manuscript, integral extraction curves may be scale-specific under selected conditions. The objective of this manuscript is to show the effect of the residual solute content in a vegetable substrate on the apparent solubility and yield of a SC CO 2 extraction process, as well as the implications of solute partition between the substrate and SC CO2 on kinetics and scale-up of SCFE processes. This is done using mathematical simulations and re-analysing data in literature. 2.2.. Motivation According to Brennecke and Eckert (1989) “any really widespread applications of. SCFE in the future are highly dependent on the ability of engineers to model and predict phase equilibria in the complex systems represented” (p. 1409). This is partially true when applying SCFE to vegetable substrates and other biological substrates because under.
(30) 8. certain conditions the optimal extraction process does not depend on “thermodynamic” solubility as exemplified next. The apparent solubility is a fraction of the thermodynamic solubility in the SCFE of many solutes contained in vegetable substrates. Data compilation in Table (2-1) explores the relationship between apparent (Cfo) and thermodynamic (Csat) solubilities by reporting values of the ratio Cfo / Csat for several solutes in vegetable substrates. By analogy with the definition of Cfo in Fig. (2-1), the apparent solubility of a specific solute is the product of Cfo for the whole extract, times the concentration of the solute in the extract. Apparent solubilities were taken from graphics (de Azevedo et al., 2008; Gomez-Prieto, Caja, & Santa-Maria, 2002; Gopalán, Goto, Kodama, & Hirose, 2000; Topal, Sasaki, Goto, & Hayakawa, 2006), tables (Puah, 2005; Puah, Choo, Ma, & Chuah, 2007; Saldaña, Sun, Guigard, & Temelli, 2006; Saldaña, Temelli, Guigard, Tomberli, & Gray, 2010; Shi et al., 2009; Silva, Gamarra, Oliveira, & Cabral, 2008), or the text (del Valle, Rogalinski, Zetzl, & Brunner, 2005; Saldaña, Mohamed, Baer, & Mazzafera, 1999), or estimated from an integral extraction curve (del Valle, Jimenez, & de la Fuente, 2003). Required values of Csat at corresponding process conditions (temperature and pressure) were taken directly from tables with experimental data (Silva et al., 2008) or estimated with the equation of Mendez-Santiago and Teja (1999) (MS-T) using best-fitting parameters for experimental solubility as a function of CO2 density, and the absolute temperature and pressure of the system. Best-fitting parameters were taken from Araus, Canales, de la Fuente, and del Valle (2011) for -carotene, and from de la Fuente, Oyarzun, Quezada, and del Valle (2006) for lycopene, capsaicin (de la Fuente, Valderrama, Bottini, & del Valle, 2005), and boldine (de la Fuente, Quezada, & del Valle, 2005). On the other hand, authors of this manuscript fitted MS-T’s equation to experimental data for caffeine (Saldaña et al., 1999), theobromine (Saldaña et al., 1999), thyophilline (Saldaña et al., 1999), turmerone (Kao, Chen, & Chang, 2007), and -tocopherol (Johannsen & Brunner, 1997). Values of Cfo are below corresponding values of Csat in most cases (Table 2-1). Single exceptions are bixin in annatto seeds (Silva et al., 2008), and an experimental point for -carotene in carrot (323K and 12 MPa) in the study of Saldaña et al. (2006) that is not included in Table (2-1) (Cfo / Csat = 1.6). The decrease in apparent as compared to thermodynamic solubility ranges.
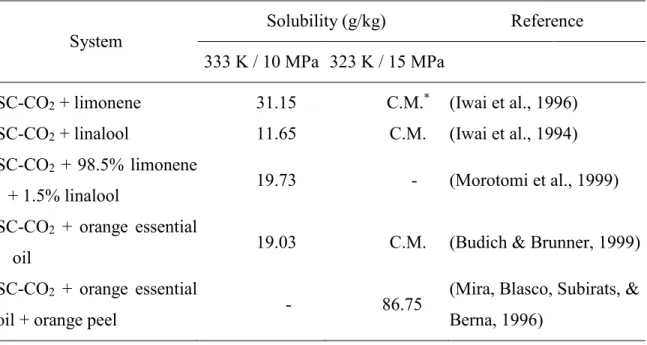
(31) 9. from 1.1 times for the extraction of -carotene in carrot using SC CO2 at 323 K and 15 MPa (Saldaña et al., 2006) to 1.1 million times for the extraction of boldine in boldo leaves using SC CO2 at 323 K and 60 MPa (del Valle et al., 2005). Typical extracts are complex mixtures of several interacting solutes, and solute-solute interactions affect the behaviour of the solubility of a constituent in the mixture as compared with the solubility of the pure counterpart (Brennecke & Eckert, 1989). For example, Silva et al. (2008) explained the increase in the solubility in SC CO2 of bixin in annatto seed extract as compared with the solubility of 93% pure bixin in SC CO2 as due to the co-solvency effect of the oil in the seeds (Araus et al., 2011). Table (2-1) shows that anti-solvency effects are more common than co-solvency effects in SC CO2 extraction of vegetable substrates. The difference between apparent and thermodynamic solubilities can be explained by the interactions between solutes in complex extract mixtures as well as their interaction with the substrate. An attempt to isolating the effects of solute-solute and solute-matrix interactions is possible by comparing thermodynamic solubilities in model binary systems, model ternary systems, and extracts in phase equilibrium experiments, and apparent solubilities in SCFE experiments. Differences in solubility for increasingly complex systems can be illustrated for essential oils from orange peel (Table 2-2). Selected temperature and pressure conditions are typical of equilibrium (333 K, 10 MPa) and extraction (323 K, 15 MPa) experiments, and missing entries in Table (2-2) show the need of additional data for this type of analysis. The critical pressure of limonene and linalool are above 10 MPa but below 15 MPa at 323 and 333 K (Iwai, Hosotani, Morotomi, Koga, & Arai, 1994; Iwai, Morotomi, Sakamoto, Koga, & Arai, 1996). Data for binary CO2 + limonene (Iwai et al., 1996) and CO2 + linalool (Iwai et al., 1994) systems, and ternary CO2 + limonene + linalool system (Morotomi, Iwai, Yamaguchi, & Arai, 1999) was estimated from experimental measurements done by the Iwai-Morotomi-Arai team. Thus data trends should not be affected by differences in precision and accuracy between experimental measurements. Based on binary solubilities in SC CO2, the ternary solubility is affected by limonene-linalool interactions in that the solubility of a mixture of 98.5% (w/w) limonene and 1.5% (w/w) linalool should have been closer to that of limonene (weighed average of 31.06 g/kg). The essential oil of oranges is a mixture of pre-.
(32) 10. Table 2-1. Comparison of apparent (Cfo) and thermodynamic (Csat) solubilites in supercritical CO2 of different compounds in vegetable substrates. (Continued). Solute. Substrate. Turmerone. Turmeric. Bixin. Annatto seeds. β-Carotene. Tomato skin. β-Carotene. Tomato skin and pulp. β-Carotene. Crude palm oil. β-Carotene. Carrot. Lycopene. Tomato skin. Lycopene. Tomato skin. Lycopene. Tomato skin and pulp. Temperature. Pressure. Data. “Apparent” solubility. (K). (MPa). points. (Cfo, mg/kg). 313, 323, 333 313 313, 323, 333 313 313, 333, 353 313, 323 313, 323, 333. Cfo/Csat. Ref.. 20, 30, 40. 5. 1900 - 13000. 0.032 – 0.18. (Gopalán et al., 2000). 10 - 35. 6. 2.7 – 46. 1.8 – 12. (Silva et al., 2008). 9.0 – 26. 14. 0.034 – 0.39. 0.041 – 0.49. 40. 1. 7.56. 1.75. (Saldaña et al., 2010). 14, 22, 30. 4. 0.13 – 1.6. 0.054 – 0.46. (Puah, 2005). 12, 15, 20. 5. 0.29 – 2.92. 0.32 – 0.92. (Saldaña et al., 2006). 9.6 - 26.3. 10. 0.018 – 1.4. 0.0041 –. (Gomez-Prieto et al.,. 0.022. 2002). 12. 1.8 – 57. 1. 0.49. 343, 353,. 20, 30, 40,. 363. 50. 313. 40. 0.016 – 0.079 0.0088. (Gomez-Prieto et al., 2002). (Topal et al., 2006) (Saldaña et al., 2010).
(33) 11. Table 2-1. Comparison of apparent (Cfo) and thermodynamic (Csat) solubilites in supercritical CO2 of different compounds in vegetable substrates. Solute. Substrate. Lycopene. Tomato skin and seeds. α-Tocopherol. Crude palm oil. Caffeine. Green coffee oil. Caffeine. Temperature. Pressure. Data. “Apparent” solubility. (K). (MPa). points. (Cfo, mg/kg). 323, 333,. 20, 25, 30,. 343, 353. 35, 40. 313, 333, 353. 14, 22, 30. 20. 7.9 – 23. 8. 0.13 – 1.8. 12. 15 – 78. Cfo/Csat 0.038 – 0.19 (1.7 – 7.0)x10-5. Ref.. (Shi et al., 2009). (Puah et al., 2007). 0.0091 –. (de Azevedo et al.,. 0.041. 2008). 94. 0.026. (Saldaña et al., 1999). 1. 4.4. 0.66. (Saldaña et al., 1999). 25.5. 1. 0.13. 0.0088. (Saldaña et al., 1999). 323. 60. 1. 0.0042. 9.2x10⁻⁷. (del Valle et al., 2005). 318. 36. 1. ~ 0.12. ~ 5.2x10⁻⁵. (del Valle et al., 2003). 323, 333,. 15.2, 24.8,. 343. 28.3, 35.2. Mate tea. 343. 25.5. 1. Theobromine. Mate tea. 343. 25.5. Theophylline. Mate tea. 343. Boldine. Boldo Leaves. Capsaicine. Jalapeño peppers.
(34) 12. Table 2-2. Comparison of thermodynamic solubilities of orange essential oil components (limonene, linalool) in supercritical CO2 in binary, ternary, and complex systems, and apparent solubility in orange peel. Solubility (g/kg). Reference. System 333 K / 10 MPa 323 K / 15 MPa SC-CO2 + limonene. 31.15. C.M.*. (Iwai et al., 1996). SC-CO2 + linalool. 11.65. C.M.. (Iwai et al., 1994). SC-CO2 + 98.5% limonene + 1.5% linalool SC-CO2 + orange essential oil SC-CO2 + orange essential oil + orange peel *. 19.73. -. 19.03. C.M.. -. 86.75. (Morotomi et al., 1999) (Budich & Brunner, 1999) (Mira, Blasco, Subirats, & Berna, 1996). Completely miscible.. dominantly monoterpenes (MTs) hydrocarbons (many, but mostly limonene) and a remainder of oxygenated monoterpenes (OMTs) responsible for its characteristic odour (many, with linalool representing slightly less than half) (del Valle, de la Fuente, Uquiche, Zetzl, & Brunner, 2011). Data of Budich and Brunner (1999) suggests that minor MTs and OMTs do not interact with the main MT and main OMT because of small differences between the solubility of (limonene + linalool) and orange essential oil. Being the critical pressure of the complex CO2 + orange essential oil system below 13 MPa (Budich & Brunner, 1999), orange essential oil is completely miscible in SC CO2 at 323 K and 15 MPa. However, the apparent solubility of orange essential oils in their extraction from peels reported by Mira et al. (1996), although large, is finite under those conditions, suggesting a contribution of additional factors to apparent solubility. This manuscript will show that these differences may be due not only to solute-matrix interactions but also to the residual amount of extract in the vegetable substrate..
(35) 13. 2.3.. Approach In order to simulate the SCFE process of a substrate, exemplified by a pre-pressed. oilseed in this manuscript, authors implemented several mass transfer models based on mass balance equations for thin, differential sections of a packed bed (Appendix A). Authors selected pre-pressed oilseed extraction as a model system because literature contains enough information (predictive tools) to treat this problem in absence of experimental data. The extract (a vegetable oil) can be treated as a single compound, because in most cases vegetable oils are mostly mixtures of triacylglycerol of linear fatty acids having 18 carbon atoms and, for example, the solubility in CO2 does not depend on the degree of unsaturation or position in the molecule of the fatty acids (del Valle & de la Fuente, 2006). Furthermore, there are correlations for the solubility (del Valle et al., 2012) and diffusivity (Funazukuri, Kong, & Kagei, 2008) of vegetable oils in CO2 as a function of system conditions based on ample experimental data from several sources. Finally, there are correlations among dimensionless numbers for mass transfer parameters in packed beds operating with SCFs (del Valle & de la Fuente, 2006; del Valle et al., 2011; Puiggené, Larrayoz, & Recasens, 1997) that can be used to estimate values of model parameters. The microstructure of pre-pressed oilseeds corresponds to a network of interconnected pores that contains all oil originally entrapped in cells because the tissue is completely obliterated by strong shear efforts applied during pre-pressing. The effective diffusivity of oil in this pre-pressed oilseed depends on a microstructural factor (F, Eq. 2.1) (Wakao & Smith, 1962) exhibiting little variation for different oilseeds (del Valle et al., 2006) that depends on their inner porosity. Particle porosity (p), in turn, can be estimated as a function of the residual oil content [(Cs)i] and true density (ρs) of the oilseed following pressing, and the density of the oil (ρoil) using Eq. (2.2), which assumes that the oil fills completely the interconnected pore network resulting from oilseed de-oiling, as it can be observed under the microscope (del Valle et al., 2006).. F. 1. p . 2. (2.1).
(36) 14. p . s Cs i. 1000 oil s Cs i. (2.2). The assumptions of the adopted “predictive” model are typical in SCFE literature: 1) porous spherical particles; 2) constant interstitial velocity of the SC CO 2 in the extraction vessel (packed bed); 3) absence of axial dispersion of solute in SC CO2 in the packed bed; 4) negligible pressure losses and temperature gradients within the bed; and, 5) constant physical properties of SC CO2 and the substrate. To accomplish the objectives of the manuscript, authors applied three versions of this predictive model with different assumptions about solute binding and mass transfer constraints. As the initial condition in all cases, authors assumed an equilibrium condition of the oil between the pre-pressed oilseed and SC CO2 during stabilisation of the temperature and pressure within the extraction vessel (the static extraction period). As the boundary condition, authors assumed that the SC CO2 stream entering the extraction vessel (during the dynamic extraction period) did not contain oil. The specific assumptions of the three models are as follows (the interested reader can refer to Appendix A for further details): Model 1 neglects mass transfer resistances and oil binding, so that an instantaneous equilibrium condition establishes where the concentration of the oil in the SC CO2 within the pores of a particle (intra-particle volume) equals its concentration in the SC CO2 in the void space between the particle and its neighbours in the packed bed (inter-particle volume). The upper limit of oil concentration in SC CO2 is its solubility under extraction conditions; excess oil remains condensed within particle pores. This case represents the case of a solute that does not interact with an “inert” matrix, and represents the simplest possible equilibrium partition condition. The resulting linear partition coefficient depends on the ratio between intra- and inter-particle volumes in the packed bed. Model 2 also neglects mass transfer resistances, but assumes that oil partitions between the pre-pressed oilseed and SC CO2 according to a sorption isotherm/isobar model (Eq. 2.3). This case represents an interacting solid matrix that affects solute transfer to SC CO2 depending on its concentration in the substrate. Oil interacts with the pre-pressed oilseed in a way that its liberation is progressively more difficult because of a strengthening of solute-matrix interactions. Model 1 is a special case of Model 2 for a two-.
(37) 15. step sorption isotherm/isobar model. The mathematical treatment is different though, as it can be surmised in Appendix (A).. . Cf* f Cs. (2.3). Model 3 also assumes equilibrium partition according to a sorption isotherm/isobar, but it includes resistances to mass transfer from pre-pressed oilseed to SC CO2 phase, both within the particles and in a stationary SCF film surrounding them. The resistance to mass transfer in the SC CO2 film (or external resistance) depends on a film coefficient (kf), whereas the resistance in the particle (or internal resistance) depends on the effective diffusivity of the oil (De) in pre-pressed oilseed. A further assumption was that flux might be estimated using a Linear Driving Force (LDF) approximation (Eq. 2.4) with a global mass transfer (kp) and specific surface area (as) given for spherical particles by Eq. (2.5) and Eq. (2.6), respectively:. J kp Cf* Cf . (2.4). kp . 5 kf , and 5 Bi. (2.5). as . 6 1 dp. (2.6). In Eq. (2.5), Bi (dimensionless Biot number) describes the ratio between the internal resistance to mass transfer in the substrate and the external resistance to mass transfer in SC CO2 surrounding the particle, that is defined by Eq. (2.7):. Bi . kf dp 2 De. (2.7). For simulations, authors considered the SC CO2 extraction of pre-pressed oilseeds at 353 K and 90 MPa. Authors assumed that physical properties of mixtures of SC CO2 and dissolved oil are not affected by the oil (low solubility assumption), so that they can be estimated using NIST Database (Lemmon, Huber, & McLinden, 2007) for pure CO2 as a function of extraction temperature and pressure. Estimated values of density () and.
(38) 16. viscosity () at extraction conditions are = 1000 kg/m3 and = 1.20 × 10⁻⁴ Pa s. The binary diffusion coefficient of the oil (component 2) in CO2 (component 1) (D12 = 2.76 × 10⁻⁹ m2/s) was estimated using the correlation of Funazukuri, Toriumi, Yui, Kong, and Kagei (2009). Authors assumed a typical value of residual oil concentration in a prepressed oilseed [(Cs)i = 176.5 g/kg substrate], and used data of del Valle et al. (2006) for pre-pressed rapeseed (ρoil = 914 kg/m3, ρs = 1366 kg/m3) to estimate the porosity (p = 0.21, Eq. 2.2) and microstructural factor (F = 25, Eq. 2.1) of the particle. The effective diffusivity of oil in the pre-pressed oilseed (De = 2.76 × 10⁻⁹ m2/s) was estimated as the fraction of D12 and F (del Valle et al., 2006; Funazukuri et al., 2008). The film coefficient (kf) was estimated using the physical properties (, , D12) and superficial velocity (U) of the CO2 stream, and the particle diameter (dp) as independent variables using the dimensionless correlation of Puiggené et al. (1997) for forced convection. The solubility of the oil in SC CO2 (Csat = 97 g oil/kg CO2) was estimated as a function of extraction temperature and CO2 density using the correlation of del Valle et al. (2012). The superficial velocity of the CO2 stream was estimated as a function of the mass flow rate (Q), CO2 density under process conditions, and cross-sectional area of the extraction vessel. For the packed bed, the inter-particle porosity of a packed bed of regularly spherical particles (ε = 0.36) was adopted (Carman, 1937). 2.4.. Results As a way to fulfil the objectives of the manuscript, mathematical simulations in. next sections show that 1) the initial oil content in the pre-pressed oilseed may affect its apparent solubility, 2) oil partition between the pre-pressed oilseed and CO2 may affect extraction yield, 3) discriminating solute partition effects and mass transfer effects is difficult from integral extraction curves, 4) best-fit parameters from a mathematical model appear adequate only when the model fits reality (assumed and true physical pictures coincide), and 5) best-fitting parameters of inadequate mathematical models applied to laboratory-scale experiments fail simulating large-scale operations..
(39) 17. 2.4.1.. The initial solute content in the substrate affects its apparent solubility The effect of initial solute content in a substrate on the apparent solubility in SC. CO2 was analyzed for the SCFE of oil from pre-pressed oilseed particles in a laboratory scale, 3.2 cm-diameter, 12.8 cm-height extractor (length-to-diameter or aspect ratio L/dE = 4, empty volume V = 100 cm3). The extraction vessel was fed with 48 g CO2/min, which resulted in a superficial velocity U = 1 mm/s. If there are no interactions between the oil and the pre-pressed oilseed the equilibrium partition of the oil between the substrate and SC CO2 depends on the total amount of solute as compared to the fraction SC CO2 can dissolve. Fig. (2-2A) shows a condition where there is excess oil that remains condensed within a pre-pressed oilseed particle while the SC CO2 phase (in the intra- and interparticle space) is saturated with oil, whereas Fig. (2-2B) shows a condition where there is a deficit of oil and the SC CO2 phase has less oil than a saturated mixture of the two. In the limit between the two conditions, there is no condensed oil within the pre-pressed seed, and the concentration of oil in SC CO2 corresponds to the solubility of the oil (Eq. 2.8):. . . . 1 p Csat 1 1 p sCt . (2.8). where Ct is a transition concentration. According to Eq. (2.8), the isotherm/isobar model for a case when there are no solute-matrix interactions is as follows (Eq. 2.9):. Cf* Csat , if Cs . Csat , and K. Cf* K Cs , otherwise,. (2.9a). (2.9b). where the linear partition coefficient is given by Eq. (2.10): K. 1 1 p s 1 p . (2.10). Fig. (2-3) summarizes the results of the simulations carried out using Model 1 using different initial oil contents in the pre-pressed oilseed. Some curves in Fig. (2-3A) have same initial slopes but reach horizontal asymptotes that depend on the initial oil content in the particles. However, curves in those cases where the initial oil content is not enough to.
(40) 18. Figure 2-2. Equilibrium partition of oil between supercritical CO2 an pre-pressed oilseed when there is no interaction between the solutes and the solid matrix in (A) a case where CO2 cannot dissolve all oil so that there is excess oil deposited in pores and the CO2 phase is saturated with oil, and (B) a case where CO2 can dissolve all oil. saturate the SC CO2 phase (Cs < Csat/K) have different initial slopes (different apparent solubilities) and reach their corresponding horizontal asymptotes for a specific CO2 consumption that is related to the residence time of SC CO2 in the extraction vessel. Fig. (2-3B) shows residual oil concentrations in pre-pressed oilseed particles placed along the packed bed for selected times in the case Cso = 0.8 Ct (pre-pressed oilseeds contain 80% of the oil required to saturate SC CO2 during the static extraction period). Selected times correspond to 20, 60, and 100% of the residence time of SC CO2 in the extraction vessel. In this case (when there are no resistances to mass transfer in the SC CO2 and solid phases) a wave develops in the extraction vessel with a step transition from no residual oil in the pre-pressed oilseed to the initial (equilibration) oil content. In the upstream side of this transition, the oil in the intra-particle space is quickly washed out by the flowing SC CO2 stream, whereas in the downstream side there is no transfer of oil from the pre-pressed oilseed particles to a SC CO2 stream having the same oil content as the SC CO2 stationed in the intra-particle space. Reverchon and Marrone (1997) observed a step transition similar to the one in Fig. (2-3B) when using an equilibrium model with constant equilibrium partition..
(41) 19. Figure 2-3. (A) Effect of initial oil content in pre-pressed oilseed on integral extraction curves with supercritical CO2 at 353 K and 90 MPa. The initial solute content is expressed as a percentage of the amount required to saturate the CO2 during the static extraction period (60% indicates that the oilseed contains 60% of the oil required to saturate CO2). (B) Effect of dynamic extraction time on residual oil concentration profiles oil in pre-pressed oilseed along the extraction vessel for the 60% curve in Fig. (2-3A). Times are expressed as a fraction of the residence time of supercritical CO2 in the extraction vessel (0.6 tres corresponds to 60% of U/L)..
Figure
+7


Documento similar