Soft X Ray Emission Analysis Of A Pulsed Capillary Discharge Operated In Nitrogen
5
0
0
Texto completo
(2) ICPP2010 & LAWPP2010 Journal of Physics: Conference Series 511 (2014) 012022. IOP Publishing doi:10.1088/1742-6596/511/1/012022. Soft X-Ray Emission Analysis Of A Pulsed Capillary Discharge Operated In Nitrogen MP Valdivia, JC Valenzuela, ES Wyndham, M Favre, H Chuaqui, and H Bhuyan Facultad de Fı́sica, Pontificia Universidad Católica de Chile, Ave. Vicuña Mackenna 4860, Santiago, Chile. E-mail: [email protected] Abstract. We present results from a pulsed capillary ns discharge source, operated in Nitrogen and N/He mixtures, in an alumina capillary 2.1mm long with outer diameter of 6.3mm and inner diameter of 1.6mm. The electrical energy stored is 0.5J with peak current of 6kA. Fast charging from an IGBT based pulsed power circuit allows operation at 35-600 Hz with voltages in the range of 18-24kV. Characteristic time-integrated N/He spectra were recorded and analyzed for values of 20-200 Å, with clear evidence of He-like Nitrogen emission at 28.8Å, which represents a possible source for water window soft x-ray microscopy. Filtered diode measurements reveal the influence of axial electron beams, generated by hollow cathode dynamics, on the x-ray emission in the range of 300-450 eV. We discuss optimal voltage applied and pressure conditions for soft x-ray generation. Time-integrated MCP images of a filtered slit-wire system delivered clear evidence of full wall detachment with ∼500µm in radial size for the entire emission range and ∼200µm for the emission in the 300-450 eV range.. 1. Introduction Over the last decade capillary discharges have been studied as bright soft x-ray sources [1] [2] [3]. This type of plasma discharge, emitting in the water window range (280 - 540 eV), as a source of He-like Nitrogen emission at 2.88 nm, is a candidate for ”table-top” soft x-ray microscopy. In the present work, x-ray emission spectra from the plasma are analyzed to find the optimal conditions for Nitrogen He-like emission. In order to optimize the discharge, parameters such as voltage, frequency, and pressure, are varied. The axial production of intense electron beams, generated prior to breakdown by the hollow cathode effect, has been studied previously [4]. The soft x-ray output is analyzed considering different electrode configurations, which strongly influence the parameters of the x-ray emitting plasma. To distinguish between electron beams, produced by hollow cathode effect and fluorescence, and x-ray emission, we use a set of magnets and collimators, which avoids confusion in some of the diagnostics techniques employed, as it has been noticed before [3]. Here the use of filtered MCP slit-wire imagery allows an approximation of the maximum energy of our source, as well as an estimate in size for different radiation ranges.. Content from this work may be used under the terms of the Creative Commons Attribution 3.0 licence. Any further distribution of this work must maintain attribution to the author(s) and the title of the work, journal citation and DOI. Published under licence by IOP Publishing Ltd 1.
(3) ICPP2010 & LAWPP2010 Journal of Physics: Conference Series 511 (2014) 012022. IOP Publishing doi:10.1088/1742-6596/511/1/012022. H2O. The Pulsed Capillary Discharge system uses as energy storage a parallel plates capacitor. This system is composed of two circular plates, filled with flowing water, which serves both as coolant and dielectric. The total capacitance of the system is approximately 1.6nF. The discharge takes place inside an alumina capillary, 2.1mm long with outer diameter of 6.3mm and inner diameter of 1.6mm. The charging circuit delivers approximately 0.5J directly to one capacitor plate in less than 1µs, delivering voltages of 18-24kV. This charging circuit has been discussed in detail previously [5]. The upper half of the capacitor plates and alumina capillary are shown in Figure 1. In addition, Figure 2 shows the general diagram of the capillary system, including the placement for diagnostics used in the present study.. Rogowski Coil. 2. Experimental details. Gap 0,1mm. M3. 1mm. Gap 0,3mm 0,52mm. Gap 0,3mm 1.75mm. 0,36mm. 3,0mm. 45º. 21º. 1.2 mm. 0,360. 45º 1.2mm. 1,0 mm. 1.75mm. 1,1mm. 0,8mm. 45º 0.6 mm 1.25mm. 0,6x0,5 deep 1mm Gap 0,2mm. 3,1mm. 0,50 mm. 21mm. Figure 1. Capacitor and capillary. The gas mixture is fed from cathode to anode maintaining a constant flow of gas by pumping through the anode side. Pressure is measured both at the anode (ground) and cathode side. The system is mounted on standard KF fittings to allow mounting of a wide variety of diagnostics. Voltage is measured by an external resistive compensated monitor and current is measured by a single groove Rogowski coil. Diagnostics are placed on axis at the anode side. The diagnostics consist of a negatively biased Faraday cup, which doubles as a bare XRD detecting electrons and x-rays, filtered wide-band planar diodes, and an EUV Rowland circle spectrometer with CCD interface, which records spectra in the range of 20-400Å. HV. N. N. N. N. S. S. S. S. Slit-wire arrays. Pressure sensor. Pressure sensor. Diagnostics: - AXUV Diodes - Spectrometer - MCP. F.C./XRD. Pump system. Gas mixture. Figure 2. Capillary system diagram. 3. Results and discussion 3.1. Slit-wire MCP images Using the intensity obtained from MCP slit-wire images (100, 120, 150 and 200µm wires) and measuring intensity profiles [5], we obtain a value of under 1mm in diameter size for the case of 2.
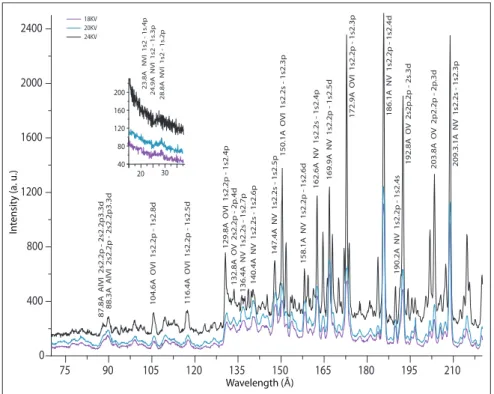
(4) ICPP2010 & LAWPP2010 Journal of Physics: Conference Series 511 (2014) 012022. IOP Publishing doi:10.1088/1742-6596/511/1/012022. an unfiltered image, which clearly shows full wall detachment. When filtering the system with 1µm of Ti, a diameter of under 400µm is found. We conclude the hotter plasma emitting in the desired energy range is located on axis, as well as the cooler plasma. The cooler plasma may surround the hotter plasma or take place at different time ranges, either before and/or after the more energetic emissions. This remains to be determined by further analysis.. Intensity (a. u.). 200. 150. 100. 50 0.0. 1.0. 2.0. 3.0. 4.0. 5.0. Distance [cm]. 6.0. Figure 3. Intensity profile for unfiltered image. 400. 90. 105. 116.4A OVI 1s2.2p - 1s2.5d. 800. 209.3.1A NV 1s2.2s - 1s2.3p. 192.8A OV 2s2p.2p - 2s.3d. 186.1A NV 1s2.2p - 1s2.4d. 172.9A OVI 1s2.2p - 1s2.3p. 203.8A OV 2p2.2p - 2p.3d. 30. 20. 104.6A OVI 1s2.2p - 1s2.8d. 1200. 87.8A AlVI 2s2.2p - 2s2.2p3.3d 88.3A AlVI 2s2.2p - 2s2.2p3.3d. Intensity (a. u.). 40. 190.2A NV 1s2.2p - 1s2.4s. 80. 129.8A OVI 1s2.2p - 1s2.4p 132.8A OV 2s2.2p - 2p.4d 136.4A NV 1s2.2s - 1s2.7p 140.4A NV 1s2.2s - 1s2.6p. 1600. 169.9A NV 1s2.2p - 1s2.5d. 160 120. 162.6A NV 1s2.2s - 1s2.4p. 200. 158.1A NV 1s2.2p - 1s2.6d. 2000. 147.4A NV 1s2.2s - 1s2.5p 150.1A OVI 1s2.2s - 1s2.3p. 18KV 20KV 24KV. 2400. 23.8A NVI 1s2 - 1s.4p 24.9A NVI 1s2 - 1s.3p 28.8A NVI 1s2 - 1s.2p. 3.2. Time-integrated spectra We present comparative spectra for a N/He mixture. Total intensity of emission increases with voltage applied, but as voltage increases, so do impurity lines from wall ablation. The Oxygen lines begin to rise while Nitrogen lines decrease, compared to those of Oxygen, as voltage reaches 24kV. This determines the maximum value of voltage to be used if impurities are to be avoided.. 0 75. 120. 135. 150. Wavelength (Å). 165. 180. 195. 210. Figure 4. Spectra for N/He discharge at two different values of voltage. 3.
(5) ICPP2010 & LAWPP2010 Journal of Physics: Conference Series 511 (2014) 012022. IOP Publishing doi:10.1088/1742-6596/511/1/012022. 3.3. Electronic diagnostics. Voltage [kV]. 10. 0. -10. -20. F.C./Bare XRD [au]. -80. AXUV +1um Ti [au]. A 20kV discharge is shown in Figure 5. The Faraday Cup and Bare XRD signal shows a slight negative peak after voltage breakdown, which we attribute to electron beams originated at the hollow cathode region. The positive signal indicates x-ray emission, which extends well after 40ns. The signal from the AXUV 1µm Ti filtered diode indicates emission at 300-450eV range. Therefore, the emission line at 28.8Å, shown in Figure 4, can be attributed to the x-ray signal observed at this particular time range, whereas total x-ray emission continues well after this time at lower energies. For lower values of anode pressure we observe a slight increase in x-ray emission in the F.C. signal for constant cathode pressure. Also, the AXUV signal shows time delay in x-ray emission as pressure decreases at the anode. For varying cathode pressure, we observe an extended emission in the F.C. signal for lower values, coinciding with an increase in impurities, as seen in spectral data. The influence of pressure parameters in e-beam and x-ray production must be further investigated to fully describe the dynamics of the discharge.. -70. -60. -50. -40. -30. -20. -10. 0. 10. 20. -70. -60. -50. -40. -30. -20. -10. 0. 10. 20. -70. -60. -50. -40. -30. -20. -10. 0. 10. 20. Time [ns]. 0,8. 0,4. 0,0. -80. Time [ns]. 0,2 0,1 0,0 -0,1 -0,2. -80. Time [ns]. Figure 5. Voltage, FC/XRD and AXUV. 4. Summary We have presented a possible source for soft x-ray microscopy. We have discussed the optimal parameters for soft x-ray production and found the time range at which the He-like Nitrogen emission at 28.8Å takes place. We also report the source size indicating full wall detachment and found that the desired emission comes from a much smaller plasma volume, given by a 200µm radius, on axis, radiating at 300-450eV. Acknowledgments The research project, FONDECYT 110005, has been financed by Chilean government. We thank EPPRA sas. for an important contribution to purchasing the spectrometer used. References [1] Tamas M, Jancarek A, Nevrkla M, Vrbova M, Vrba P, 2007, Proc. 28th ICPIG, Prague, Czech Republic, 3P15-16 [2] Vrba P, Jancarek A, Vrbova M, Scholozova L, Fojtik A, Tamas M, Havlikova S, 2004, J. Plasma Fusion Res. SERIES, Vol. 6 [3] Wyndham ES, Favre M, Valdivia MP, Valenzuela JC, 2009, Proc. IEEE Pulsed Power conference, PPC .09 pp. 688-692 [4] Avaria G, Guzmán F, Ruiz M, Favre M, Wyndham E, Bhuyan H, Chuaqui H, 2009, Plasma Sources Sci. Technol. 18 045014 [5] Wyndham ES, Favre M, Valdivia MP, Valenzuela JC, Chuaqui H, and Bhuyan H, 2010, Rev. of Sci. Instrum. 81, 093502 [6] Choi P, Dumitrescu C, Wyndham E, Favre M, Chuaqui H, 2002, Rev. Sci. Instrum. 73, 2276. 4.
(6)
Figure


Documento similar
