Electrical behavior of fruit bearing trees under water deficits
102
0
0
Texto completo
(2) Pontificia Universidad Católica de Chile Facultad de Agronomía e Ingeniería Forestal. Electrical behavior of fruit-bearing trees under water deficits. Liliana Ríos Rojas. Thesis to obtain degree of. Doctor in Ciencias de la Agricultura. Santiago, Chile July 2014.
(3) Thesis presented as part of the requirements to obtain the Doctor in Ciencias de la Agricultura degree, approved by the. Thesis Committee. __________________________ Prof. Luis A. Gurovich, Advisor. __________________________ Prof. José A. Alcalde. ___________________________ Prof. Rodrigo Iturriaga. Santiago, 2014.
(4) My grandfather, who left this world always supporting every achievement in my life, for all hid love and sweet and wise words "go ahead daughter... never stop following your dreams ...".
(5) This study was the thesis doctoral of the author who wishes to thank for your support in the studies development (2011-2014).. MECESUP by the doctoral scholarship. Corpoica for the support in the commission of studies. The VRI for the scholarship of the internship. The LINV for accepted me as a doctoral intern. FIA, Ministry of Agriculture of Chile (project PYT 2011-0038). Wiseconn S. A. Company for your support..
(6) Acknowledgements. To Luis A. Gruovich (PhD), for his teaching and dedication to my doctorate. His constant support was critical to meet the objectives in the planned time. To José A. Alcalde (PhD) and Rodrigo Iturriaga (PhD) professors for accepting to be part of the doctoral committee and supported me in the process. My family, all your love and support have been essential to meet every challenge imposed my life. Ma. V. and Harold Tafur, my dear teachers, to give me your support to undertake this new challenge. To my friends ... all of you! in Chile and Colombia, which were heard, hug and heart on my complaints and my joys ... Residents of the laboratory, in every whizzing supported my work... you also, Patricio Oyarce, Franco Tapia and David Morales. Departamento de Fruticultura y Enología, Facultad de Agronomía e Ingeniería Forestal (FAIF), Pontificia Universidad Católica de Chile: Human quality and great people. Dirección de Investigación y Postgrado, FAIF: teachers, students, secretaries, laboratory and greenhouses and managers..
(7) Content. Chapter 1. General Introduction ………………………………………………..…... 1. Chapter 2. Hypothesis and Objectives…………………………………………..…. 12. 2.1 Hypothesis…………………………………………………………. 12. 2.2 Objectives……………………………………………………….…. 12 Chapter 3. Electrophysiological assessment of water stress in fruit-bearing woody plants…………………………………………………………………..………. 13 3.1 Abstract……………………………………………………….……. 14 3.2 Introduction……………………………………………….………... 15. 3.3 Materials and methods………………………………….………... 19 3.4 Results …………………………………………………………….. 23. 3.5 Discussion………………………………………………….………. 32. 3.6 Conclusions………………………………………………….…….. 33. 3.7 References…………………………………………………….…... 35. Chapter 4. Use of plant woody species electrical potential for irrigation scheduling…………………………………………………………………….……….. 43. 4.1 Abstract……………………………….……………………………. 44. 4.2 Introduction……………………….………………………….…….. 45. 4.3 Materials and Methods……………………………………….…... 48 4.4 Results…………………………………………………….……….. 52. 4.5 Discussion ……………………………………………………….... 61.
(8) 4.6 Conclusions……………….……………………………….………. 64. 4.7 References……………………………………………….………... 65. Chapter 5. Plant electrophysiological response to water deficits under greenhouse and field conditions…………………………………………………..… 72 5.1 Introduction…………………………………………………………. 73. 5.2 Materials and Methods………………………………………........ 74. 5.3 Results and discussion…………………………………………... 75. 5.4 Conclusions……………………………………………………….. 85. 5.5 References................................................................................ 86. Chapter 6. General comments………………………………………………...…….. 87.
(9) List of figures Figure 3.1 Electrode insertions in the tree trunk…………………………..………. 20. Figure 3.2 Keithley 2701 amplifier multi voltmeter connections…………………. 21. Figure 3.3 PE evolution of Prunus domestica for two conditions of soil humidity. (a) Radiation (W.m-2). (b) Temperature (°C). (c) Un-irrigated plants during 5 consecutive days. (d) Plants with 2 daily irrigations…………………... 24. Figure 3.4 (a) Air temperature and solar radiation rates. (b) First-orderdecomposition of EP variations for Prunus domestica in two conditions of soil water content: unirrigated plants during 5 days (black line), and irrigated plants every 12 hours (grey line)………………………………………………….. 25. Figure 3.5 (a) EP frequency associated to the circadian cycle for Prunus domestica, after removing the first-order-decomposition of the signal. (b) Spectral analysis for the period evaluated, Frequency 1 µHz, equivalent to one day………………………………………………………………………………. 27. Figure 3.6 PE Evolution of Persea americana for two conditions of soil humidity. (a) radiation (W.m-2). (b) Temperature (°C). (c) Un-irrigated plants during 5 consecutive days. (d) Irrigated plants every 12 hours. Same period and treatment applied to Prunus domestica (see Figure 3)…………………….. 28. Figure 3.7 First-order-decomposition of the PE variations for Persea americana for two conditions of soil water content: un-irrigated plants during 5 days (black line), and irrigated plants every 12 hours (grey line)…………….. Figure 3.8 (a) Mismatch of the Circadian cycles, represented by the electrical activity of the Prunus domestica (red line) and Persea americana (black line). 29.
(10) plants under constant irrigation (every 12 hours). (b) Daily mismatch (ΔΦ) maximum PE through time………………………………………………………….. 30. Figure 3.9 Differences in EP circadian cycles, (a) Prunus domestica plants and (b) Persea americana plants, under two water availability conditions. In both figures, red line: drought treatment and blue line: no drought…………….. 31. Figure 4.1 Connections at the multi-voltmeter sensor……………………………. 50. Figure 4.2 Electrophysiological response of Persea americana plants measured with the Keithley - sensor setup………………………………………. 53. Figure 4.3 Electrophysiological response of Prunus domestica plants, measured with the Keithley - sensor setup……………………………………….. 54. Figure 4.4 (a) EP for a dead plant of Persea americana plant. (b) Spectral analysis for the EP of a dead plant. Data was measured with the Keithley sensor setup………………………………………………………………………... 56. Figure 4.5 (a) EP for a living Persea americana plants, measured with the Keithley (redline) and the electrophysiological sensor (black line), for the non restriction water period. (b and c) Spectral analysis obtained from data collected by the Keithley - sensor setup and the electrophysiological sensor, respectively………………………………………………………………………….. Figure 4.6 (a).EP of Persea americana plants, measured with the Keithley sensor setup(red line) and with the electrophysiological sensor setup (black line), for the water restriction period (b)Spectral analysis for a well-watered. 57.
(11) plant. (c)Spectral analysis for a water stressed plant, both during the water. 58. restriction period……………………………………............................................... Figure 4.7 (a).EP for Prunus domestica plants during the initial well-watered period. (a) Keithley - sensor setup (red line) and electrophysiological sensor setup (black line), (b and c) Frequency analysis corresponding to the Keithley - sensor and the electrophysiological sensor setups, respectively……………. 59. Figure 4.8 EP for Prunus domestica.(a) Keithley - sensor (red line) and electrophysiological sensor (black line) setups, respectively, for the water restriction period (b and c)Frequency analysis for the Keithley sensor and the electrophysiological sensor setups, respectively………………………………….. 60. Figure 5.1 Greenhouse experimental installations………………………………... 74. Figure 5.2 Electrophysiological response (PE) of Citrus limon plants………….. 77. Figure 5.3 EP Spectral analysis, Citrus limon. (a) No water restriction. Fundamental frequency 1 day. (b) Water restriction. Fundamental frequency 3.5 days………………………………………………………………………………... 77. Figure 5.4 Electrophysiological response (PE) of Prunus persica plants…….. 78. Figure 5.5 Spectral analysis of PE, Prunus persica plants. (a) No water restriction: fundamental frequency 1 day. (b) Water restriction: fundamental frequency 6 days…………………………………………………………………. 79. Figure 5.6 Electrophysiological response (PE) of Actinidia chinensis plants in water restriction. PE: red line; Soil moisture: black line. Period: 15.10.2013 05.12.2013…………………………………………………………………………….. 80.
(12) Figure 5.7 EP Spectral analysis, Actinidia chinensis. (a) No water restriction: fundamental frequency 1 day. (b) Water restriction: fundamental frequency 1 day……………………………………………………………………………………... 81. Figure 5.8. Electrophysiological response (PE) of Prunus persica plants. PE:. 82. red line; Soil moisture: black line. Period: 20.09.2013 - 03.01.2014…………… Figure 5.9 Spectral analysis of PE, Prunus persica. Fundamental frequency 8 days. Fourth fundamental frequency corresponds to 1 day……………………... 82. Figure 5.10 Irrigation program to Prunus avium orchard. Period: September December, 2013………………………………………………………………………. 83. Figure 5.11 electrophysiological response (PE) of Prunus avium plants. Red line: plant 1. Black line: plant 2. Period: 01.09.2013 -15.12.2013………………. 83 Figure 5.12 Spectral analysis of PE, Prunus avium plants (a) plant 1: fundamental frequency 1 day. (b) plant 2: fundamental frequency 1 day……… 84 Figure 5.13 Irrigation program to Vitis vinifera orchard. Period: October December, 2013………………………………………………………………………. 84. Figure 5.14 Electrophysiological response (PE) of Vitis vinifera plants. Red line: plant 1. Black line: plant 2. Period: 01.09.2013-15.12.2013………………. 85 Figure 5.15 Spectral analysis of PE Vitis vinifera plants. (a) plant 1: fundamental frequency 1 day. (b) plant 2: fundamental frequency 1 day……… 85.
(13) List of tables. Table 4.1 Mann Whitney Analysis for A, Gs and Ci in (a) Persea americana and (b) Prunus domestica plants measured at November 22, 2013……………. 61.
(14) Chapter 1 General Introduction. Different researchers agree on the concept that plant electrical signaling have evolved as the response to stressors, in an adaptive process (Fromm and Lautner, 2007; Sukhov et al., 2011; Volkov, 2012 and Gurovich, 2012), evidenced by experimental work with different stimuli (Volkov et al., 2007; Fromm and Lautner, 2007; Heil and Ton, 2008; Wang et al., 2009; Kai et al., 2011; Cabral, 2011; Brenner et al., 2006; Pavlovic and Macuso, 2011; Wagner et al., 2012; Volkov et al., 2012 and Fromm et al. (2013). Plant bioelectrical activity was first reported by Burdon Sanderson (1873), in response to various types of stimuli. In 1896, Darwin showed that the response to stimuli through electrical signals is not an exclusive feature of the animal kingdom, but which is also widely present in the plant kingdom. Sibaoka (1966), in his work with Mimosa pudica, reported electrical activity similar to an action potential (AP), and subsequently Pickard (1973), experimenting with higher plants, reported similar results. Electrical signals generation and transmission in plants have been documented through experiments related to changes in light intensity (Trebacz et al., 2006; Cabral, 2011; Volkov et al., 2012), osmotic pressure (Schroeder and Hedrich, 1989), temperature (Volkov et al., 2007; Wang et al., 2009; Kai et al., 2011; Cabral, 2011), mechanical wounding and insect attack (Brenner et al., 2006 ), variable levels in the cytoplasmic concentration of Ca. +2. (Shepherd, 2005), change in respiration rates,. 1.
(15) photosynthesis and phototropism 10 (blue light) (Volkov and Ranatunga, 2006; Pavlovic and Macuso, 2011), flowering induction (Parimalan, et al., 2005, Wagner et al., 2006; Wagner et al., 2012), recognition of attack and defense to herbivores (Fromm and Lautner, 2007; Heil and Ton, 2008), mechanical stimulation (Braam, 2005; Volkov and Ranatunga, 2006) and water availability (Brenner et al., 2006; Gurovich and Hermosilla, 2009; Oyarce and Gurovich, 2010). Major revisions on the response of plants to different stimuli have been published by Baluska and Mankuso (2009); Fromm and Lautner (2012) and Gurovich (2012). Electrical signals in plants are a replica of the stimulus (Fromm, 2006). The AP, which is the response to a stimulus that has exceeded a threshold, and responds to the law of ‘all or nothing”, has been widely documented (Lautner et al., 2005; Oyarce and Gurovich, 2010; Volkov et al., 2009; Wang et al., 2009). Variation potential (VP) represents the response to stimuli of a lower intensity than the threshold level that generates an AP, and it varies with the intensity of the stimulus (Yan et al., 2009) and may be related to xylem transmission strength; is also called ”slow-wave potential” (Gensler and Yan, 1998; Stahlberg et al., 2005). Electrical signals can be transmitted between plant tissues as a result of potential changes of the transmembrane, due to a specific stimulus that creates a wave of depolarization spreading through the plasma membranes of adjacent excitable cells (Volkov and Ranatunga, 2006), with the ability to generate and coordinate physiological activity over long distances within the plant (Lautner et al., 2005). Transmission speed of an AP, in response to an environmental stimulus, can achieve speeds up to 40 ms. −1. (Volkov and Brown, 2004; Oyarce and Gurovich, 2010). The transmission of a VP 2.
(16) −1. can reach velocities in the range of 0.1 to 10 mms. (Koziolek, 2003; Stahlberg et. al., 2005). The transmission of electrical signals in plants occurs mainly via the phloem, through the cell continuous symplastic connections (Bose, 1926; Cosgrove and Hedrich, 1991; Fromm and Fei, 1998; Lautner et al., 2005; Van Bel and Ehlers, 2005), at considerable distances separating plant tissues or organs; thus it corresponds to a transmitting information system of electro- chemical nature, which functions as a single neural network (Mancuso, 1999; Volkov et al., 2007; Zimmermann et al., 2009). Fomm and Lautner (2012) mention that long-distance plant signaling plays an important role in photosynthesis physiological regulation related to water stress. Stomata conductance and photosynthetic process intensity have also been used as indicators of the electrical response to water stress, being commonly identified as indicators of plant water status (Farquhar and Sharkey, 1982; Yoon and Richter, 1990). Specific evidence of the effect of electrical signals on stomata regulation has been reported by Grams et al. (2009) and Lautner et al., (2005), indicating that the evocation of a VP with flashover in a leave, generates a decrease in CO2 uptake rate. Evidence of decreased stomata conductance and CO2 assimilation has been also documented by Fromm and Fei (1998) while subjecting Zea mays plants to a steady decline in soil moisture content; this response was directly correlated to EP −1. variations. Plant EP changes at a speed of 1 cms. have been documented by. Fromm and Fei (1998), before Zea mays leaf turgor reduction can be measured, as a result of water stress. Grams et al. (2007) reported EP changes in EP response to −1. rehydration, with a magnitude of 50 mV and transmission speed of 1 cms , 3.
(17) associated with increased stomata conductance and CO2 absorbance before 60 s after rehydration begins. These response speeds indicate that different signaling mechanisms than hydraulic signals (Mullendore et al., 2010) or hormonal signals (Rodriguez et al., 2011), should serve as an information link between various plant organs in response to changes in soil water availability, conceptualized as a steady state (dynamic balance) between water flow from the soil into the roots and evapotranspirative flux at the leaf level (Koziolek, 2003; Fromm, 2006; Gibert, 2006). Evidence of plant signal transmission and communication over long distances have been presented by difference authors. Gibert (2006) reported a significant correlation between sap flow and plant EP (with a diurnal cycle) measured in the trunk of Populus nigra L. Mancuso (1999) measured EP changes in Vitis vinifera plants, when succulent shoots are subjected to wounds or cuts. Electrical responses to water status of woody plants such as Persea americana and Prunus persica, as a result of root substrate water content variations, have been documented by Gurovich and Hermosilla (2009); Oyarce and Gurovich (2010); Oyarce and Gurovich (2011); Ríos-Rojas et al. (2014). Using plant electrical signals as an indicator of water status, in this research we characterize EP in woody plants as a tool to define precise, real time, non-destructive irrigation scheduling. Systematic real-time EP measurements in woody plant species have been carried out during the last 3 years, both in isolated Faraday cages as well as in a commercial orchard, varying substrate and soil water availability by alternating irrigated periods and total water restriction periods. Plant EP was measured using electrodes inserted in tree trunks, using both a Keithley 4.
(18) multivoltmeter type sensor and electrophysiological sensor designed as part of this research. Results allowed us to conclude that EP can be used as a reliable and high sensitive, real-time indicator of plant water status, for its use in fruit orchard irrigation scheduling, as an alternative to xylem potential periodic determinations.. References Baluška F, Mancuso S. Plant neurobiology: From stimulus perception to adaptive behavior of plants, via integrated chemical and electrical signaling. Plant Signal Behav 2009; 4: 475-76. Bose J. C. The Nervous Mechanism of Plants. London, UK: Longmans, Green and Co, 1926; 123-34. Braam J. In touch: plant responses to mechanical stimuli. New Phytol 2005; 165: 373-89. Brenner E, Stahlberg R, Mancuso S, Vivanco J, Baluška F, Van Volkenburgh E. Plant neurobiology: an integrated view of plant signaling. Trends Plant Sci 2006; 8: 413-9. Burdon-Sanderson J. Note on the electrical phenomena which accompany irritation of the leaf of \textit{Dionaea} muscipula. Proc R Soc Lond 1872; 21: 495-6.. 5.
(19) Cabral E, Pecora P, Céspedes A, Bruno A, Costa E. The oscillatory bioelectrical signal from plants explained by a simulated electrical model and tested using Lempel?Ziv complexity. Comput Electron Agr 2011; 76: 1-5 Cosgrove D, Hedrich R. Stretch-activated chloride, potassium, and calcium channels coexisting in the plasma membranes of guard cells of Vicia faba L. Planta 1991; 186: 143-53. Darwin C. The Power of Movements in Plants. New York. D. Appleton and Co. 1896; 625 pp Farquhar G, Sharkey T. Stomata conductance and photosynthesis. Annu Rev Plant Physiol. Plant MolBiol 1982; 33:317-45 Flexas J, Barón M, Bota J, Ducruet JM, Gallé A, Galmés J, Jiménez M, Pou A, Ribas-Carbó M, Sajnani C. Photosynthesis limitations during water stress acclimation and recovery in the drought-adapted Vitis hybrid Richter-110 (V. berlandieri x V. rupestris). J Exp Bot 2009; 60:2361-77. Fromm J, Fei H. Electrical signaling and gas exchange in maize plants of drying soil. Plant Sci 1998; 132:203-13. Fromm J, Hajirezaei M, Becker V, LautnerS. Electrical signaling along the phloem and its physiological responses in the maize leaf. Front Plant Sci 2013; 4:239 Fromm J, Lautner S. Electrical signals and their physiological significance in plants. Plant Cell Environ 2007; 30:249-57.. 6.
(20) Fromm J, Lautner S. Generation, Transmission, and Physiological Effects of Electrical Signals in Plants. In Volkov A. Plant Electrophysiology.Springer-Verlag Berlin Heidelberg 2012; 207-32. Fromm J. Long-distance electrical signaling and its physiological functions in higher plants. In Plant Electrophysiology (ed. A.G. Volkov). Berlin Heidelberg. SpringerVerlag 2006; 269-85. Gensler. W,. Yan. T.. Investigation of. the. causative reactant of. the. apoplast. electropotentials of plants. J Electrochem Soc 1998; 135: 2991-95. Gibert D, Le Mouel J, Lambs L, Nicolin F, Perrier F. Sap flow and daily electric potential variations in a tree trunk. Plant Sci 2006; 171: 572-84. Grams T, Koziolek C, Lautner S, Matyssek R, Fromm J. Distinct roles of electric and hydraulic signals on the reaction of leaf gas exchange upon re-irrigation in Zea mays L. Plant Cell Environ 2007; 30:79-84. Grams, T, Lautner, S., Felle, H.H., Matyssek, R., and Fromm, J. Heat-induced electrical signals affect cytoplasmic and apoplastic pH as well as photosynthesis during propagation through the maize leaf. Plant Cell Environ 2009; 32:319-26. Guardia M, Fernández J, Elena G, Fleck I. Stomatal patchiness in the Mediterranean holm oak (Quercus ilex L.) under water stress in the nursery and in the forest. Tree Physiol 2012; 32:829-38. Gurovich, L. Electrophysiology of woody plants. In: Electrophysiology - From Plants to Heart. 2012. Saeed Oraii (Ed.), Croatia: InTech Publishers.. 7.
(21) Gurovich L, Hermosilla P. Electric signaling in fruit trees in response to water applications and light-darkness conditions. J Plant Physiol 2009; 166: 290?300. Heil M, Ton J. Review. Long-distance signaling in plant defence. Trends Plant Sci 2008; 13: 264-72. Kai L, Xi G, Fan L, Meng X, Gao X, Liu Q. The changes of electrical signals in corn at different temperatures. Proc. 3rd International Conference on Environmental Science and Information Application Technology (ESIAT 2011). In; Procedia Environmental Sciences 2011; 10: 39-44. Berlin Heidelberg. Elsevier. Available on line at www.sciencedirect.com. Consulted 5 February 2014. Koziolek C, Grams T, Schreiber U, Matyssek R, Fromm J. Transient knockout of photosynthesis mediated by electrical signals. New Phytol 2003; 161: 715-22. Lautner S, Grams T, Matyssek R, Fromm J. Characteristics of electrical signals in poplar and responses in photosynthesis. Plant Physiol 2005; 138: 2200-9. Mancuso E. Hydraulic and electrical transmission of wound-induced signals in Vitis vinifera. Aust J Plant Physiol 1999; 6: 55-61. Mullendore D, Windt C, Van As H, Knoblaucha M. Sieve tube geometry in relation to phloem flow. Plant Cell 2010; 22: 579-93. Oyarce P, Gurovich L. Electrical signals in avocado trees. Responses to light and water availability conditions. Plant Signal Behav 2010; 5: 34-41. Oyarce P, Gurovich L. Evidence for the transmission of information through electric potentials in injured avocado trees. J Plant Physiol 2011; 168:103-8. 8.
(22) Parimalan R, Giridhar P, Joel A, Jagadeesan S. Molecular basis of flower initiation - A review. Indian J Biotechnol 2005; 4: 455-65. Pavlovic A, Mancuso S. Electrical signaling and photosynthesis: Can they co-exist together? Plant Signal Behav 2011; 6: 840-2. Pickard B. Action potentials in higher plants. The Botanical Review 1973; 39: 172-201. Ríos-Rojas L, Tapia F, Gurovich L. Electrophysiological assessment of water stress in fruit-bearing woody plants. J Plant Physiol 2014; 171:799-806. Rodríguez-Gamir J, Ancillo G, González M, Primo-Millo E, Iglesias D, Fomer G. Root signaling and modulation of stomata closure in flooded citrus seedlings. Plant Physiol Biochem 2011; 49: 636-45. Schroeder J, Hedrich R. Involvement of ion channels and active transport in osmoregulation and signaling of higher plant cells. Trends Biochem Sci 1989; 14: 187-92. Shepherd, V. From semi-conductors to the rhythms of sensitive plants: the research of J.C. Bose. Cell Mol Biol 2005; 51: 607-19. Sibaoka T. Action potentials in plant organs. Symp Soc Exp Biol 1966; 20: 49-73. Stahlberg R, Cleland RE, Van Volkenburgh E. Decrement and amplification of slow wave potentials during their propagation in Helianthus annuus L. shoots. Planta 2005; 220: 550-8. Sukhov V, Nerush V, Orlova L, Vodeneev V. Simulation of action potential propagation in plants. J Theor Biol 2011; 291: 47-55. 9.
(23) Trebacz K, Dziubinska H, Krol E. Electrical signals in long-distance communication in plants. In Communication in Plants ? Neuronal Aspects of Plant Life (Baluška F, Mancuso S, and Volkmann D. Eds.) Berlin Heidelberg:Springer-Verlag; 2006. Van Bel A, Ehlers K. Electrical signaling via plasmodesmata. In Plasmodesmata (ed. KJ Oparka). Annual Plant Reviews. Oxford, UK:Blackwell Publishing 2005; 18: 263-78. Volkov. A.. Plant. Electrophysiology.. Signaling. and. Responses.. Berlin. Heidelberg:Springer Verlag; 2012. Volkov A, Brown C. Electrochemistry of plant life. In: Electrochemistry Encyclopedia. http://electrochem.cwru.edu/ed/encycl/art-p01-plants.htm. 2004. Consulted: September 2012. Volkov A, Carrell H, Markin V. Biologically closed electrical circuits in Venus flytrap. Plant Physiol 2009; 149: 1661-7. Volkov A, Lang L, Volkova-Gugeshashvili M. Electrical signaling in Aloe vera induced by localized thermal stress. Bioelectrochemistry 2007; 71: 192-7. Volkov A, Ranatunga R. Plants as environmental biosensors. Plant Signal Behav 2006; 1: 105-15. Volkov A, Waite A, Wooten J, Markin V. Circadian rhythms in biologically closed electrical circuits of plants. Plant Signal Behav 2012; 168: 1753-60.. 10.
(24) Wagner E, Lehner L, Normann J, Veit J, Albrechtova J. Hydro-electrochemical integration of the higher plant-basis for electrogenic flower induction. In: Communication in Plants: Neuronal Aspects of Plant Life (Baluška, F. ed). Berlin Heidelberg; Springer-Verlag; 2006. Wagner E, Lehner L, Veit J, Normann J, Albrechtová J. Biosystems analysis of plant development. concerning. electrochemical. signal. photoperiodic transduction.. flower. Plant. Induction. by. hydro-. Electrophysiology.. Berlin. Heidelberg: Springer Verlag; 2012. Wang Z, Leng Q, Huang L, Zhao L, Xu Z, Hou R, Wan C. Monitoring system for electrical signals in plants in the greenhouse and its applications. Biosyst Eng 2009; 3:1-11. Yan X, Wang Z, Huang L, Wang C, Hou R, Xu Z, Qiao X. Review: Research progress on electrical signals in higher plants. Prog Nat Sci 2009; 19:531-41. Yoon T, Richter H. Seasonal changes in stomatal responses of sweet cherry and plum to water status in detached leaves. Physiol. Plant 1990; 80:520-26. Zimmermann M, Maischak H, Mithofer A. Boland W. Felle H. System potentials, a novel electrical long-distance apoplastic signal in plants induced by wounding. Plant Physiol 2009; 149:1593-1600.. 11.
(25) Chapter 2. Hypothesis and Objectives. 2.1 Hypothesis Woody plants present an electrical behavior related to soil water availability, which can be used as a real time early indicator of water stress for accurate irrigation scheduling.. 2.2 Objectives. General Objective Define electric behavior of fruit-bearing woody plants under water deficit conditions.. Specific Objectives Characterize the electrical signal of woody plants under different micro environmental conditions.. Define specific electric response of woody plants, under water deficits, to be used as an irrigation scheduling tool.. 12.
(26) Chapter 3. Electrophysiological assessment of water stress in fruit-bearing woody plants. Liliana Ríos-Rojas a, Franco Tapia b, Luis A. Gurovich a. This Chapter was published in Journal of Plant Physiology 171:799-806 (June, 2014). 13.
(27) 3.1 Abstract Development and evaluation of a real-time plant water stress sensor, based on the electrophysiological behavior of fruit-bearing woody plants is presented. Continuous electric potentials are measured in tree trunks for different irrigation schedules, inducing variable water stress conditions; results are discussed in relation to soil water content and micro – atmospheric evaporative demand, determined continuously by conventional sensors, correlating this information with tree electric potential measurements. Systematic and differentiable patterns of electric potentials for water-stressed and no-stressed trees in two fruit species are presented. Early detection and recovery dynamics of water stress conditions can also be monitored with these electrophysiology. sensors,. which. enable. continuous. and. non-destructive. measurements for efficient irrigation scheduling throughout the year. The experiment was developed under controlled conditions, in Faraday cages located at a greenhouse area, both in Persea americana and Prunus domestica plants. Soil moisture evolution is controlled using capacitance sensors and radiation, temperature, relative humidity, wind intensity and direction are continuously registered with accurate weather sensors, in a micro-agrometeorological automatic station located at the experimental site. The electrophysiological sensor has two stainless steel electrodes (measuring / reference), inserted on the stem; a high precision Keithley 2701 digital multimeter is used to measure plant electrical signals. An algorithm written in MatLab ®, allows. 14.
(28) correlating the signal to environmental variables. An electric cyclic behavior is observed (circadian cycle) in the experimental plants. For non-irrigated plants, the electrical signal shows a time positive slope and then, a negative slope after restarting irrigation, throughout a rather extended recovery process, before reaching a stable electrical signal with zero slope. Well-watered plants presented a continuous signal with daily maximum and a minimum EP of similar magnitude in time, with zero slope. This plant electrical behavior is proposed for the development of a sensor measuring real-time plant water status. Abbreviations AP, action potential (mV) ; EP, electric potential (mV); SD, standard deviation; VP, variation potential (mV); Ɵ, volumetric soil water content (%). Keywords Persea americana, Plant electric signal transmission, Plant electrophysiology, Prunus domestica, Water stress.. 3.2 Introduction Plant bioelectric activity in response to different stimuli was originally reported by Burdon-Sanderson (1873) and Darwin (1896). Plants have developed several paths for electric signal transmission between individual cells, tissues and organs, in order to adapt and optimize its physiological processes to sudden changes in environmental stress conditions (Fromm, 2006; Mancuso and Mugnai, 2006; Fromm. 15.
(29) and Lautner, 2007; Wang et al., 2009; Yan et al., 2009; Sukhov et al., 2011; Gurovich, 2012; Volkov, 2012). Sibaoka (1966), working with Mimosa pudica, reported the onset of electric activity, equivalent to an action potential (AP), and Pickard (1973), experimenting with higher plants, described similar results. Different studies have been published on electric signaling in plant cells and tissues, resulting from biotic and abiotic stimuli, resembling an electrical replication of the specific stimulation (Fromm, 2006). AP are generated in plants in response to a stimulus larger than a certain threshold, in the form of an all or nothing response, as documented by several authors (Datta and Palit, 2004; Lautner et al., 2005; Gil et al., 2008; Volkov et al., 2012; Wang et al., 2009; Oyarce and Gurovich, 2010). Also, variation potentials (VP) have been reported in plants, characterized as an electric response to stimuli smaller that the specific AP threshold, being its magnitude a function of its intensity (Yan et al., 2009). It has been suggested that VP transmission rates are related to xylematic turgor conditions and VP is also known as “short wave potential” (Stahlberg and Cosgrove, 1995; Gensler and Yan, 1998; Stahlberg et al., 2005). Electrical signal generation and transmission in plants has been documented in relation to modifications in light intensity (Volkov and Haak, 1995; Trebacz et al., 2006; Cabral et al., 2011; Volkov et al., 2012), osmotic pressure (Schroeder and Hedrich, 1989), temperature (Volkov et al., 2007; Wang et al., 2009; Cabral et al., 2011; Kai et al., 2011), mechanical wounds and insect activity (Brenner et al., 2006), changes in cytoplasmic Ca+2 concentrations (Knight et al., 1991; Fromm and Spanswick, 1993; Shepherd, 2005), changes in respiration, photosynthesis and 16.
(30) phototropism (blue light) (Lautner et al. 2005; Pavlovic and Macuso, 2011), flower induction (Parimalan et al., 2005; Wagner et al., 2006; 2012), defense mechanisms to herbivore damages (Volkov and Ranatunga, 2006; Fromm and Lautner, 2007; Heil and Ton, 2008), mechanical stimulation (Braam, 2005; Volkov and Ranatunga, 2006) and soil water availability (Fromm and Fei, 1998,; Brenner et al., 2006; Gurovich and Hermosilla, 2009; Oyarce and Gurovich, 2010). Several reviews related to plant electric responses to different stimuli have been published by Fromm and Lautner (2007), Baluška and Mancuso (2009) and Gurovich (2012). Electric signals can be transmitted between plant organs and tissues because changes in the trans - membrane potential induced by a specific stimulus create a depolarization wave, propagating through plasmatic membranes of excitable adjacent cells (Volkov and Ranatunga, 2006), enabling plants to generate and coordinate physiological activity at significant distances (Lautner et al., 2005). Transmission rates up 40 m s-1 for AP haven reported by Volkov and Brown (2004); Oyarce and Gurovich (2010). For VP transmission, rates ranges between 0,1 a 10 mm s-1 have been measured (Stahlberg and Cosgrove, 1995, 1997; Koziolek et al., 2003; Stahlberg et al., 2005). Electric signal transmission in plants takes place mainly through cellular connections in the symplastic phloematic continuum (Bose, 1926; Cosgrove and Hedrich, 1991; Fromm and Fei, 1998; Lautner et al., 2005; Van Bel and Ehlers, 2005). Essentially, it is an electrochemically activated communication system, operating as a simple neuronal net (Mancuso, 1999; Volkov et al., 2007; Zimmermann et al., 2009).. 17.
(31) Evidences of electric signal transmission between distant plant organs have been documented by Fromm and Fei (1998), reporting electric potentials (EP) rates of 1 cm s-1, which induced stomata closing before a reduction of leaf turgor could be measured in Zea mays plants under water stress. Also, Grams et al. (2007) reported EP differences of 50 mV and electric signal transmission rates of 1 cm s-1, associated to an increment in stomata conductance and CO2 absorption, which starts 60 s after rehydration. These results indicate that signals different to hydraulic (Mullendore et al., 2010) or hormone signaling (Rodríguez et al., 2011), must be present as an information pathway between plant organs, to account for these fast physiological responses to changes in water availability, defined as a dynamic steady state of the soil water flow to roots and the evapo-transpirative leaf water flow to the atmosphere (Koziolek et al., 2003; Fromm, 2006; Gibert et al, 2003). Most studies on EP in plants have been carried on under laboratory or greenhouse controlled conditions, mainly in succulent plants (Mwesigwa et al., 2000; Volkov et al., 2007; 2009; 2012). In woody species, like Vitis vinífera, Mancuso (1999), measured significant EP changes as a result of leaf and shoot flaming injury and mechanical wounds, reporting also a detection of the resulting electric signal in distant plant organs, a short time after the injury event. Gibert et al. (2006) reported a significant correlation between EP and sap flow in Populus trichocarpa trees, concluding that the electric signals measured are propagated through the phloem, at short or long distances, modifying photosynthetic rates. Systematic electric signaling in fruit- bearing woody species, induced by alternate light/dark cycles and. 18.
(32) soil water deficits, have been reported by Gil et al. (2008; 2009); Gurovich and Hermosilla (2009); Oyarce and Gurovich (2011). This research presents evidence on systematic EP variations in Prunus domestica and Persea americana trees for alternate cycles of full irrigation and water restriction periods, in association with alternate micro environmental conditions (soil water content depletion and evapotranspiration rates). Electrophysiological sensors developed for this research enable real-time EP measurements, to be used as a non-destructive and continuously agronomic tool for irrigation scheduling in fruitbearing woody species, as an alternative to discrete xylematic pressure measurements or other soil and plant stress assessment techniques available, which are time consuming and highly dependent on the operator’s skill, to accurately represent the actual plant water status.. 3.3 Materials and methods Experimental setup and plant material. The experiment was located at the greenhouse area adjacent to the School of Agriculture and Forestry, Pontificia Universidad Catolica de Chile in Santiago, Chile. Two independent Faraday cages are isolated from environmental electromagnetic fields, using a tested grounded connection. In each cage, ten 3-years-old avocado plants (Persea Americana Mill., cv. Hass, grafted on Mexicola rootstock) and plum (Prunus domestica L., cv. D’Agen, grafted on Mariana 2624 rootstock), are grown. 19.
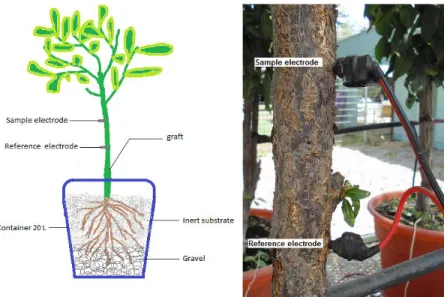
(33) in individual 20 L containers in easily drainable 50% peat moss / 50% perlite (Prunus domestica L.) and 100% perlite (Persea Americana Mill.) substrates respectively, enabling to create water deficit conditions in short periods of time. An independent, programmable irrigation system is available on each Faraday cage, to create differentially controlled water supply treatments, in order to evaluate plant EP responses to alternated water availability conditions. Electric connections in plants. Two electrodes are inserted on each lignified trunk at 20 cm (reference electrode) and 30 cm (measuring electrode) above the graft (Figure 3.1), according to our previous experimental results (Gurovich and Hermosilla, 2009). Each electrode consists of a solid stainless steel 304 SS type 316 rod, 3.18 cm long and 0.2 cm diameter, connected to a 0.5 mm cooper conductor, shielded from air relative humidity fluctuations by a flexible self-adhesive plastic ribbon.. Figure 3.1 Electrode insertions in the tree trunk.. 20.
(34) Each electric circuit is connected to an amplifier – multi voltmeter (Keithley, model 2701), provided with two 20 channel multiplexer plates model 7700 (Figure 3.2), with the positive terminal for the measurement electrode and the negative terminal for the reference electrode, on its ‘high’ (H) y ‘low’ (L) insertion points, respectively. Registration of EP measurements, using the EXCELinx® utility software, is made every 10 s and each measurement lasts 0.1 ms. EP information registered is analyzed in graphic format using a MatLab® algorithm, developed for this research.. Figure 3.2 Keithley 2701 amplifier multi voltmeter connections. 21.
(35) Simultaneously to EP measurements, electric capacitance sensors (Decagon model 10HS), located within each plant container peat moss/perlite or perlite substrate, enables real-time volumetric soil water measurements (Ɵ, %); also, micro environmental parameters are registered using sensors integrated into an automatic meteorological station (radiometer, hygrometer, thermometer, wind speed and direction sensors), located between the two Faraday cages; data is transmitted through the Internet to the WiseConn S. A. server, and analyzed using the DropControl® software, enabling a graphic display of each parameter and the calculation of hourly ET potential values, by using an internal algorithm based on Penman-Monteith model, modified by FAO (Allen et al., 1998). Plant EP (the difference between EP values simultaneously measured at both electrodes) are correlated to Ɵ and to meteorological parameters (solar radiation sr, W m-2, air temperature T, °C) to measure plant electric behavior in response to variations in the dynamic steady state water availability conditions. A water restriction experiment is reported, lasting from March 15 to April 11, 2013, period characterized by an high atmospheric evaporative demand (4.41 mm d -1; standard deviation (sd): 0.79). A five plant suset, on each Faraday cage, is irrigated every 12 hours with 2.4 L tap water in each container throughout the experiment, keeping Ɵ at 43.1 % (±0.5 %) for Prunus domestica and θ at 30.1 % (±3.8%) for Persea americana, respectively. A five plant subset in each species is kept without irrigation between March 28 to April 3, when visual water stress symptoms are evident in the early morning hours and Ɵ reaches 16.3% and 8.3% for Prunus. 22.
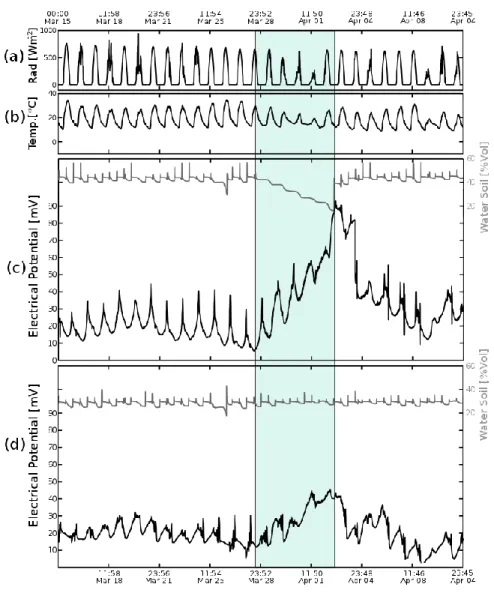
(36) domestica and Persea americana, respectively. Irrigation every 12 hours is again supplied to all experimental plants to start a recovery period, lasting until April 11.. 3.4 Results EP measurements and environmental conditions in Prunus domestica plants are recorded from March 15 to April 11, 2013 (Figures 3.3a (variations of solar radiation, in the range 0 to 660 Wm-2); 3b (air temperature, in a range 6 to 32 °C); 3c and 3d (substrate volumetric water content Ɵ). EP values for each plant subset (irrigated twice a day and non-irrigated between March 28 and April 3, respectively), are measured in a representative plant. EP values presented in Figures 3.3c and 3.3d indicate the existence of a differential plant electrical response as related to solar radiation and air temperature variations; likewise, the maximum daily EP values, for plants subject to water restriction between March 28 and April 03 (blue band in Figures 3.3c and 3.3d) are significantly higher than the maximum daily EP values measured in non-restricted water plants. As the substrate dries, the maximum daily EP value increases from 18.8 mV to 92.9 mV, detected at 11:29 am (sd 0:26). Minimum potential values, detected at 6:45 pm, (sd 1:08), range 7.09 mV at the onset of the non-irrigated period and 57.13 mV, just before the first irrigation is supplied, ending the water restriction period, on April 3 at 00:30. The maximum and minimum daily EP values increase 1.4 mVƟ-1 for the period of water restriction, in the range 47.8% > Ɵ >16.3%. When plants are kept in a twice daily irrigation regime, with constant Ɵ, the temporary variation in the 23.
(37) maximum and minimum EP daily values vary between 18.44 mV, (sd 5.22) and 48.45 mV (sd 4.66), events taking place at 9:48 am (sd 2:05) and 6:43 pm (sd 1:43), respectively.. Figure 3.3 PE evolution of Prunus domestica for two conditions of soil humidity. (a) Radiation (W.m-2). (b) Temperature (°C). (c) Un-irrigated plants during 5 consecutive days. (d) Plants with 2 daily irrigations.. Plant electrical response presents a periodical pattern, with a daily average oscillation of ±20 mV, which increases to 80 mV, for plants without irrigation. 24.
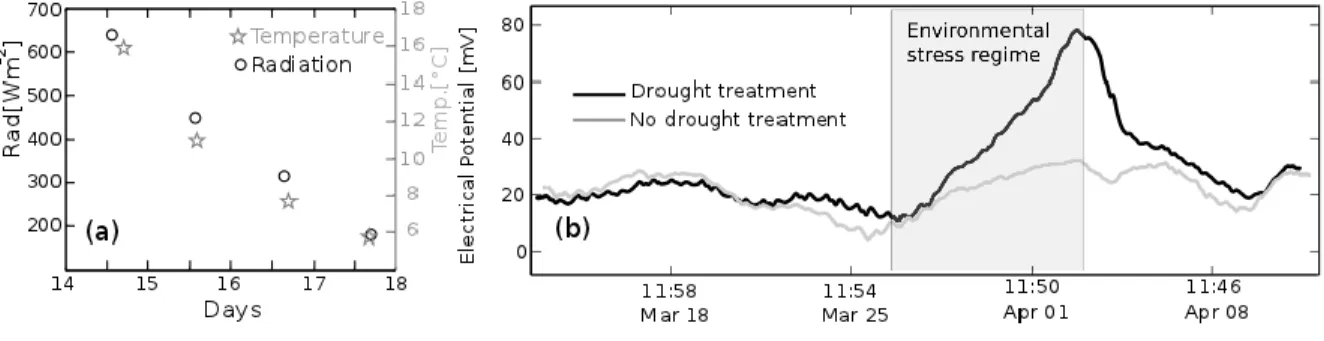
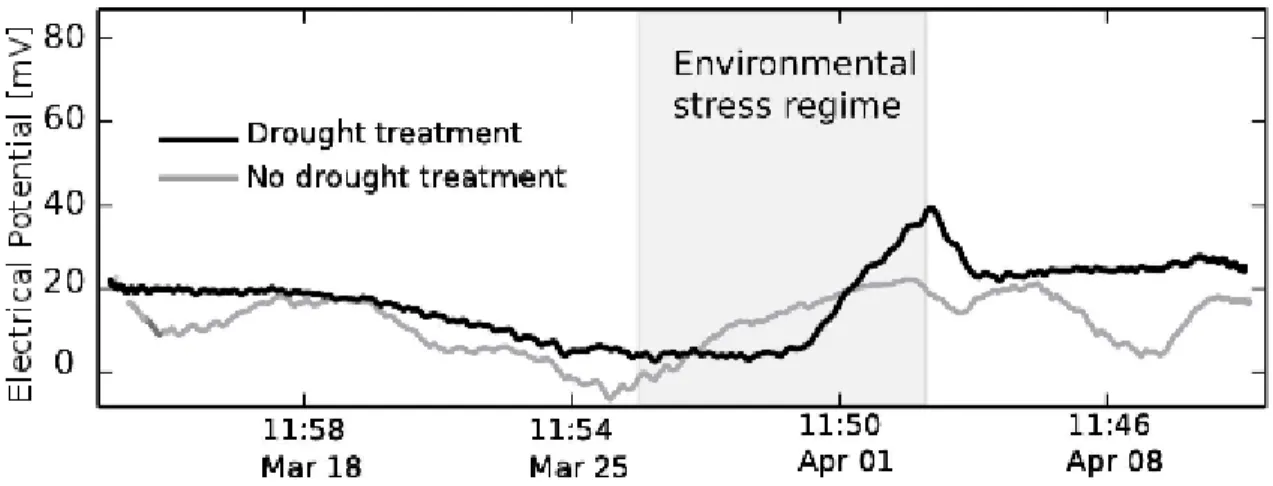
(38) According to the information presented in Figure 3, plant electrical response is also affected by the variation on environmental factors, like air temperature and solar radiation, which decreased during the period of water restriction at a rate of 3.3°C day-1 and 140 Wm-2 day-1, respectively (Figure 3.4a). Differential electrical responses for watered plants (grey line) and water restricted plants (black line) indicate the specific effect of water availability on plant EP (Figure 4b), when the signal is analyzed using the wavelet decomposition method (Lewalle et al., 2007) enabling to isolate a first-order-numeric decomposition of the electrical signal, in order to remove the circadian cycle (McClung, 2001) and to quantify other environmental effects. EP response of Prunus plants under specific environmental conditions of radiation, temperature and water availability, suggests possible systemic plant coordination, by means of electrical signaling taking place between different plant organs, during the development of plant water stress, possibly determining the magnitude and intensity of its physiological responses.. Figure 3.4 (a) Air temperature and solar radiation rates. (b) First-orderdecomposition of EP variations for Prunus domestica in two conditions of soil water content: unirrigated plants during 5 days (black line), and irrigated plants every 12 hours (grey line).. 25.
(39) Figure 3.5a shows EP oscillatory behavior during the whole experimental period, showing a clear circadian frequency (“high frequency”), using Sadowsky (1996) wavelet method to analyze EP values for a representative experimental plant of Prunus (Figure 3.5 b) in four time intervals considered: irrigated plants, March 15 28 and April 05 - 11 (green band), plants with water restriction, March 28 - April 03 (grey band) and plants with water restriction but in a recovery stage, April 03 - 05 of 2013 (red band); the circadian behavior occurs in irrigated and non-irrigated plants in the four periods. From April 3, when irrigation water is re-supplied to plants previously subjected to water restriction, a recovery period begins (red band), with an irregular electrical response to sudden rehydration; this irregular electrical behavior is not observed in plants under no water restriction. Two days after irrigation is resumed, and the soil is kept continuously at Ɵ = 43.31, plant electrical behavior of both plant sets is almost totally stabilized, probably indicating the end of plant water stress condition. In Figure 3.5b a power spectrum analysis of EP (Percival and Walden, 1993) shows a specific peak in frequency domain. This fundamental harmonic frequency is approximately 1 µHz, equivalent to a one-day period; the subsequent peaks correspond to an harmonic oscillation, associated to a signal distortion of the fundamental pattern, allowing us to infer that the stress – recovery mechanism during the circadian cycle varies as a function of water stress intensity, as the plant recovers from the water restriction previously imposed.. 26.
(40) Figure 3.5 (a) EP frequency associated to the circadian cycle for Prunus domestica, after removing the first-order-decomposition of the signal. (b) Spectral analysis for the period evaluated, Frequency 1 µHz, equivalent to one day.. Similarly to Prunus, Persea plants respond electrically to conditions of water restriction, with a systematic increment on its maximum and minimum daily EP values, as the substrate dries out (Figure 3.6). Maximum daily EP values increase from 14.56 mV to 52.5 mV, from the onset to the end of the water restriction period, respectively (Figure 3.6c); these EP values are detected at 6:50 pm (sd 1:54). EP minimum daily values, detected at 11:31 am (sd 2:16), range from 2.62 mV at the beginning of the non-irrigated period to 41.4 mV, just before the April 3 at 12:30 pm irrigation event. Maximum and minimum EP values increase 4.02 mVƟ-1 in conditions of water restriction.. 27.
(41) Figure 3.6 PE Evolution of Persea americana for two conditions of soil humidity. (a) radiation (W.m-2). (b) Temperature (°C). (c) Un-irrigated plants during 5 consecutive days. (d) Irrigated plants every 12 hours. Same period and treatment applied to Prunus domestica (see Figure 3).. A cyclic variation in EP maximum and minimum values is observed when the plants are maintained with constant Ɵ (Figure 6 d); the cycle is determined only by the variations of solar radiation and temperature (Figure 3.6 a). However, there is a clear influence of water restriction on Persea americana EP behavior, when irrigated 28.
(42) and not irrigated plants responses are compared (Figure 3.7). The periodical EP oscillation, corresponding to the twice daily watered plants (Figure 3.7, grey line), is kept under 20 mV, while a progressive EP increment, exceeding 40 mV, is measured in non-watered plants (black line).. Figure 3.7 First-order-decomposition of the PE variations for Persea americana for two conditions of soil water content: un-irrigated plants during 5 days (black line), and irrigated plants every 12 hours (grey line).. EP varies throughout the day, both under a twice daily irrigation schedule and also, when water supply is interrupted during several consecutive days. This EP behavior has been related to light and darkness cycles, as reported by Gurovich and Hermosilla (2009); plants present also an EP circadian cycle (Oyarce and Gurovich, 2010), showing regular EP value amplitude between consecutive days for both species (Figure 3.8), even under no water restriction. Maximum daily EP for Prunus (red line in Figure 3.8a) typically occurs at 11:05 am (sd 0:07), while for Persea (black line in Figure 3.8a) this maximum daily PE is 29.
(43) measured by late afternoon, at 7:21 pm (sd 0:22); This difference (ΔΦ, Figure 8b) between both species, shows a 7 to 9 hour magnitude.. Figure 3.8 (a) Mismatch of the Circadian cycles, represented by the electrical activity of the Prunus domestica (red line) and Persea americana (black line) plants under constant irrigation (every 12 hours). (b) Daily mismatch (ΔΦ) maximum PE through time.. EP behavior throughout the day is different in both species (Figure3.8). For Prunus, irrigation at mid-day does not affect the daily PE cycle; the maximum PE occurs before the irrigation event; for Persea, midday irrigation determines a change in the sequence of PE values, with a decrease occurring immediately after the irrigation event, and a further increase, until a maximum daily PE is reached by late afternoon. During the water restriction period, when the substrate dries out, EP behavior in both species is altered; the daily amplitude (difference between the maximum and minimum EP) in Prunus (Figure 3.3c), decreases from 13.21 mV to 8.48 mV, at the beginning of the non-irrigated period and before the irrigation restitution, respectively. 30.
(44) In the case of Persea (Figure 3.6c) EP amplitude variations throughout the day are not conclusive, as the increased EP differences are only present in the last 2 days of the period when plants are kept continuously without water supply. On April 3, just before irrigation is restored after the water restriction period, maximum and minimum PE values for Prunus occurs at the same time both for plants with and without water restriction (Figure 3.9a); for Persea, there is a significant difference in the maximum and minimum EP timing for irrigated and non-irrigated plants (Figure 3.9b). These inter-specific difference in the electrical behavior occurs every day throughout the experiment; thus, to adequately interpret EP measurements as indicators of early water stress, it is necessary to quantitatively consider these differences, correlating EP species behavior to other physiological indicators, like stomata conductance (Volkov, 2012).. Figure 3.9 Differences in EP circadian cycles, (a) Prunus domestica plants and (b) Persea americana plants, under two water availability conditions. In both figures, red line: drought treatment and blue line: no drought.. 31.
(45) 3.5 Discussion Both Prunus and Persea plants respond electrically to conditions of water restriction, with increased maximum and minimum potential daily values, throughout the period when water supply id restricted and the substrate progressively dries out due to evapotranspiration. Differential EP behavior, due to solar radiation and temperature variations, are also detected between this two species, suggesting a possible coordination, by means of electrical signals, among its different organ behavior (Volkov et al., 2007; Zimmermann et al., 2009). Plant adaptation to different water availability conditions, possibly is determining the magnitude and intensity of their physiological responses (Gurovich and Hermosilla, 2009; Oyarce and Gurovich, 2010). Our results indicate some differential EP behavior, both when plants are irrigated twice daily, and also when water supply is interrupted during several consecutive days; similar effect of alternate sunlight and darkness conditions upon EP behavior has been reported by Gurovich and Hermosilla (2009); Oyarce and Gurovich (2010), which also reported a circadian cycle. A “low frequency” analysis of EP data, for the first-order-decomposition of the signal shows a significantly higher electrical signal gradient for water restricted plants, as compared to irrigated plants; this differential behavior could be used as an early indicator of the water stress. However, this type of analysis must include data for time intervals larger than a single day, in order to determine if the variation of EP. 32.
(46) responses corresponds to an actual water stress, instead of to a different environmental factor. EP differential behavior reported in this work, both for Prunus and Persea, indicate that water stress in woody plants can be characterized by continuous increments of EP. Results from this study are similar to those published by Fromm and Fei (1998); Brenner et al. (2006); Gurovich and Hermosilla (2009); Oyarce and Gurovich (2010), providing experimental support to the hypothesis that real-time EP measurements can be used as early indicators of plant water status. However, intrinsic differences in phenotypic (foliar index area) and physiological (stomata conductance) characteristics of plant species determine the absolute magnitude of EP increments, under the same atmospheric evaporative demand (Gil et al., 2009; Egea et al., 2010). Therefore, specific models of electrical response are necessary for a precise interpretation of EP values as valid indicators of water stress in fruit-bearing trees.. 3.6 Conclusions Results. presented. in. this. work. indicate. the. possibility. to. use. plant. electrophysiological behavior to develop an agronomy sensor to measure plant water status in real-time, for its use on accurate irrigation scheduling of fruit trees, if an interpretation model on EP responses to water availability can be defined for different species.. 33.
(47) Using a low-frequency analysis on the electrical signal, it is feasible to separate the effects of environmental stimuli from the specific effect of water restriction in plant electrical response. Also, the use of an high-frequency signal analysis and its corresponding harmonious, can detect a temporary correlation of EP with the circadian cycle for each plant species, indicating that plant EP behavior is probably determined to a large extent by its morphological and physiological characteristics, interacting with its micro-environment. High and low frequency separation analysis enable us to quantify the effect of the substrate drying process through temporary variations of daily EP maximum and minimum values, by comparing similar measurements taken in non-water stressed plants. Also, during the recovery period, when irrigation is resumed, plant EP behavior indicates that there is an additional period of at least 3 days, on which previously non-irrigated plants still manifest a different electrical behavior, as compared to non-stressed plants, indicating that the process of water stress recovery can be a rather long period, lasting several days after full irrigation is resumed. We observed a differential EP circadian cycle behavior for both species: while micro-environmental or water availability modifications determine a time-shift on the cycle in Persea, the cycle is not altered in Prunus plants; physiological causes and implications of this differential behavior will become important in future studies. Acknowledgements Authors acknowledge the collaboration of Fondo de Innovación Agraria FIA, Ministry of Agriculture, Chile (project PYT 2011-0038) and The Wiseconn S. A. Company for its electronic and software support.. 34.
(48) 3.7 References Allen R, Pereira L, Raes D, Smith M. Crop evapotranspiration: guidelines for computing crop water requirements. FAO Irrigation and Drainage Paper 56, FAO, Rome, Italy, 1998; 299 pp. Baluška F, Mancuso S. Plant neurobiology: From stimulus perception to adaptive behavior of plants, via integrated chemical and electrical signaling. Plant Signal Behav 2009; 4: 475-76. Bose, J. C. The Nervous Mechanism of Plants. London, UK: Longmans, Green and Co, 1926; 123-34. Braam J. In touch: plant responses to mechanical stimuli. New Phytol 2005; 165: 373-89 Brenner E, Stahlberg R, Mancuso S, Vivanco J, Baluška F, Van Volkenburgh E. Plant neurobiology: an integrated view of plant signaling. Trends Plant Sci 2006; 8: 413-9. Burdon-Sanderson J. Note on the electrical phenomena which accompany irritation of the leaf of Dionaea muscipula. Proc R Soc Lond 1872; 21: 495-6. Cabral E, Pecora P, Céspedes A, Bruno A, Costa E. The oscillatory bioelectrical signal from plants explained by a simulated electrical model and tested using Lempel–Ziv complexity. Comput Electron Agr 2011; 76: 1-5. 35.
(49) Cosgrove D, Hedrich R. Stretch-activated chloride, potassium, and calcium channels coexisting in the plasma membranes of guard cells of Vicia faba L. Planta 1991; 186: 143-53. Darwin C. The Power of Movements in Plants. New York. D. Appleton and Co. 1896; 625 pp. Datta P, Palit P. Relationship between environmental factors and diurnal variation of bioelectric potentials of an intact jute plant. Curr Sci India 2004; 87: 680-3. Egea G, Verhoef M, González-Real A., Baille, P, Nortes P, Domingo R. Comparison of several approaches to modelling stomata conductance in well-watered and drought-stressed almond trees. 2010; ISHS Acta Horticulturae 922: XXVIII International Horticultural Congress on Science and Horticulture for People (IHC2010. Fromm J. Long-distance electrical signaling and its physiological functions in higher plants. In Plant Electrophysiology (ed. A.G. Volkov). Berlin Heidelberg. Springer-Verlag 2006; 269-85. Fromm J, Fei H. Electrical signaling and gas exchange in maize plants of drying soil. Plant Sci 1998; 132: 203-13 Fromm J, Lautner S. Electrical signals and their physiological significance in plants. Plant Cell Environ 2007; 30: 249-57. Fromm J, Spanswick R. Characteristics of action potentials in willow (Salix viminalis L). J Exp Bot 1993; 44: 1119-25. 36.
(50) Gensler W, Yan T. Investigation of the causative reactant of the apoplast electropotentials of plants. J Electrochem Soc 1998; 135: 2991-95. Gibert D, Le Mouel J, Lambs L, Nicolin F, Perrier F. Sap flow and daily electric potential variations in a tree trunk. Plant Sci 2006; 171: 572–84. Gil P, Gurovich L, Schaffer B. The electrical response of fruit trees to soil water availability and diurnal light-dark cycles. Plant Signal Behav 2008; 3: 1026-9. Gil P, Gurovich L, Schaffer B, García N, Iturriaga R. Electrical signaling, stomata conductance, ABA and ethylene content in avocado trees in response to root hypoxia. Plant Signal Behav 2009; 4: 100-8. Grams T, Koziolek C, Lautner S, Matyssek R, Fromm J. Distinct roles of electric and hydraulic signals on the reaction of leaf gas exchange upon re-irrigation in Zea mays L. Plant Cell Environ 2007; 30:79-84. Gurovich, L. Electrophysiology of woody plants. In: Electrophysiology - From Plants to Heart. 2012. Saeed Oraii (Ed.), Croatia: InTech Publishers, Gurovich L, Hermosilla P. Electric signaling in fruit trees in response to water applications and light–darkness conditions. J Plant Physiol 2009; 166: 290–300. Heil M, Ton J. Review. Long-distance signaling in plant defence. Trends Plant Sci 2008; 13: 264-72. Kai L, Xi G, Fan L, Meng X, Gao X, Liu Q. The changes of electrical signals in corn at different temperatures. Proc. 3rd International Conference on Environmental 37.
(51) Science and Information Application Technology (ESIAT 2011). In; Procedia Environmental Sciences. 2011; 10: 39-44. Berlin Heidelberg. Elsevier.. Available on line at "http://www.sciencedirect.com" Consulted 5 February 2014. Knight M, Campbell A, Smith S, Trewavas A. Transgenic plant aequorin reports the effects of touch and cold-shock and elicitors on cytoplasmic calcium. Nature 1991; 352: 524-6. Koziolek C, Grams T, Schreiber U, Matyssek R, Fromm J. Transient knockout of photosynthesis mediated by electrical signals. New Phytol 2003; 161: 715-22. Lautner S, Grams T, Matyssek R, Fromm J. Characteristics of electrical signals in poplar and responses in photosynthesis. Plant Physiol 2005; 138: 2200-9.. Lewalle J, Farge M, Schneider K. Wavelets transforms. Handbook on Experimental Fluid Mechanics 2007. Berlin Heidelberg: Springer Verlag. D.6.1: 147-149. Mancuso E. Hydraulic and electrical transmission of wound-induced signals in Vitis vinifera. Aust J Plant Physiol 1999; 6: 55-61. Mancuso E, Mugnai S. Long-distance signal transmission in trees. In: Baluška, F. Mancuso, S. Volkmann D. Communication in Plants. Berlin Heidelberg: Springer-Verlag, 2006. McClung C. Circadian rhythms in plants. Annu Rev Plant Physiol Plant Mol Biol 2001; 52:139-62.. 38.
(52) Mullendore D, Windt C, Van As H, Knoblaucha M. Sieve tube geometry in relation to phloem flow. Plant Cell 2010; 22: 579-93. Mwesigwa J, Collins D, Volkov A. Electrochemical signaling in green plants: effects of 2,4-dinitrophenol on variation and action potentials in soybean. Bioelectrochemistry 2000; 51: 201-05 Oyarce P, Gurovich L. Electrical signals in avocado trees. Responses to light and water availability conditions. Plant Signal Behav 2010; 5: 34-41. Oyarce P, Gurovich L. Evidence for the transmission of information through electric potentials in injured avocado trees. J Plant Physiol 2011; 168:103-8 Parimalan R, Giridhar P, Joel A, Jagadeesan S. Molecular basis of flower initiation A review. Indian J Biotechnol 2005; 4: 455-65. 2005; 4: 455-65. Pavlovic A, Mancuso S. Electrical signaling and photosynthesis: Can they co-exist together? Plant Signal Behav 2011; 6: 840-2. Percival D, Walden A. Spectral Analysis for Physical Applications. Cambridge University Press 1993. ISBN 0-521-35532X Pickard B. Action potentials in higher plants. The Botanical Review 1973; 39: 172201. Rodríguez-Gamir J, Ancillo G, González M, Primo-Millo E, Iglesias D, Fomer G. Root signaling and modulation of stomata closure in flooded citrus seedlings. Plant Physiol Biochem 2011; 49: 636-45. 39.
(53) Sadowsky J. Investigation of signal characteristics using the continuous wavelet transform. Johns Hopkins Apl. Technical Digest 1996; 17: 258-69. Schroeder J, Hedrich R. Involvement of ion channels and active transport in osmoregulation and signaling of higher plant cells. Trends Biochem Sci 1989; 14: 187-92. Shepherd, V. From semi-conductors to the rhythms of sensitive plants: the research of J.C. Bose. Cell Mol Biol 2005; 51: 607-19. Sibaoka T. Action potentials in plant organs. Symp Soc Exp Biol 1966; 20: 49-73. Stahlberg R, Cosgrove D. Comparison of electric and growth responses to excision in cucumber and pea seedlings. II. Long-distance effects are caused by the release of xylem pressure. Plant Cell Environ 1995; 18: 33-41. Stahlberg R, Cosgrove D. The propagation of slow wave potentials in pea epicotyls. Plant Physiol 1997; 13: 209-17. Stahlberg R, Cleland RE, Van Volkenburgh E. Decrement and amplification of slow wave potentials during their propagation in Helianthus annuus L. shoots. Planta 2005; 220: 550-8. Sukhov V, Nerush V, Orlova L, Vodeneev V. Simulation of action potential propagation in plants. J Theor Biol 2011; 291: 47-55.. 40.
(54) Trebacz K, Dziubinska H, Krol E. Electrical signals in long-distance communication in plants. In Communication in Plants – Neuronal Aspects of Plant Life (Baluška F, Mancuso S, and Volkmann D. Eds.) Berlin Heidelberg:Springer-Verlag; 2006. Van Bel A, Ehlers K. Electrical signaling via plasmodesmata. In Plasmodesmata (ed. KJ Oparka). Annual Plant Reviews. Oxford, UK:Blackwell Publishing 2005, 18: 26378. Volkov. A.. Plant. Electrophysiology.. Signaling. and. Responses.. Berlin. Heidelberg:Springer Verlag. 2012. Volkov A, Brown C. Electrochemistry of plant life. In: Electrochemistry Encyclopedia. http://electrochem.cwru.edu/ed/encycl/art-p01-plants.htm.. 2004.. Consulted:. September 2012. Volkov A, Haack R. Insect induces bioelectrochemical signals in potato plants. Bioelectrochem Bioenerg 1995; 35: 55-35. Volkov A, Ranatunga R. Plants as environmental biosensors. Plant Signal Behav 2006; 1: 105-15. Volkov A, Carrell H, Markin V. Biologically closed electrical circuits in Venus flytrap.. Plant Physiol 2009; 149: 1661-7. Volkov A, Lang L, Volkova-Gugeshashvili M. Electrical signaling in Aloe vera induced by localized thermal stress. Bioelectrochemistry 2007; 71: 192-7. Volkov A, Waite A, Wooten J, Markin V. Circadian rhythms in biologically closed electrical circuits of plants. Plant Signal Behav 2012; 168: 1753-60. 41.
(55) Wagner E, Lehner L, Normann J, Veit J, Albrechtova J. Hydro-electrochemical integration of the higher plant – basis for electrogenic flower initiation. In: Communication in Plants: Neuronal Aspects of Plant Life (Baluška, F. ed). Berlin Heidelberg; Springer – Verlag, 2006. Wagner E, Lehner L, Veit J, Normann J, Albrechtová J. Biosystems analysis of plant development. concerning. electrochemical. signal. photoperiodic transduction.. flower. Plant. Induction. by. hydro-. Electrophysiology.. Berlin. Heidelberg: Springer Verlag, 2012. Wang Z, Leng Q, Huang L, Zhao L, Xu Z, Hou R, Wan C. Monitoring system for electrical signals in plants in the greenhouse and its applications. Biosyst Eng 2009; 3: 1-11. Webb A. The physiology of circadian rhythms in Plants. New Phytol 2003; 160: 281303. Yan X, Wang Z, Huang L, Wang C, Hou R, Xu Z, Qiao X. Review: Research progress on electrical signals in higher plants. Prog Nat Sci 2009; 19: 531-41. Zimmermann M, Maischak H, Mithofer A. Boland W. Felle H. System potentials, a novel electrical long-distance apoplastic signal in plants induced by wounding. Plant Physiol 2009; 149: 1593-1600.. 42.
(56) Chapter 4. Use of plant woody species electrical potential for irrigation scheduling 1Liliana. Ríos-Rojas, 1David Morales-Moraga, 1Luis A. Gurovich, José A. Alcalde 1Pontificia. Universidad Católica de Chile. Submitted for publication to Plant Signaling and Behavior Journal (July 2014).. 43.
(57) 4.1 Abstract The electrical response of plants to environmental stimuli can be measured and quantitatively related to the intensity of several stimulating sources, like temperature, solar radiation, soil water content, evapotranspiration rates, sap flow and dendrometric cycles. These relations can be used to assess the influence of different environmental situations on soil water availability to plants, defined as a steady state condition between leaf transpirative flow and soil water flow to plant roots. A restricted soil water flow due to soil dryness can trigger water stress in plants, if the atmospheric evaporative demand is high, causing partial stomata closure as a physiological response to avoid plant dehydration; water stressed and unstressed plants manifest a differential electrical response. Real time plant electrical response measurements can anticipate actions that prevent the plant reaching actual stress conditions, optimizing stomata gas exchange and photosynthetic rates. An electrophysiological sensor developed in this work, allows remote real-time recording information on plant electrical potential (EP) in the field, which is highly related to EP measurements obtained with a laboratory Keithley multivoltmeter sensor used in an highly controlled experimental setup. Our electrophysiological sensor is a wireless, autonomous devise, which transmits EP information via Internet to a data server. Using both types of sensors (EP electrodes with a Keithley multivoltmeter and the electrophysiological sensor), we measured in real time the. 44.
(58) electrical responses of Persea americana and Prunus domestica plants, to induced water deficits. The differential response for two scenarios: irrigation and water restriction is identified by a progressive change in slope on the daily maximal and minimal electric signal values in stressed plants, and a zero-slope for similar signals for well-watered plants. Results show a correspondence between measured signals obtained by our electrophysiological sensor and the EP electrodes connected to the Keithley multivoltmeter in each irrigation stage. Also, both sensors show a daily cyclical signal (circadian cycle). Abbreviations A, CO2 assimilation, (µmolm-2s-1); EP, electric Potential (mV); Gs, stomatal conductance (Wm-2s-1); FFT; Fast Fourier Transform; CI, Confidence interval. Keywords Electrophysiological sensor, Keithley multivoltmeter, Circadian cycle, Electrical potential, Persea americana, Prunus domestica, plant water availability.. 4.2 Introduction Different researchers agree that the generation and transmission of electrical signals in plants is related to the need to respond to environmental stressors, as an adaptive process to prevent dehydration (Fromm and Lautner, 2007; Sukhov et al., 2011; Volkov, 2012; Gurovich, 2012), based on experimental evidences to different stimuli 45.
Figure

+7


Documento similar
No obstante, como esta enfermedad afecta a cada persona de manera diferente, no todas las opciones de cuidado y tratamiento pueden ser apropiadas para cada individuo.. La forma
Díaz Soto has raised the point about banning religious garb in the ―public space.‖ He states, ―for example, in most Spanish public Universities, there is a Catholic chapel
Our results here also indicate that the orders of integration are higher than 1 but smaller than 2 and thus, the standard approach of taking first differences does not lead to
It is generally believed the recitation of the seven or the ten reciters of the first, second and third century of Islam are valid and the Muslims are allowed to adopt either of
ABSTRACT Transformation of the Specialized Knowledge of Future Primary Teachers on Fraction Division
From the phenomenology associated with contexts (C.1), for the statement of task T 1.1 , the future teachers use their knowledge of situations of the personal
In the preparation of this report, the Venice Commission has relied on the comments of its rapporteurs; its recently adopted Report on Respect for Democracy, Human Rights and the Rule
H I is the incident wave height, T z is the mean wave period, Ir is the Iribarren number or surf similarity parameter, h is the water depth at the toe of the structure, Ru is the
This paper presents the design of a component library for modelling hydropower plants, and describes the development of a new simulation tool for small hydropower plants with
