Different worlds, common roots a multilevel analysis of youth violence and delinquency in the netherlands antilles as a basis for crime prevention
21
0
0
Texto completo
(2)
(3) WELL-BEING AND SOCIAL POLICY VOL 6, NUM. 2, pp. 25-43. DIFFERENT WORLDS, COMMON ROOTS A MULTILEVELANALYSIS OF YOUTH VIOLENCE AND DELINQUENCY IN THE NETHERLANDS ANTILLES AS A BASIS FOR CRIME PREVENTION* Harrie Jonkman Department of Clinical Psychology, VII University of Amsterdam [email protected] [email protected]. Pim Cuijpers Department of Clinical Psychology, VU University of Amsterdam p.cuijpers @psy.vu.n1. Jos Twisk Department of Clinical Epidemiology and Applied Biostatistics, VU University of Amsterdam [email protected]. Abstract. M. ost research on the prevalence, determinants, and variations of violence and delinquency among youngsters is conducted in Western societies. This multilevel study is set in the Netherlands Antilles (NA) and aims to build up prognostic multilevel models as a basis for targeted crime prevention in a non-western area. Data were collected from a sample of adolescente in the NA. Non-hierarchical and hierarchical analyses were used to investigate similarities and differences between individuals (n=7,842), neighborhoods (N=109), and islands (J=5) in the NA. Descriptive analyses of violence and delinquency are included. Associations and correlations with demographic variables, risk factors and protective factors and the variation on neighborhood and island level are analyzed. Subsequently, prognostic multilevel models are constructed of violence and delinquency among youngsters, by using different variables (socio-demographic factors, risk factors, and protective factors) nested. " Correspondence to: H. Jonkman, Department of Clinical Psychology, VU University of Amsterdam Van der Boechorststraat 1, 1081 BT Amsterdam, The Netherlands, tel. 1-31205988757(secr), or Verwey-Jonker Institute, Kromme Nieuwegracht 6, 3512 HG Utrecht, The Netherlands, +31202300799. Acknowledgements: We are indebted to all study participante in the Netherlands Antilles, the Netherlands Youth Institute (Utrecht, Netherlands), and to DSP-Group (Amsterdam, Netherlands).. 25.
(4) DIFFERENT WORLDS, COMMON ROOTS A MULTILEVEL ANALYSIS OF YOUTH VIOLENCE AND DELINQUENCY IN THE NETHERLANDS ANTILLES AS A BASIS FOR CRIME PREVENTION. within different contexts (neighborhood and island) in the Netherlands Antilles. Risk and protective factors are also strong predictors of violence and delinquency among youngsters in this part of the non-western world. These factors should constitute important strategic targets for social policy and crime prevention. Key words: Violence, delinquency, prevention, risk and protective factors, Netherlands Antilles. JEL classification: 118.. Introduction. D. redictors of problem behaviors are important strategic targets for the prevention of these behaviors (Coie, et al. 1993, Hawkins, Catalano, and Miller 1992). Longitudinal and epidemiological studies have identified important risk and protective factors which are correlated with problems during adolescence, such as violence and delinquency (Loeber and Farrington 2001, Loeber, Slot and Sergeant 2001, Loeber, et al. 2008). Insights into the prevalence and determinants of problem behavior should be the starting point for social policy. Social investment should be legitimated by sound social diagnosis (Offord, et al. 1999). By targeting these predictors a start can be made in restoring safe and healthy environments and, ultimately, reducing the influx of new cases of specific problem behavior. To inform and rationalize the preventive interventions we need not only insights into the prevalence of problem behavior but also into causes and correlates of different kinds of problem behaviors in different contexts. Theoretical and empirical insights into risk and protective variables of individual respondents and their direct environments like families, schools, friends, and neighborhoods (or other arcas) make this preventive work possible. Most research on the prevalence, social determinants, and prevention of problem behavior in youngsters is conducted in western world settings. Although it is clear that there is a lot to leam about problem behaviors and their determinants in different cultures, far less work is done on mental health research in other parts of the world (Bayar and Sayil 2005, Karstedt 2001, Keating and Hertzman 1999, Kloep, et al. 2009, Vazsonyi, et al. 2008). In 2006 a study on various problem behaviors in youngsters and the determinants of these behaviors was conducted among the youth of the Netherlands Antilles (NA). This was done at the request of the Government of the Netherlands Antilles. The emotional, mental, and behavioral problems of youngsters in this Caribbean area are considerable and include school drop-out, depression and sexuality related problem behavior. But also anti-social behavior, delinquency, and violence of youngsters are a social problem in this area, often drugs related. The age of first offenders is decreasing and misdemeanors become more serious. 36% of the population in prison is younger than 24 years (Centraal Bureau voor de Statistiek NA 2001, 2003, and 2004). For years the government of the Netherlands Antilles had already taken various measures to address these social problems. The problems undermine the health of the youngsters themselves and the people around them as well as the well-being of society in general. At the same time the government was also searching for a more socio-political solution. What could be done to tackle the problems atan early stage; how can more strategic targets for social policy be developed; what are the differences between the young individuals concerned and what are the differences between the various neighborhoods and islands in the NA? The scientific literature on this topic provides some evidence that the neighborhoods and regions play a role in the development of problem behavior (Wilson. 26.
(5) WELL-BEING AND SOCIAL POLICY VOL 6, NUM. 2, pp. 25-43. 1987, Sampson, Raudenbusch and Earls 1997, Furstenberg 1999, Duncan and Raudenbusch 1998, Leventhaln and Brooks-Gunn 2000, Kawachi and Berkman 2003). In this article the impact of predictors on violence and delinquency in a non-western part of the world are examined in a large sample of a general population of youngsters in the Netherlands Antilles. This kind of research may also be important for regional public health in non-western countries. We sought to address gaps in earlier studies by examining the prevalence and predictors of violence and delinquency in youngsters aged between 13 and 18 years and we looked for variation in the contexts of the five islands and 109 neighborhoods. We also researched the correlates and causes of violence and delinquency in a more comprehensive perspective. With the use of various groups of factors (socio-demographic variables, risk factors, and protective factors) violence and delinquency are analyzed on three different levels (individual level, neighborhood level, and island level). We asked ourselves: What are the best multilevel/hierarchical models for violence and delinquency with demographic covariates, reliable risk factors, and protective factors on individual—as well as on neighborhood—and island level and what is the predictive power? And ultimateiy, what are the potential uses of the models to develop strategic targets for social policy and crime prevention?. 1. Methods 1.1 Participants The Netherlands Antilles has a population of 24,180 youngsters in the 11 to 19 age group.(Centraal Bureau voor de Statistiek NA 2001) The 37 schools which participated in this research have a population of 11,054 youngsters spread over 481 classes (Boer and Roorda 2006). 10,117 questionnaires were distributed. There was a response rate of 87% (n=8,761). 12-year oíd age group is relatively small in secondary schools in the Antilles (see Table 1). Many of the children stay or have to stay longer at primary school (23.9% of primary school children are in the 13 to 15 age group). We decided to take the group of 12-year olds out of the sample. Likewise, the group of 19-year oíd students was far too small to be representative. Accordingly, we restricted the sample to the 13 to 18 year oíd students. Ultimately, the total sample comprised 7,842 youngsters living on five islands of the Netherlands Antilles and participating in schools. The vast majority of these live on Curacao (5,937; 76%), as Table 2 shows. The others live on Bonaire (540; 7%), Sint (St) Maarten (1,154; 15%), Sint (St) Eustatius (137; 2%), and Saba (74; 1%). The spread of youngsters over the five islands in this dataset is the same as the Census data (Centraal Bureau voor de Statistiek NA 2001). The youngsters are students from 37 schools (with a minimum of 52 students and a maximum of 540 students). 26 schools are located on Curacao, 6 on St Maarten, and one school on each of the other three islands (Bonaire, St Eustatius, and Saba).1 The following schools participated in this research: On Curacao: Albert Schweitzer Parera, Ancilla Domini, Dr. A. Schweitzer, Kolegio Erasmo, Gouv. Lauffer School, Ignatius College, Maria College, Maris Stella, Marnix Cas Cora, Marnix Mayo, Mgr. Zwijssen, Pierre Lauffer School, Regina Pacis, Scholengemeenschap Parera,. 27.
(6) DIFFERENT WORLDS, COMMON ROOTS A MULTILEVEL ANALYSIS OF YOUTH VIOLENCE AND DELINQUENCY IN THE NETHERLANDS ANTILLES AS A BASIS FOR CRIME PREVENTION Table 1 Youth in Education St. Eustat.. Bonaire Curacao Saba. Neth. St. Maarten Antilles. 2001. 2001. 2001. 2001. 2001. 2001. 13-15 year old in primary school, %. 14.3. 24.5. 15.2. 20.2. 25.3. 23.9. Participation in education of 6-14 year old, %. 99.5. 99.6. 100. 99.7. 98.4. 99.4. Participation in education of 15-17 year old, %. 82.1. 90.5. 86.2. 88.1. 80.2. 88.8. 46.3. 23.5. 44.8. 39.3. 44.2. 43.5 School drop-out rate 15-24 year old, % Source: Centraal Bureau voor de Statistiek NA 2001.. Table 2 Dataset Used Island. Curacao. N Percentage Boy Girl 13 14 15 16 17 18. 76. 5,937. 46. 54. 19. 17. 16. 11. 20. 25. 21. 15. 4 9. 7. 46. 1,154. 15. 44. 56. 32. 14. 17. 19. 9. 137. 2. 50. 50. 25. 28. 23. 6. 15. 3. Saba. 74. 1. 50. 50. 15. 28. 22. 19. 9. 7. Total. 7,842. 100. 46. 54. 20. 18. 20. 18. 15. 10. St. Maarten St. Eustatius. 14. 18. 540. Bonaire. 54. 18. 1.2 Instrument and measures The research instrument used for this research is adapted from the Communities that Care Youth survey (Pollard, Hawkins and Arthur 1999, Arthur, et al. 2006, Glaser, et al. 2005). The survey was developed from the 1990s onward, to measure problem behavior in youngsters aged 11 to 18 years and their risk and protective factors. It can be conducted relatively easily in schools. With this instrument the quality of the social domains in which youngsters grow up (family, school, friends,. Scholengemeenschap Joseph Civilis, SGO Goslinga, SGO Jacques Ferandi, Sint Martinus Mayo, Stella Maris College, Triniteit College, Sint Jozef, Juan Pablo Duarte, Sint Paulus, Peter Stuyvesant College, Maria Imaculata Lyceum, Radulphus College, International School, Vespucci College, Abel Tasman. The schools of Sint Maarten which participated: St. Dominic High school, St. Maarten Academy, Sundial, Sint Maarten Vocational, Milton Peters College, Private School; In Bonaire: Scholengemeenschap Bonaire participated, in Sint Eustatius: Gwendolyn van Putten School, and in Saba: Saba Comprehensive school.. 28.
(7) WELL-BEING AND SOCIAL POLICY VOL 6, NUM. 2, pp. 25-43. and communities) can be measured. In addition, profiles of cities, communities, neighborhoods, or other areas can be created and compared with each other. This instrument was tested among groups with different socio-economic backgrounds (Glaser, et al. 2005). In recent years the survey was also performed and tested in various other countries like Australia, Canada, Great Britain, and the Netherlands (Jonkman, et al. 2006).. 1.3 Procedure Because of the variety of languages on the different islands three versions of the school survey were compiled at the start of this research. The Dutch version of the questionnaire constituted the starting point but some questions had to be adapted toward the situation in the Netherlands Antilles (e.g. there are differences between school types in the Netherlands compared to the Netherlands Antilles). Besides a new Dutch version, versions in the local language of Papiamentu and English were also compiled. The school survey was first tried out in two schools on two islands (Curacao and St Maarten, total sample size = 173). The reliability of various scales was too low and these were again adapted. The new version was then tried out among ten students. The definitive version was conducted among all the students of the secondary schools of the five islands in the Netherlands Antilles. The organization of the fieldwork was the responsibility of the NA Central Bureau of Statistics. The fieldwork started in February 2006 and continued during the following half year. Contact was made with individual schools and school boards. They were officially invited to participate in the research. Researchers on the various islands were given information about the project and how the work should be done in the schools. The interest and cooperation from the schools was very positive. AH 37 secondary schools of the Netherlands Antilles participated in this research.. 1.4 Risk factors and protective factors Risk factors (as approximations of causes) and protective factors (as positive factors for pro-social behavior and buffers against the impact of risk factors) are associated with domains in which youngsters grow up: family, school, friends, and communities (Loeber, et al. 2008). In this article we use only the factors which also demonstrated high reliability in this non-western crea (Cronbach's alpha .70 or higher). Six risk factors are expected to be related to a higher level of problem behavior in this dataset. For the risk factors in the domain family we used 1). 'History of problem behavior': Are the children growing up in a family in which there is a history of criminal behavior, alcohol, or drug use? (4 items, alpha .76); 2). `Problems with family management': Does the family have problems with setting rules, controlling and supporting children? (8 items, alpha .73); For the domain school we used 3). `Lack of bonding with school': Do they feel themselves committed to the school? (5 items, alpha .70); For the domain friends we use three scales: 4). Positive attitude toward anti-social behavior': Do they express positive attitudes toward violence and delinquency? (5 items, alpha .72); 5). `Friends who show anti-social behavior': Are they associated with friends. 29.
(8) DIFFERENT WORLDS, COMMON ROOTS A MULTILEVEL ANALYSIS OF YOUTH VIOLENCE AND DELINOUENCY IN THE NETHERLANDS ANTILLES AS A BASIS FOR CRIME PREVENTION. who engage in violence or delinquency (6 items, alpha .80); For the domain community one scale is used: 6). `Lack of organization in the community': Does the community have a high population density, physical deterioration, and high level of adult crime? (5 items, alpha .81). We also used two protective factors, which are expected to have a lowering influence on problem behavior. These are both part of the domain family: 1). Sonding with family': Do they feel a strong emotional attachment to their parents or legal guardians? (5 items, alpha .72); and 2). `Possibilities for positive involvement': Do they have opportunities for involvement in pro-social activities (3 items, alpha .72). For our analyses we dichotomized the predictors (risk factors and protective factors). Although we know that with this binary technique we lose information, logistic regression analysis gives us the opportunity to interpret the results easily and, ultimately, we can present the cumulative effects of important underlying factors for a broader audience. Students got a 'yes' on the six risk factors and two protective factors when they scored higher than the median, a 'no' when they scored lower than the median (Arthur, et al. 2006).. 1.5 Outcomes: violence, delinquency For this article we analyzed two correlated outcomes: violence and youth delinquency. The two problem behaviors were researched on a last-year basic. Violence: Violence is defined as all acts which lead or eould lead to physical injury. Threatening with physical violence is also part of this problem behavior. Violence is often divided into offences with deadly or physical injury, criminal offenses against life, maltreatment, threatening, raid, extortion, and sexual offenses.(Jonkman, et al. 2006, Elliott and Tolan 1999, Junger-Tas, Steketee and Moll 2008) Violence is researched by four questions regarding last year events: 1). Did you carry a weapon (weapons)?; 2). Were you involved in fighting (fighting)?; 3). Did you hit someone with the intention of hurting (hitting)?; 4). Did you threaten someone to get money (assault)? Youth delinquency: Youth delinquency is a generic term covering various punishable acts by youngsters. Besides violent offenses, crimes against property, arson, and destruction are also part of youth delinquency.(Jonkman, et al. 2006, Elliott and Tolan 1999, Junger-Tas, Steketee and Moll 2008) We asked five questions regarding delinquency: 1). Did you intentionally destroy anything on the street (vandalism)'); 2) Did you steal anything from a shop (theft shops)?; 3). Did you steal anything from school, e.g. from another student (theft schools)?; 4). Did you sell stolen items to someone else, e.g. to another student (selling stolen items)?; 5). Were you arrested by the police (contact with police)? For these analyses we used binary data for violence and delinquency. Students scored a `yes' on one of these problem behaviors when they answered yes to one or more of their items. They got a `no' when they were involved in none of the items.. 30.
(9) WELL-BEING AND SOCIAL POLICY VOL 6, NUM. 2, pp. 25-43. 1.6 Data-analyses Two sets of analyses were conducted to address our research questions. In the first descriptive part, prevalence of violence and delinquency were studied on the basis of the percentage of students engaged in these problem behaviors and the level of significance for the different items. We looked for the total amount for the NA, but also for socio-demographic differences by age, gender and school type. We examined the relationship between violence and delinquency on the one hand and three demographic factors (gender, age, school type), six risk factors (History of problem behavior, Problems with family management, Lack of bonding with school, Positive attitudes toward anti-social behavior, Friends who show anti-social behavior, Lack of organization in the community), and two protective factors (Bonding with family, Possibilities for positive involvement) on the other hand. In this part we also researched the variations of violence and delinquency between the different islands and different neighborhoods. For the constructing of neighborhoods we used the administrative boundaries of census block-groups from the Antilles with their own Zip-code (Centraal Bureau voor de Statistiek NA 2001). We used only neighborhoods for which we have data from 20 or more youngsters. For this purpose we could make use of the data of 109 communities (with a minimum of 20 students and a maximum of 326). We conducted the first pan of the statistical analyses using Stata, version 10 (Rabe-Hesketh and Everitt 2007, Kohler and Kreuter 2008). Because of the clustered character of our data we employed hierarchical modeling, using MLWin 2.20 (Rabash et al. 2005). For this second set of the analyses we used multilevel analysis to develop the best and most simple prognostic model for violence and delinquency. We account for the clustering effects of the sampled youngsters within neighborhoods and islands and create a model for the relationships between individuals, neighborhoods and islands and the predictor variables. We start with two and three level intercept models for violence and delinquency. First a group of socio-demographic variables are moved forward, followed by another group of predictors (risk factors and protective factors). Fixed influences and variance components are researched within the prognostic models. The two hierarchical models proposed are the two best possible models for violence and delinquency. We researched the potentials of the models by using a number of indicators.. 2. Results 2.1 Descriptive statistics Youngsters in the NA score particularly highly on fighting and hitting (see Table 3). When we put the items in total scores we see that 44% of Antillean youngsters engage in one or more forms of violence and 18% in one or more forms of delinquency.. 31.
(10) DIFFERENT WORLDS, COMMON ROOTS A MULTILEVEL ANALYSIS OF YOUTH VIOLENCE AND DELINQUENCY IN THE NETHERLANDS ANTILLES AS A BASIS FOR CRIME PREVENTION Table 3 Prevalence of Violence and Delinquency in the Netherlands Antilles Total. Curacao. Bonaire. St. Maarten. St. Eustatius. Saba. 0.12. 0.12. 0.10. 0.14. 0.16. 0.27. 0.28. 0.28. 0.25. 0.31. 0.45. 0.45. 0.54. 0.53. Violence Weapons Fighting Hitting. 0.27. 0.24. 0.24. 0.39. Assault. 0.05. 0.03. 0.03. 0.13. 0.11. 0.19. Violence total. 0.44. 0.39. 0.44. 0.53. 0.64. 0.69. Vandalism. 0.15. 0.14. 0.17. 0.17. 0.26. 0.35. Theft shops. 0.10. 0.06. 0.12. 0.23. 0.34. 0.44. Delinquency. Theft school. 0.08. 0.06. 0.09. 0.13. 0.23. 0.19. Selling stolen items. 0.04. 0.03. 0.02. 0.09. 0.05. 0.11. 0.04. 0.04. 0.08. 0.04. 0.14. 0.10. 0.18. 0.14. 0.22. 0.32. 0.43. 0.50. Contact with pollee Delinquency total. Boys show nearly two times more violence (55% to 32%) and delinquency (23.7% to 12.9%) than girls (as Table 4 shows). Violence increases slowly over the years. Delinquency is highest among 15, 16, and 17 year olds. Violence is higher on lower school types and for delinquency there is hardly difference. Table 4 Violence and Delinquency by Gender, School Type, and Age Violence (%). Delinquency (%). Male. 55.0. 23.7. Female. 32.0. 12.9 21.4. 12 years. 37.8. 13 years. 37.8. 12.4. 14 years. 43.1. 15.4. 15 years. 42.9. 19.3. 16 years. 43.1. 19.6. 17 years. 43.5. 21.1. 18 years. 45.0. 19.7. School type high. 31.9. 17.7. School type low. 44.3. 18 5. 32.
(11) WELL-BEING AND SOCIAL POLICY VOL 6, NUM. 2, pp. 25-43. We also looked for the estimated odds between violence and delinquency and different determinants (Risks and Protection, see Table 5). Table 5 Estimated Odds between Violence and Delinquency and Determinants Determinants. Violence. Delinquency. Risks History of problem behavior. 2.08(1.89/2.29). 2.01(1.79/2.26). Problems with family management. 1.71(1.56/1.89). 1.99(1.76/2.24). Lack of bonding with school. 1.95(1.78/2.13). 2.51(2.22/2.83). Positive altitudes toward anti-social behavior. 2.18(1.97/2.42). 3.06(2.71/3.45). Friends who show anti-social behavior. 5.71(4.98/6.54). 5.33(4.66/6.09). Lack of organization in the community. 1.90(1.74/2.09). 1.78(1.58/2.00). Bonding with family. 0.71(0.59/0.85). 0.51(0.42/0.63). Possibilities for positive involvement. 0.65(0.54/0.79). 0.55(0.44/0.69). Protection. The risk factor `Friends who show anti-social behavior' is particularly high for violence (OR: 5.71). But also Positive attitudes toward anti-social behavior' (OR: 2.18) and 'History of problem behavior in the family' (OR: 2.08) are high correlating risk factors. The two protective factors lower the chance of violence. Possibilities for positive involvement' lowers the violence rate (OR: 0.65) as does Sonding with family' (OR: 0.71). Overall we see the same trend for delinquency. For delinquency school type isn't a significant predictor. In general there is a higher correlation between risk factors and outcome than is the case for violence. Here too, `Friends who show anti-social behavior' (OR: 5.33) is the highest correlating risk factor. Both protective factors are negatively correlated with delinquency. We subsequently looked at the variation of violence and delinquency between the five islands. The scores for violence are overall higher in St Maarten, St Eustatius, and Saba (three northern islands) than in Curacao and Bonaire. For delinquency we also see higher levels on the Windward Islands (St Maarten, St Eustatius, and Saba) than on Leeward Islands (Curacao and Bonaire). We also looked at prevalence variation between 109 neighborhoods. We see significant differences between the prevalence of violence and delinquency in the neighborhoods. Figure 1 shows that the percentage of violence among youngsters in communities of the Netherlands Antilles ranges from 20% (community with the lowest level) to 74% (highest level). For delinquency this is between 4% and 55%, as Figure 2 shows.. 33.
(12) DIFFERENT WORLDS, COMMON ROOTS A MULTILEVEL ANALYSIS OF YOUTH VIOLENCE AND DELINQUENCY IN THE NETHERLANDS ANTILLES AS A BASIS FOR CRIME PREVENTION Figure 1 Violence in Different Neighborhoods in Netherlands Antilles 90 80 70 60 50 40 30 20 10. Figure 2 Delinquency in Different Neighborhoods in Netherlands Antilles 80 70 60 50 40 30 20 10 O N73'-.1Z °>z15.. .55tru west groot sint joris /(we. E. ro. 1> 1 O 34.
(13) WELL-BEING ANO SOCIAL POLICY VOL 6, NUM. 2, pp. 25-43. 2.2 Hierarchical model building After identifying important predictors of violence and delinquency and determining significant variation of prevalence between environments (islands, neighborhoods) we added the second part of the information to a multilevel analysis of this sample (Rabash, et al. 2005, Raudenbusch and Bryk 2002, Snijders and Bosker 1999, Luke 2004, Bickel 2006, Twisk 2006, Rabe-Hesketh and Skondal 2008, Gellman and Hill 2007). In this part we are especially interested in constructing prognostic models which may form the basis for targeting preventive policy in this non-western area. With the use of hierarchically clustered covariates (individual, neighborhood, and islands) we constructed predictive models for violence as well as for delinquency. We started with an intercept random model on neighborhood level (Model A). Because we use logistic regression we cannot use the Wald test on variance parameters. If the magnitude of the variance is more than two times higher than the standard error we have to consider the random intercept (Twisk 2006). Model B incorporates the influence of the island level. In our case we propose a three level model for violence and delinquency. Level 1 scores (individuals) can vary across level 2 (neighborhoods), and level 3 (islands). After this we put socio-demographic variables in the intercept models: gender, age, and school type (Model C). In Model D we added the significant risk factors and the protective factors. We also tried out a slope model for violence and delinquency. The results here, however, were no longer significant (for violence or delinquency). The results of the different models are summarized in Table 6 (for violence), and Table 7 (for delinquency). The last model is the best prognostic model for each of the two problem behaviors (Model D for Violence and Delinquency).. 2.2.1 Violence Table 6 Multilevel Analysis for the Effects of Risk and Protective Factors on Violence Model A. Model B (SE). Coef.. (SE). Coef.. -0.335. (0.028). -0.139. (0.091). 0.132. (0.050). 0.560. (0.024). Fixed part. Intercept Random part. Vok (island) Uojk (neighborhood). 0.159. 35. (0.032).
(14) DIFFERENT WORLDS, COMMON ROOTS A MULTILEVEL ANALYSIS OF YOUTH VIOLENCE AND DELINCIUENCY IN THE NETHERLANDS ANTILLES AS A BASIS FOR CRIME PREVENTION. Table 6 (continued) Model D. Model C. :4. Coef.. (SE). Coef.. (SE). -0.366. (0.102). -0.196. (0.153). Gender (ref=boys). -0.954. (0.048). -0.880. (0.053). Age (rel3 years). 0.034. (0.017). -0.042. (0.018). 1.00%. School type (ref=high). -0.408. (0.087). -0.452. (0.090). 11.00%. 0.612. (0.055). 15.00%. Fixed part. Intercept Demographics. 22.00%. Risks Fam: History of problem behavior Fam: Problems with fam. management. 0.032. (0.055) ns. School: Lack of bonding. 0.270. (0.054). 6.75%. Peers: Positive attitude toward anti-social behavior. 0.590. (0.063). 14.75%. Peers: Friends who show anti-social behavior. 1.120. (0.067). 28.00%. Community: Lack of organization. 0.363. (0.053). 0.010 -0.346. (0.120) ns (0.125). Protection Fam: Bonding with family Fam: Possibilities for positive involvement. 8.65%. Random part. Vok (island). 0.130. (0.050). 0.034. (0.017). 0.85%. Uojk (neighborhood). 0.046. (0.024). 0.058. (0.028). 1.45%. Note: ns: not significant.. For violence we propose Model D: intercepts on neighborhood and island levet, three demographic covariates (gender, age, school type), five risk factors (History of problem behavior (family); Lack of bonding (school); Positive attitude toward anti-social behavior (friends); Friends who show anti-social behavior (friends); Lack of organization (community) and one protective factor (Pos sibilities for positive involvement (family). Boys show significantly more violence than girls, older youngsters demonstrate more violence than younger ones, and youngsters in lower types of secondary school exhibit more violence than youngsters in higher types of secondary schools. With the exception of Problems with Family Management, all the other risk factors are significantly related to violence, likewise within the clustered character of the data: the higher the risk factor the higher the chance of engaging in violent behavior. In particular the risk factor Friends who show anti-social behavior is a strong predictor (OR: 3.06; CI 95%: 2.93-3.19), here adjusted for the other variables. There is one significant. 36.
(15) WELL-BEING AND SOCIAL POLICY VOL 6, NUM. 2, pp. 25-43. protective factor (Possibilities for positive involvement (family): this protective factor lowers the prevalence of violence (OR: 0.71; CI 95%: 0.47-0.95). Differences remain, although small, between islands and between neighborhoods. We used two additional indicators to estimate the potential of the predictive model. In Table 6 we added a 'divide by 4' column (Gelman and Hill 2007, p. 82). These percentages give the maximum possible difference made by the factor to violence, which is important knowledge for preventive science. Investing, for example, on the risk factor Friends who show anti-social behavior (the risk factor with the strongest correlation with violence) can make a maximum difference of 28% to anti-social behavior. In this second part of the article we are especially interested in the question: what is the best strategy to lower violence among youngsters in the Netherlands Antilles. Now that we know the important fixed variables and the variance components we can use the prediction possibilities of the best statistical model. We can predict the probability of youngsters becoming violent when we know their gender, age, school type, and when we know their risk and protective factors. Thus we can estimate the chance for a youngster growing up in a `bad neighborhood' on one of the northern islands to become violent. When the youngster is a boy, is older, attends a lower school type, grows up with risk factors in his family, school, his friends, and community, the likelihood that he will become violent is 94.7%. If it is a girl and she is younger and attends a higher school type, grows up without risk factors in the different domains of development, has possibilities for positive involvement in the family and grows up in the better communities of the southem islands the probability that she will become violent is 7.9%. For all the different possibilities we can estimate these changes now we know the best model. This is the second additional indicator to check the power of this predictive model.. 2.2.2 Delinquency Table 7 Multilevel Analysis for the Effects of Risk and Protective Factors on Deliquency Model A Coef. (SE). Model B Coef. (SE). -1.736. (0.040). -1.337. (0.154). 0.412. (0.145). 0.424. (0.065). 0.086. (0.039). Fixed part. Intercept Random part. Vok (island) Uojk (neighborhood). 37.
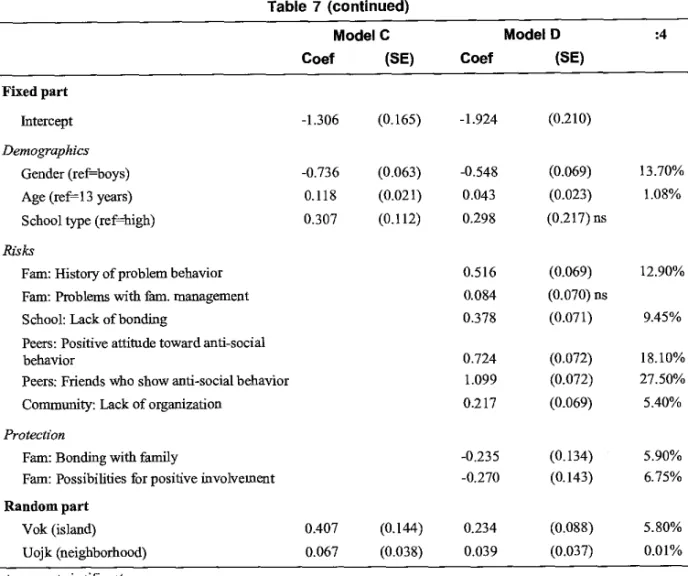
(16) DIFFERENT WORLDS, COMMON ROOTS A MULTILEVEL ANALYSIS OF YOUTH VIOLENCE AND DELINQUENCY IN THE NETHERLANDS ANTILLES AS A BASIS FOR CRIME PREVENTION Table 7 (continued) Model D. Model C. :4. Coef. (SE). Coef. (SE). -1.306. (0.165). -1.924. (0.210). Gender (ref=boys). -0.736. (0.063). -0.548. (0.069). 13.70%. Age (ref--13 years). 0.118. (0.021). 0.043. (0.023). 1.08%. School type (ref=high). 0.307. (0.112). 0.298. (0.217) ns. Fixed part Intercept Demographics. Risks 12.90%. Fam: History of problem behavior. 0.516. (0.069). Fam: Pmblems with faro. management. 0.084. (0.070) ns. School: Lack of bonding. 0.378. (0.071). 9.45%. Peers: Positive attitude toward anti-social behavior Peers: Friends who show anti-social behavior. 0.724 1.099. (0.072) (0.072). 18.10% 27.50%. Community: Lack of organization. 0.217. (0.069). 5.40%. -0.235 -0.270. (0.134) (0.143). 5.90% 6.75%. Protection Fam: Bonding with family Fam: Possibilities for positive involvement. ~dont part Vok (island). 0.407. (0.144). 0.234. (0.088). 5.80%. Uojk (neighborhood). 0.067. (0.038). 0.039. (0.037). 0.01%. Note: ns: not significan... For delinquency (Table 7) we also propose Model D, a three levet random intercept model with three socio-demographic variables (gender, age, school type), five risk factors: 1). History of problem behavior (family); 2). Lack of bonding (school); 3). Positive attitude toward anti-social behavior (friends); 4). Friends who show anti-social behavior (friends); 5). Lack of organization (community) and two protective factors: 1). Bonding with family (family) and 2). Possibilities for positive involvement (family). Here we see nearly the same pattern as for violence. For the intercept models (Model A and Model B), delinquency on the levet of neighborhood and island, is higher. In Model C we add the socio-demographic variables. Boys are more delinquent than girls. The older the youngster the higher the levet of delinquency. School type is not significant here. In Model D we add the risk and protective factors and see if the influence of each of these predictors is significant. Also here, the risk factors are positively related to delinquency (higher risk factors show higher delinquency, as is shown in theory in western studies). And likewise here,. 38.
(17) WELL-BEING AND SOCIAL POLICY VOL 6, NUM. 2, pp. 25-43. as we saw earlier for violence, the risk factor Friends who show anti-social behavior is the best predictor (OR: 3.01; CI 95%: 2.87-3.15, adjusted for the other variables). Here we see negative relationships between delinquency and the two protective factors (Sonding with family' and Possibilities for positive involvement'). Fairly important differences remain between islands and there are slight differences between neighborhoods. Reducing the influence of the risk factor Friends who show anti-social behavior can make a maximum difference of 27.5% (`Gelmans Divide by 4-tale') (Gellman and Hill 2007). Now that we have this information and have developed the predictive model for delinquency we can estimate the likelihood of becoming delinquent. Here too, we have to take account of the socio-demographic variables, any possible risk factors and/or protective factors. And we have to know in which neighborhood or island the youngster lives. The minimum probability of delinquency is 2.8% (`positive environment'), the maximum chance is 89.5% (`negative environment').. 3. Conclusions There are clear indications that the various emotional, mental, and behavioral health problems of youngsters in the Netherlands Antilles are considerable. This study also confirms the high general level of violence and delinquency. Because not all 'the burden of this suffering' (Offord, et al. 1999) can be Iowered by individual care, targeted social policy, and prevention of youth problems should be considered seriously. Social determinants of violence and delinquency are important targets for social policy and prevention, especially risk factors and protective factors which are correlated with these two behavioral problems. Targeting these social determinants should be starting points for a more effective social policy. The social determinants of youngsters researched in this article are part of their daily lives. They are part of the contexts and social fabric in which these youngsters grow up: of the families in which they are born, the schools where they spend thousands of hours, the friends with whom they interact, and the neighborhoods in which they live. In this study of violence and delinquency we made use of six reliable risk factors and two protective factors. We see that in this non-western area these risk factors are oyeran significantly positively correlated with the two dependent variables violence and delinquency. The protective factors show negative associations with crime. In this research we first identified the important predictors of violence and delinquency in the NA. Predictors, researched in various studies, mainly in the western world, equally show a strong correlation in this non-western area. The prevalence levels of violence and delinquency are high in the NA, particularly on the three northern islands St Maarten, St Eustatius, and Saha compared to the two southem islands of Curacao and Bonaire. The differences in the prevalence rates in the 109 researched neighborhoods are also significant. In the second part of this article we combined all the information in a multilevel analysis, focusing on fixed and random influences on different levels (individual, neighborhood, and island). With the use of multilevel logistic regression analyses we developed predictive models for violence. 39.
(18) DIFFERENT WORLDS, COMMON ROOTS A MULTILEVEL ANALYSIS OF YOUTH VIOLENCE AND DELINQUENCY IN THE NETHERLANDS ANTILLES AS A BASIS FOR CRIME PREVENTION. as well as for delinquency. We ended with the best predictive model for each of these two problem behaviors. For violence and delinquency the risk factor `Friends who show anti-social behavior' is an especially important risk factor (OR: 3.1 and 3.3 respectively, adjusted for the other variables). Lowering important risk factors (maximum profit 28%) and improving important protective factors can have a strong influence on the outcomes. For violence we propose a three level random intercept model with three socio-demographic variables, five risk factors, and one protective factor. This three level random intercept model is also the best predictive model for delinquency, without school type as predictor but with the use of both protective factors. The theoretical and empirical insights as well as the use of modem statistical instruments give us opportunities for effective social policy and prevention in the future. For policy as well for practice it is important to know where to put the energy and work. The proposed predictive models are a good basis for targeting violence and delinquency effectively. This study is rather unique because, as far as we know, it is one of the first to investigate correlates between problem behaviors and different important social determinants (risk factors and protective factors) clustered in three levels (individuals, neighborhoods, islands) in the non-western world. Of course this innovative study has limitations. The number of social epidemiological studies on adolescence in the non-western world is scarce. Most of the groundbreaking work is done in the western world (Rutter, Giller and Hagell 1998, Hawkins, et al. 1998, Elliott 1997, Sherman, et al. 1996, Jonkman, Yperen and Prinsen 2008). It is difficult to compare the results of this study with other similar studies. This kind of work requires follow-up research and needs to be broadened. It also needs comparative studies set up with the same measurements to bear out the conclusions in full. The fieldwork was conducted in schools. Although the participation of the school boards and the students in the schools was very high, this non-western area is characterized by a high level of school drop-out (especially among youngsters older than 14 years). We may expect that the levels of emotional, mental, and behavioral health problems of youngsters are higher when the results of this rather large group of school drop-outs are part of the sample. Studies of this kind in the western world are linked to research on preventive programs, strategies and interventions (Elliott 1997, Sherman, et al. 1996, Jonkman, Yperen and Prinsen 2008). By building on this kind of research, effective prevention activities for violence and delinquency could be developed and implemented on a broader scale for violence and delinquency. The resources for this kind of preventive interventions are far more scarce in non-western countries and this limits the possibilities for preventive activities. Especially in these countries it is important that money is invested in disseminating effective programs, strategies and interventions on a broader scale. For political decision-making predictive studies of this nature can be important. During the fieldwork of this study (2006) the people of the Netherlands Antilles participated in a referendum. The inhabitants of the different islands chose different futures. Although they still will work together in partnership (they all remain within let Koninkrijk der Netherlanden' [the Kingdom of the Netherlands]), the responsibilities for social policy changed recently (10-10-2010). We hope that work on the welfare of Antillean youngsters will be part of this partnership. The burden of suffering among youngsters is very high in this part of the world. Children and youngsters growing up here need help and support to become healthy and social adults. Effective social policy and prevention is necessary for the wealth of this area. To become successful. 40.
(19) WELL-BEING AND SOCIAL POLICY VOL 6, NUM. 2, pp. 25-43. in crime prevention studies of prevalence, social determinants, and variation of violence and delinquency in their complexity are important. Social policy and preventive activities in this area can be developed on the basis of these insights. For the science of prevention we have to broaden our knowledge about the development of problem behaviors among youngsters towards nonwestern arcas and to research preventive practices in different cultures. This study is just a start.. References Arthur, M. W., J. S. Briney, J. D Hawkins, R. D. Abbott, B. C. Brook-Weiss, and R. F. Catalano.. Coie, J. D., N. F. Watt, S. G. West, J. D. Hawkins, J. R. Asarnow, H. J. Markman, S. L. Ramey, M. B. Shure, and B. Long. "The science of. "Measuring risk and protection in communities using the Communities that Care Youth Survey." Evaluation Review, vol. 26, no. 6, (2006): 575601.. prevention. A conceptual framework and some directions for a national research program." American Psychologist, vol. 48 (1993): 1013-1022.. Bayar, B. and M. Sayil. "Brief report: Risk-taking. Duncan, G. J. and S. W. Raudenbusch.. behaviors in a non-western urban adolescent sample." Journal of Adolescence, vol. 28 (2005): 671-676.. "Assessing the effects of context in studies of child and youth development." Educational Psychologist, vol. 34, no. 1 (1998): 29-41.. Bickel, R. Multilevel analysis for applied research.. Elliott, D. S., S. Mihalic, K. Irwin, A. Fagan, and D. Hansen. Blueprints for Violence. It's just regression! New York: Guilford Press, 2006.. Prevention. Vol. 1-11. Centre for the Study of Prevention of Violence, Institute of Behavioral Science, University of Colorado, Boulder, 1997.. Boer, Sd and W. and J. Roorda. Scholierenonderzoek Communities that Care Nederlandse Antillen. Willemstad: DSP-Groep/CBSNA, 2006.. Elliott, D. S. and P. H. Tolan. "Youth violence, prevention, intervention and social policy: an overview." Chapter I in Youth Violence, Prevention, Intervention and Social Policy, edited by D.J. Flannery and C.R. Huff. Washington DC/London: Clinical Practice, 1999.. Centraal Bureau voor de Statistiek, NA. De huishoudsituatie van schoolgaande jongeren. Willemstad, NA: CBS, 2004.. Centraal Bureau voor de Statistiek, NA. Huishoudens in de Nederlandse Antillen. Willemstad, NA: CBS, 2003.. Furstenberg, F. F. Managing to make it. Urban Families and Adolescent Success. Chicago/London: University of Chicago Press, 1999.. Centraal Bureau voor de Statistiek, NA. Fourth population and housing census Netherlands Antilles. Willemstad, NA: CBS, 2001.. Gellman, A. and J. Hill. Data analysis using regression and multilevel/hierarchical models, Cambridge: Cambridge University Press, 2007.. Centraal Bureau voor de Statistiek, NA. Leefsituatie in enkele achterstandsbuurten van Curacao. Historische achtergronden en statistische feiten, Willemstad, NA: CBS, 2001.. Glaser, R. R., M. L. Van Horn, M. W. Arthur, J. D. Hawkins, and R. F. Catalano. "Measurement properties of the communities that care youth survey across demographic groups." Journal of Quantitative Criminology, vol. 21, no. 1, (2005): 73-102.. 41.
(20) DIFFERENT WORLDS, COMMON ROOTS A MULTILEVEL ANALYSIS OF YOUTH VIOLENCE AND DELINQUENCY IN THE NETHERLANDS ANTILLES AS A BASIS FOR CRIME PREVENTION. Hawkins, J. D., R. E Catalano, and J. Y. Miller.. Leventhal, T. and J. Brooks-Gunn. "The. "Risk and protective factors for alcohol and other drug problems in adolescence and early adulthood. Implications for substance abuse prevention." Psychological Bulletin, vol. 112 (1992): 64-105.. neighbourhoods they live in: the effect of neighbourhood residence on child and adolescent outcomes." Psychological Bulletin, vol. 126 (2000): 309- 337.. Hawkins, J. D., T. Herrenkohl, D. P. Farrington, D. Brewer, R. F. Catalano, and T. W. Harachi. "A review of predictors of youth. Loeber, R. and D. P. Farrington. Child delinquents: Development, Intervention and Service Needs. Thousand Oaks, CA: Sage, 2001.. violence." pp. 106-146, in Serious and Violent Juvenile Offenders: Risk Factors and Succesful Interventions, edited by Loeber and Farrigton. Thousand Oaks, CA: Sage Publications, 1998.. Loeber, R., N. W. Slot, P. V. D. Laan, and M. Hoeve. Tomorrow's criminals: The development of child delinquency and effective interventions. Burlington: Ashgate, 2008.. Jonkman, H., R. Boers, B. V. Dijk, and M. Rietveld. Wijken gewogen. Gedrag van jongeren. Loeber, R., N. W. Slot, and J. A. Sergeant. Ernstige en gewelddadige jeugddelinquentie: Omvang, Oorzaken en Interventies. Houten/ Diegum: Bohn Stafleu Van Loghum, 2001.. in kaart gebracht. Utrecht/Amsterdam: NIZW/SWP, 2006.. Jonkman, H., T. V. Yperen, and B. Prinsen.. Luke, D. Multilevel modeling. Thousand Oaks: Sage,. "Prevention". Pp. 179-197 in Tomorrow's Criminals. The development of Child Delinquency and Effective Interventions, edited by R. Loeber, N. W. Slot, Pvd. Laan, M. Hoeve. Burlington: Ashgate, 2008.. 2004.. Offord, D. R., H. C. Kraemer, A. E. Kazdin, P. S. Jensen, R. Harrington, and J. S. Gardner. "Lowering the burden of suffering: Monitoring the benefits of clinical, targeted and universal approaches." Pp. 293-331 in Developmental Health and the Wealth of Nations, Social, Biological and Educational Dynamics, edited by D. P. Keating and C. Hertzman. New York: Guilford Press, 1999.. Junger-Tas, J., M. Steketee, and M. Moll. "Achtergronden van jeugddelinquentie en middelengebruik." Utrecht: Verwey-Jonker Instituut, 2008.. Karstedt, S. "Comparing cultures, comparing. Pollard, J. A., J. D. Hawkins, and M. W. Arthur.. crime: Challenges, prospecta and problems for a global criminology." Crime, Law & Social Change, vol. 36 (2001): 285-308.. "Risk and protection: are both necessary to understand diverse behavioural outcomes in adolescence?" Social Work, vol. 23 (1999): 145158 .. Kawachi, I. and L. F. Berkman. "Neighbourhoods and Health." New York: Oxford University Press, 2003.. Rabash, J., F. Steele, W. Browne, and B. Prossner. "A user's guide to MLWin, Version 2.0.. Keating, D. P. and C. Hertzman. Developmental. Centre for Multilevel Modeling." Bristol: University of Bristol, 2005.. health and the wealth of nations: Social, biological and educative dynamics. New York: Guilford, 1999.. Rabe-Hesketh, S. and B. S. Everitt. A. Kloep, M., N. Güney, F. Cok, and O. F. Simsek.. Handbook of Statistical Analyses using Stata, 4th edition. Boca Raton: Cahpman & Hall/CRC, 2007.. "Motives for risk-taking in adolescence: A crosscultural study." Journal of Adolescence, vol. 32 (2009): 135-151.. Rabe-Hesketh, S. and A. Skondal. Multilevel and longitudinal modeling using Stata, 2nd edition. Station College, TX: Stata Corporation, 2008.. Kohler, U. and F. Kreuter. Data analysis using Stata, 2nd edn. Texas: Stata Press, College Station, 2008.. Raudenbusch, S. W. and A. S. Bryk. Hierarchical Linear Models. Thousand Oaks, CA: Sage, 2002.. 42.
(21) WELL-BEING AND SOCIAL POLICY VOL 6, NUM. 2, pp. 25-43 Rutter, M., H. Giller, and A. Hagell. Antisocial Behaviour by Young People. Cambridge University Press, Cambridge. 1998, Sampson, R.J., S.W. Raudenbusch, and F. Earls. "Neighbourhoods and violent crime: a multilevel study of collective efficacy." Science, vol. 277 (1997): 918-224. Sherman, L. W., D. Gottfredson, D. MacKenzie, J. Eck, R Reuter, and S. Bushway. "Preventing Crime: What works, What doesn't; What is promising. A report to the United States Congress." University of Maryland at College Park, Department of Criminology and Criminal Justice. College Park, 1996. Snijders, T. and R. Bosker. Multilevel Analysis. Thousand Oaks, CA: Sage, 1999. Twisk, J. W. R. Applied multilevel analysis. A practica! guide. Cambridge: Cambridge University Press, 2006. Vazsonyi, A. T., P. Chen, M. Young, D. Jenkins, S. Browder, and E. Kahumoku. "A test of Jessor's Problem Behavior Theory in a Eurasian and a Western European Developmental Context." Journal of Adolescent Health, vol. 43 (2008): 555-564. Wilson, W. J. The truly disadvantaged. Chicago: The inner-city, the underclass and public policy, Chicago University Press, 1987.. 43.
(22)
Figure

Documento similar