Effects of CO2 activation of carbon aerogels leading to ultrahigh micro meso porosity
11
0
0
Texto completo
(2) 1. Introduction The synthesis of porous materials with tailor-made high surface areas and pore volumes in the micro- and mesoporous range has become a subject of great interest in the last decades, driven by the need to obtain highly featured materials with controlled properties (uniformity in pore sizes, volumes and shapes) in multidisciplinary fields [1,2]. Within this context, the characterization of the porous structure of materials has become a valuable tool and it is commonly obtained from the analysis of experimental adsorption isotherms of different gases (N2, CO2, Ar, H2) at various temperatures [3]. Both classical (Dubinin-Radushkevich, BJH or t-plot) and molecular simulation methods have been extensively used for this purpose, allowing the determination of the apparent surface areas, pore volumes and pore size distributions (PSD). While most of these methods are well established for microporous materials (zeolites, activated carbons, silica) and thus provide reasonable (and comparable) results, the analysis of the mesoporosity is not yet so well accomplished, particularly for materials displaying extremely high pore volumes and where pore blocking and/or cavitation phenomena can occur [4-8]. The evaluation of mesoporosity relies on the analysis of the isotherm in the regions of capillary condensation and evaporation and is associated to hysteresis phenomena and the existence of metastable states. The origin and interpretation of hysteresis in adsorption is a long standing and widely discussed issue, and yet discrepancies remain [3, 6-9]. A general consensus in this discussion is that the shape of the loop provides useful qualitative information about the mesoporous structure of the materials, as adsorption hysteresis depends on the size and shape of the pores and the connectivity of the pore system, among other factors. A simple one dimensional carbon slit pore model and the related adsorption theoretical models based on the density functional theory (DFT) in its local [10] and nonlocal (NLDFT) [11] versions have been used for more than two decades to describe and characterize the pore structure of activated carbons. However, over time with enhanced accuracy of the adsorption measurements the visible artifacts in the PSD calculation results have been reported and discussed [12,13]. It is now well understood that the flat and energetically uniform surface of simple slit pores is a source of the problem due to the fact that the adsorption process in such pores exhibit the so called layering transitions which do not occur on real heterogeneous surfaces. In this work we use a new 2D-NLDFT-HS model for carbons with energetically heterogeneous and geometrically corrugated pore walls [14,15]. This improved carbon slit.
(3) pore model gives an excellent fit to the experimental data and is free of common artifacts usually obtained in the PSD analysis when the standard NLDFT model was used. The objective of this work was to analyze the effects of CO2 activation on the porosity of the ultrahigh pore volume carbon aerogels. The changes in both the micro and mesopore range were evaluated using 2D-NLDFT-HS model [15] and compared with the results of conventional methods (BJH, t-plot) in terms of pore volumes, surface areas and pore size distributions.. 2. Experimental. 2.1 Materials Details of the preparation of the carbon aerogels by the polymerization of resorcinol (R), formaldehyde (F) and water (W) mixtures using carbonate as catalyst (C) have been reported elsewhere [16,17]. Briefly, the precursors (molar ratio R/C 200, R/W 0.06) were mixed in sealed glass moulds and kept at 40 ºC for 24 h and 70 ºC for 120 h. After a controlled water– acetone exchange, the materials were dried under CO2 supercritical conditions (sample G4) and carbonized at 800 ºC (sample G4c). The carbonized aerogel was further activated using CO2 (10 ml/min) at 800ºC for 2 and 8 h, obtaining samples G4cA2 and G4cA8, respectively.. 2.2 Nanotextural and Chemical Characterization The high-resolution nitrogen adsorption–desorption isotherm measurements at -196°C were measured in an ASAP 2020 (Micromeritics) volumetric analyzed on samples previously degassed under dynamic vacuum (ca. 10-5 Torr) at 120°C for 17 hours. The instrument was equipped with a molecular drag vacuum pump and three pressure transducers (0.0133, 1.33 and 133 kPa, uncertainty within 0.15% of reading) to enhance the sensitivity in the lowpressure range, which is especially useful in adsorption studies on highly microporous materials. Strict analysis conditions were programmed during the gas adsorption measurements to ensure equilibrium data, thus the average elapsed time for each isotherm of the isotherms was 90−120 h, with over 100 equilibrium points. Each isotherm measurement was performed in duplicate to guarantee the accuracy of the experiments (error was below 0.1%) and to obtain reproducible data. Ultrahigh purity nitrogen (i.e., 99.9992%) was supplied by Air Products. The isotherms were used to calculate the specific surface area using the Brunauer–Emmett–Teller theory, SBET, total pore volume, VT, and micropore volumes using t-plot method with the reference to standard nitrogen adsorption data for non porous.
(4) carbons [18]. The PSD analysis in the mesopore range was performed using the BJH formulism applied to the desorption branch, and the full micro-meso pore size distribution was calculated using the 2D-NLDFT-HS model assuming surface heterogeneity of carbon pores [15].. 3. Results and discussion In this work we present the analysis of the porous features of carbon aerogels with ultra high micro- and mesopore volumes by comparing different methods based on the analysis of the nitrogen adsorption isotherms at its boiling point. The carbon aerogels have been synthesized by the polycondensation of resorcinol-formaldehyde mixtures in alkaline medium as described elsewhere [16,17]. The effect of the various synthesis and processing conditions on the characteristics (morphology, texture, composition) of the carbon gels has been widely discussed in the literature [19-21], and remains out of the scope of this study. Figure 1 shows the nitrogen adsorption isotherms at -196ºC of the studied carbon aerogels prepared by carbonization and physical activation under CO2, while the main textural parameters obtained from applying different methods are compiled in Table 1. Table 1. Porosity parameters obtained from the N2 adsorption isotherms at -196 ºC for the aerogels. G4. G4c. G4cA2. G4cA8. SBET (m2/g). 611. 746. 987. 1798. VTOTAL (cc/g) A. 1.32. 1.00. 1.06. 1.91. Wo, MICROPORES (cc/g) B. 0.14. 0.24. 0.34. 0.68. VMICROPORES (cc/g) †. 0.03. 0.15. 0.22. 0.27. V MESOPORES (cc/g) †. 1.29. 0.85. 0.84. 1.64. VTOTAL (cc/g) A ‡. 1.30. 0.97. 1.04. 1.83. V MICROPORES (cc/g) ‡. 0.08. 0.19. 0.28. 0.50. V MESOPORES (cc/g) ‡. 1.21. 0.78. 0.77. 1.33. A. total pore volume determined at p/p0 ~0.99. B. micropore volume determined by Dubinin-Radushkevich equation. †. evaluated from t-plot. ‡. evaluated from 2D-NLDFT-HS.
(5) The porosity of the pristine aerogel (sample G4) displays a type IV isotherm characteristic of a micro/mesoporous material with a prominent H2 hysteresis loop in the desorption branch at relative pressures ~0.7-0.8. The obtained textural parameters (in terms of micro/mesopore balance, surface area and pore volume) are in agreement with those reported for colloidal gels synthesized using high R/C ratio [16,20,21].. Volume adsorbed (cm3 g-1, STP). 1400. A). G4 G4c G4cA2 G4cA8. B). G4 G4c G4cA2 G4cA8. 2200. 1100 1700 800 1200 500 700. 200 200 0.0. 0.2. 0.4. 0.6 o. p/p. 0.8. 1.0. 0.0. 0.2. 0.4. 0.6. 0.8. 1.0. o. p/p. Fig. 1. (A) High resolution nitrogen adsorption (solid symbols) and desorption (open symbols) isotherms at -196 ºC of the series of studied samples. (B) Isotherms have been shifted for clarity. Lines between experimental points are guides for the eye. The carbonization at 800 ºC of the aerogel (sample G4c) preserved the overall shape of the adsorption-desorption isotherm, with slight modifications in the pore volumes as seen by the increased uptake at low relative pressures (microporosity) and the reduced mesopore volume accompanied by a downward shift in the position of the hysteresis loop. From a structural point of view, these changes are attributed to the densification of the organic aerogel upon the thermal annealing at high temperatures and to the structural shrinkage due to the surface.
(6) tensions created by the gases evolved as a result of the decomposition of the volatile matter of the organic gel (i.e. OH moieties, H2O, CO2, CO and other organic molecules). Presented data show that the porosity of G4 aerogel (before carbonization) is mainly composed of mesopores, with a negligible micropore volume as calculated by t-plot (Table 1). The minor microporosity of the gel was developed upon densification of the material by thermal treatment at 800ºC. Further information on the textural features of the synthesized aerogels was obtained from the analysis of the pore size distribution using the 2D-NLDFT-HS model [15] applied to the desorption branch of the isotherm (Fig. 2). The model fits the experimental. Cum. Vol. (cc/g). data relatively well in the whole range of relative pressures, as seen in Figure 3.. A). G4 G4c G4cA2 G4cA8. 1.5 1.0 0.5 0.0. 0. 20. 40. 60. 80. 100. 120. dV/dw (cc/g Å). 0.20. 140 B). 0.15 0.10 0.05 0.00. 0. 20. 40. 60. 80. 100. 120. 140. pore width (Å) Fig. 2. PSDs calculated from the desorption branch of N2 isotherms for the series of studied samples using 2D-NLDFT-HS model. The obtained PSD confirmed the shrinkage of the mesoporous structure upon carbonization, with the average mesopore size decreasing from 7.3 to 5.9 nm for G4 and G4c,.
(7) respectively. As for microporosity, data obtained from 2D-NLDFT-HS were relatively close to those of t-plot method.. 2200. A). G4 G4c G4cA2 G4cA8. B) 2200. 1700. 1200. 1200. 700. 700. 200. 200. Vol. Ads. (cc/g, STP). 1700. 0.0. 0.2. 0.4. 0.6. 0.8. 1.0. 10-7 10-6 10-5 10-4 10-3 10-2 10-1 100. o. p/p. p/po. Fig. 3. Fitting (red lines) of experimental isotherms (symbols) by the 2D-NLDFT-HS model. For clarity, data is shown in linear (A) and logarithmic (B) scales. More outstanding differences were obtained from the analysis of the activated samples; after 2 hours of activation (sample G4cA2) the expected increase in the gas uptake at low relative pressures was observed, as a consequence of the development of microporosity. Interestingly, the desorption branch of the isotherm showed a stepped pattern with a curvature (inflection point) at p/po ~ 0.7 (marked by an arrow in Fig. 1) that was not observed in the adsorption branch. Besides this curvature, the shape and position of the hysteresis loop was similar to that of sample G4c, pointing out that the mesopore network (average size) remained rather unchanged. When the activation reaction was hold for longer time, in addition to the increase in N2 uptake, the isotherm showed a double stepped pattern. The curvature (inflection point) at p/po ~ 0.7 already seen in sample G4cA2 is still present, and a second one appears at higher relative pressures (ca. p/po ~ 0.8)..
(8) The evolution of our desorption isotherms and related PSDs upon the sequence of activation steps show that the burn-off rate in different parts of the carbon particle was not uniform. In some parts CO2 carved the surface of the precursor deeper than in others creating bimodal/multimodal pore size distribution. Similar adsorption features with a characteristic curvature in the adsorption/desorption isotherm have been described for other materials (chemically modified Vycor glass [22], porous silicon layers [23] and mesoporous silica [24]), and interpreted as pore blocking and cavitation effects occurring in pore networks where pores are connected through narrow openings. The bimodal distribution of the mesoporosity (Fig. 2) in the activated samples was described by the 2D-NLDFT-HS model, as inferred from the fitting of the experimental data (Fig. 3). The PSD of the sample activated for 2 hours shows a shoulder centered at ca. 5 nm preceding the main peak located at 6 nm, however, it is clear that the sizes of most of the mesoporous voids remained in the same range compared to G4c sample. The small increase in the cumulative pore volume is the consequence of the creation on new micropores. Further activation for 8 hours resulted in a large increase in the pore volume, accompanied by a broadening of the mesopore distribution. The PSD pattern of G4cA8 shows a less defined profile with broad peaks between 3-14 nm, indicating that the sample has lost the narrow and homogeneous distribution of mesopores seen in G4c and G4cA2, and displays a heterogeneous mesoporosity comprised of pores of different widths. Considering the activation procedure applied to carbonized sample G4c, the adsorption features of the activated samples can be explained as follows: along with the creation of micropores (as seen in the increased pore volumes), the activation reaction causes the enlargement of micropores (as confirmed by the increase in the pore volumes) and the formation of new mesopores in the case of G4cA8. The curvature in the desorption branch of G4cA2 corresponds to the emptying of the two independent mesopores with different sizes. The appearance of two curvatures (inflection points) in the desorption branch of the G4cA8 isotherm is due to further evolution of the carbon pore structure. The first curvature appears at slightly higher pressure than that described for GAcA2. The onset of the second curvature occurs at even higher relative pressures, which seems reasonable if the activation also affects the mesoporosity and if new mesopores of smaller sizes were created while the existing ones are enlarged. This is consistent with the increase in the total mesopore volumes upon activation, seen in Table 1..
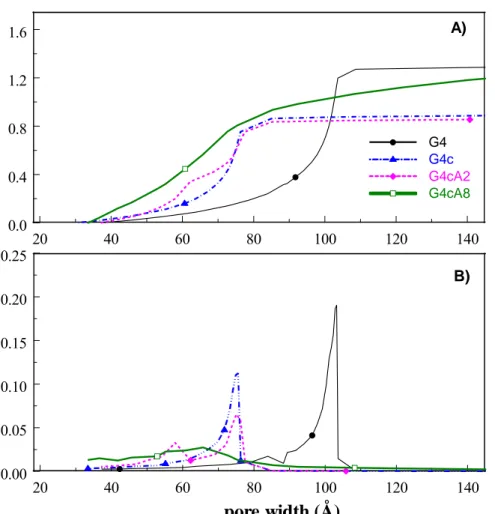
(9) A). Cum. Vol. (cc/g). 1.6 1.2 0.8. G4 G4c G4cA2 G4cA8. 0.4 0.0 0.25. 20. 40. 60. 80. 100. 120. 140. dV/dw (cc/g Å). B) 0.20 0.15 0.10 0.05 0.00. 20. 40. 60. 80. 100. 120. 140. pore width (Å) Fig. 4. PSDs from BJH applied to the desorption branch for the series of studied samples. The analysis of the desorption isotherms by BJH formulism (Fig. 4) yielded rather similar results to those obtained by 2D-NLDFT-HS (Fig. 2), however, the mesopore sizes of BJH method are shifted to higher values on the pore size scale, which is due to the fact that BJH assumes cylindrical pore shape. A bimodal distribution of pore widths is still observed for the carbon aerogel activated for 2 hours, and the similarities between the PSD of G4c and G4cA2 are also noticed. The widening of the mesoporosity of G4cA8 is also seen, as the distribution expands from small to large mesopores (Fig. 4).. 4. CONCLUSIONS We have analyzed the effects of CO2 activation on the porosity of ultrahigh pore volume carbon aerogels, by comparing classical (BJH, t-plot, DR) and molecular simulation methods commonly used for the textural characterization of porous solids. The new 2D-NLDFT-HS model for carbons with energetically heterogeneous and geometrically corrugated pore walls.
(10) was used to obtain the pore size distribution of a series of carbon aerogels with ultra high micro-/mesoporosity and obtained by physical activation at different burn-off degrees. Data showed that physical activation under CO2 resulted in outstanding changes in the porous features of the pristine micro/mesoporous carbon aerogel. Besides the expected development of microporosity -also confirmed by the micropore volumes evaluated by t-plot and DR- the mesoporous structure of the aerogel was also modified during activation. The activated aerogels showed a stepped pattern in the nitrogen adsorption/desorption isotherms, with an inflection point at relative pressures higher than 0.7. Such curvatures are attributed to a non uniform activation of the carbon matrix carbon matrix under CO2 that in some parts carves the surface of the precursor deeper than in others, creating bimodal/multimodal pore size distributions. Soft activation creates materials with narrow and homogeneous distribution of mesopores, whereas after long activation times the aerogel shows a heterogeneous mesoporosity comprised of pores of different widths. The different methods applied for the assessment of the textural properties of the aerogels with ultrahigh micro-/mesoporosity showed excellent agreement in terms of pore volumes, surface areas and average pore size.. ACKNOWLEDGMENTS The authors thank the financial support of the Spanish MINECO (grant CTM2011/02338).. REFERENCES [1] F. Schüth, K.S.W. Sing, J. Weitkamp, Handbook of porous solids, Wiley-VCH, New York, 2002. [2] J. Lee, T. Kim, J. Hyeon, Adv Mater 18 (2006) 2073–94.. [3] F. Rouquerol, J. Rouquerol, K.S.W. Sing, P. Llewellyn, G. Maurin, Adsorption by Powders and Porous Solids, 1st ed., Elsevier 2014. [4]. C.J. Rasmusse, A. Vishnyakov, M. Thommes, B.M. Smarsly, F. Kleitz, A.V. Neimark, Langmuir 26 (2010) 10147–57.. [5]. A. Vishnyakov, A.V. Neimark, Langmuir 19 (2003) 3240-7.. [6]. P.A. Monson, Microp. Mesop. Mater. 160 (2012) 47–66.. [7]. T. Nguyen, D.D. Do, D. Nicholson, J. Phys. Chem. B 115 (2011) 12160–72.. [8]. C. Fa, Y. Zeng, D.D. Do, D. Nicholson, Phys. Chem. Phys. Chem. 2014 (in press).
(11) [9]. de Boer JH. in The Structure and Properties of Porous Materials, (Eds. D. H. Everett and F. S. Stone), Butterworths, 1958 pp. 84-145.. [10] N.A. Seaton, J.P.R.B. Walton, N. Quirke, Carbon 27 (1989) 853-861. [11] C. Lastoskie, K.E. Gubbins, N. Quirke, J. Phys. Chem. 97(1993) 4786-4796. [12] A.V. Neimark, Y. Lin, P.I. Ravikovitch, M. Thommes, Carbon 47 (2009) 1617-1628. [13] A.D. Lueking, H.-Y. Kim, J. Jagiello, K. Bancroft, J.K. Johnson, M.W. Cole, J. Low Temp. Phys. 157 (2009) 410–428. [14] J. Jagiello, J.P. Olivier, Carbon 55 (2013) 70-80. [15] J. Jagiello, J.P. Olivier, Adsorpt. 19 (2013) 777–783 [16] C. Macias, M. Haro, J.B. Parra, G. Rasines, C.O. Ania, Carbon 63 (2013) 487-497. [17] G. Rasines, P. Lavela, C. Macias, M. Haro, C.O. Ania, J.L. Tirado, J. Electroanal. Chem. 671 (2012) 92-8. [18] P.J.M. Carrott, R.A. Roberts, K.S.W. Sing, Carbon 25 (1987) 769-770. [19] R.W. Pekala, J. Mater. Sci. 24 (1989) 3221–7. [20] N. Job, A. Thery, R. Pirard, R. Marien, L. Kocon, J.N. Rouzaud, F. Beguin, J.P. Pirard, Carbon 43 (2005) 2481-94. [21] S.A. Al-Muhtaseb, J.A. Ritter, Adv. Mater. 15 (2003) 101-14. [22] J. Renou, J. François-Rossetti, B. Imerick, Bul. Soc. Chimique de France, 91 (1961) 446-50. [23] A. Grosman, C. Ortega, Langmuir 27 (2011) 2364–2374. [24] P. Van Der Voort, P.I. Ravikovitch, K.P. de Jong, A.V. Neimark, A.H. Janssen, M. Benjelloun, E. van Bavel, P. Cool, B.M. Weychuysen, E.F. Vansant, Chem. Comm. 9 (2002) 1010-1..
(12)
Figure


+2
Documento similar
Keywords: iPSCs; induced pluripotent stem cells; clinics; clinical trial; drug screening; personalized medicine; regenerative medicine.. The Evolution of
In addition, precise distance determinations to Local Group galaxies enable the calibration of cosmological distance determination methods, such as supernovae,
Government policy varies between nations and this guidance sets out the need for balanced decision-making about ways of working, and the ongoing safety considerations
In the preparation of this report, the Venice Commission has relied on the comments of its rapporteurs; its recently adopted Report on Respect for Democracy, Human Rights and the Rule
Astrometric and photometric star cata- logues derived from the ESA HIPPARCOS Space Astrometry Mission.
The photometry of the 236 238 objects detected in the reference images was grouped into the reference catalog (Table 3) 5 , which contains the object identifier, the right
Díaz Soto has raised the point about banning religious garb in the ―public space.‖ He states, ―for example, in most Spanish public Universities, there is a Catholic chapel
teriza por dos factores, que vienen a determinar la especial responsabilidad que incumbe al Tribunal de Justicia en esta materia: de un lado, la inexistencia, en el
