Economic and environmental benefits of optimized hybrid renewable energy generation systems at Jeju National University, South Korea
12
0
0
Texto completo
(2) Sustainability 2016, 8, 877. 2 of 12. After the introduction of this act, two specific areas—large educational institutes and islands that consume major investments for their electrical supply—are considered the most promising targets for renewable energy resources. Educational institutes are the second biggest energy consumers after apartments in South Korea. About 14.6% of the national energy consumption in South Korea is used in educational institutes [8]. Based on this trend, the South Korean government considers the use of renewable energy resources to be an important issue in operating a sustainable energy supply system for public buildings and institutes [9]. The government has mandated the installation of 20% renewable energy facilities in public buildings and institutes [10]. In South Korea, the energy industry is one of the most important focuses of efforts to improve the national competitiveness. The South Korean government selected six future trends for the successful development of the national economic growth [11]. Based on the selected trends, several studies on the South Korean energy industry have been conducted to appropriately respond to the future situation. Table 1 shows the political, economic, socio-cultural, and technological (PEST) analysis of the industry. Table 1. PEST analysis of the South Korean energy industry [11]. Category Political Economic Socio-cultural Technological. Description. • • • • • • •. Sustainable and green growth Intensive competition for preoccupying undeveloped resources Price rise of raw materials caused by resource depletion Price instability of oil caused by regional issues Introduction of environmentally friendly products Changing consumption patterns caused by green tax (ecotax) Products and services provided by the technological improvements of renewable energy resources. Sources [12–14] [15,16] [17–19] [20,21]. South Korea’s numerous islands require significant investment to maintain the grid connection [22]. In order to reduce the notable investments for the islands’ energy systems, the government has supported the establishment of energy-independent regions for the islands by utilizing renewable energy resources [22,23]. For instance, Jeju Island, located off the southern coast of South Korea, aims to have carbon-free energy-independent systems by 2030 [24]. Moreover, the local government of Jeju Island has operated “Strategic plans for Jeju electric vehicle pilot city” for achieving the goals of “Carbon Free Island Jeju by 2030” [24]. Based on these plans, 10% of the current vehicles used in Jeju Island will be substituted with electric vehicles in 2017. The ratio will be increased to 30% in 2020, and about 100% in 2030. To successfully achieve these goals, the local government plans to extend renewable energy facilities, mainly including wind turbines and photovoltaic panels [25]. Moreover, the heavy energy consumption by South Korean universities is one of the main threats to the reliability of the national grid system. For example, more than 10 universities are included in the list of the top 100 energy consuming South Korean organizations [26,27]. In addition, the majority of South Korean universities use electricity connected to the national grid system. Therefore, educational organizations in Jeju Island need to plan to establish sustainable electricity generation facilities in order to reduce their dependency on the national grid connection. With these trends, the current study sheds light on educational institutes located on Jeju Island. In particular, the current study investigates potential configurations of optimized renewable electricity generation systems for Jeju National University, the largest educational institute in Jeju Island. The Hybrid Optimization of Multiple Energy Resources (HOMER) program is used to propose the configurations for the university. Moreover, the results of the simulations computed by HOMER are evaluated by three evaluation guidelines: the degrees of renewable fraction, cost of energy (COE), and net present cost (NPC). The reminder of the current study is organized as follows. Section below review the current legislative status on renewable energy facilities in South Korea. Section 2 presents the status and renewable energy resources information of Jeju National University. Section 3 examines the simulation.
(3) Sustainability 2016, 8, 877. 3 of 12. background for presenting potential configurations of renewable energy facilities. Section 4 shows the simulation results. The main findings and implications are reviewed in Section 5. Lastly, the main shortcomings of the current study are examined in Section 6. Acts for Renewable Energy Facilities in South Korea In South Korea, the Heat Control Act was enacted in 1974 for heat and fuel in the industrial area after the world energy crisis in 1973 [28]. However, the Energy Use Rationalization Act was enacted in 1979 to actively manage energy, including new energy such as electric and solar in the overall national economy other than industrial parts [29]. Since its enactment, the Energy Use Rationalization Act has been amended several times over 30 years to reflect the entry of conventions such as the Kyoto Protocol on worldwide climate change for sustainable growth potential and solving the global warming problem due to fossil fuels [30]. The present goal of the Act is to promote the rational and efficient use of energy and minimize global warming by reducing the environmental impacts associated with energy consumption. In addition, the need to develop alternative energy was recognized for a reliable and affordable energy supply within the extremely weak energy supply structure in South Korea. Thus, the Act on the Promotion of Alternative Energy Development was enacted in 1987 for activating the development of technologies related to alternative energy, such as solar, wind power, and ocean energy, beyond conventional energy [31]. Since the enactment of the Act on the Promotion of Alternative Energy Development, it has been amended several times, and its name has been changed to the Act on the Promotion of the Development, Use, and Diffusion of New and Renewable Energy (hereinafter referred to as the Renewable Energy Act), replacing the term “alternative energy” with the term meaning new energy distinct from the existing energy and renewable energy at the same time [32]. Currently, the Act emphasizes environmental conservation and sustainable development by promoting the diversification of energy sources, reliable supply of energy, environmentally-friendly conversion of energy structure, and the reduction of GHG emissions. Moreover, all national universities in South Korea can generally be classified as public organizations (Act on The Management of Public Institutions, Article 4—Public Institution) [33]. The universities are therefore mandated to reduce their GHG emissions and promote the development and dissemination of renewable energy technologies by installing related equipment to building for the efficient use of energy and renewable energy. The related specific regulations are shown in Table 2. Table 2. South Korean regulations on renewable energy for public institutes. GHG: greenhouse gas. Act. Description. Energy Use Rationalization Act. Article 8 (Measures for Efficient Use of Energy by State and Local Governments) (1) Persons falling under any of the following subparagraphs shall promote measures necessary for efficiently using energy in accordance with the purposes of this Act and reducing GHG emissions: 1. State; 2. Local governments; 3. Public institutions under Article 4 (1) Of the Act on the Management of Public Institutions. (2) Details of measures necessary for efficiently using energy and reducing GHG emissions, which shall be promoted by the State and local governments under paragraph (1), shall be prescribed by Presidential Decree.. Decree of Energy Use Rationalization Act. Article 15 (Contents of act on efficiency of energy use) In accordance with the Act (Article 8 (1)), the specific contents of necessary acts is as following subparagraphs for efficient use and reduction of GHG emissions by the national and local governments. 1. The provision and maintenance of the system and measures to save energy and reduce GHG emissions 2. Public relation and education related with energy saving and reduction of GHG emissions 3. The rationalization of energy use and reduction of GHG emissions in buildings and transport sectors. Energy Use Rationalization Act.
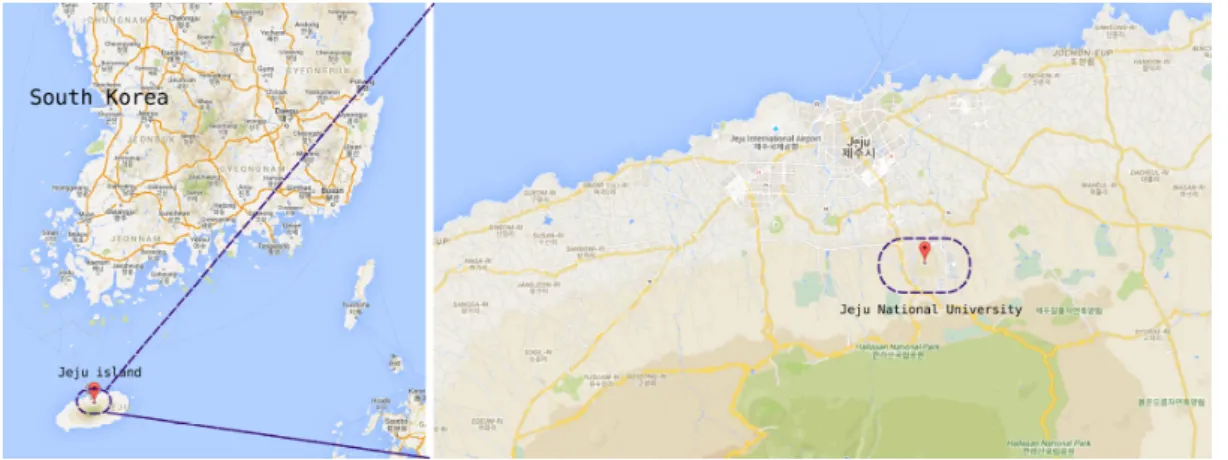
(4) Sustainability 2016, 8, 877. 4 of 12. Table 2. Cont. Act. Energy Use Rationalization Act. Act on the Promotion of the Development, Use and Diffusion of New and Renewable Energy. Description. Regulation on promotion of energy use rationalization by public bodies,. Article 6 (promotion of energy use efficiency in new buildings) In accordance with the Article 14 of Green Building Composition Support Act and the Article 10 of the Decree of the same Act, among buildings to submit an energy saving plan, if it has total floor area of more than 3000 m2 and a building which is designed as the standard of Building Energy Efficiency Rating Certification (usually announced by the Ministry of Trade, Industry and Energy and the Ministry of Land, Infrastructure and Transport) is built newly or if it is expanded as a separate building which has total floor area of more than 3000 m2 , it must obtain grade 1 or higher according to the standard of building energy efficiency rating certification. However, newly built buildings of market or quasi-market type of public enterprises must obtain grade 1++ or higher of Building Energy Efficiency from 2017.. Act on the Promotion of the Development, Use and Diffusion of New and Renewable Energy. Article 12 (Investment Recommendation and Mandatory Use, etc. of New and Renewable Energy) (1) Where the Minister of Trade, Industry and Energy deems it necessary to promote the technological development, use, and distribution of new and renewable energy, he/she may recommend that a person carrying on energy-related business conduct invest in, or contribute to any of the projects referred to in the subparagraph of Article 10. <Amended by Act No. 11690, 23 March 2013> (2) Where the Minister of Trade, Industry and Energy deems it necessary to facilitate the use or distribution of new and renewable energy, and to vitalize the new and renewable energy industry, he/she may require any of the following entities to mandatorily install new and renewable energy facilities in a building newly built, extended, or remodeled by such entities in order to use energy supplied utilizing new or renewable energy over a certain percentage of the estimated amount of energy used computed as at the time of its design, as prescribed by Presidential Decree: <Amended by Act No. 11690, 23 March 2013; Act No. 13087, 28 January 2015> 1. The State and a local government; 2. A public institution; 3. A government-contributed institution to which the Government has contributed at least an amount prescribed by Presidential Decree; 4. A government-invested corporation defined in subparagraph 6 of Article 2 of the State Property Act; 5. A corporation to which a local government, public institution, government-contributed institution, or government-invested corporation referred to in subparagraphs 2 through 4 has invested at a ratio or at least an amount prescribed by Presidential Decree; 6. A corporation incorporated under any special Act. (3) The Minister of Trade, Industry and Energy may recommend that any factory, place of business, collective housing complex, etc., deemed appropriate use new and renewable energy as designated by him/her to use such energy or install facilities for using such energy. <Amended by Act No. 11690, 23 March 2013> [This Article Wholly Amended by Act No. 10253, 12 April 2010]. 2. Status of Jeju National University 2.1. University Location and Population Jeju National University is located in the northern side of Jeju Island in South Korea. The coordination of the university is 37.45 latitude and 126.56 longitude (Figure 1). In 2015, the total land and building area of the university was 1,604,856 m2 and 231,518 m2 , respectively. The university is organized into 12 colleges, about 12,500 students, and approximately 1000 professors and staff..
(5) 2.1. University Location and Population Jeju National University is located in the northern side of Jeju Island in South Korea. The coordination of the university is 37.45 latitude and 126.56 longitude (Figure 1). In 2015, the total land and building area of the university was 1,604,856 m2 and 231,518 m2, respectively. The university is Sustainability 2016, 8, 877 5 of 12 organized into 12 colleges, about 12,500 students, and approximately 1000 professors and staff.. Figure JejuNational NationalUniversity. University. Figure1.1.The Thelocation location of Jeju. University Load Information 2.2. 2.2. University Load Information current electricity demand is totally supplied by the island grid system. Based on the real TheThe current electricity demand is totally supplied by the island grid system. Based on the electricity load information of the university, the current study uses the 50%-scaled electricity load real electricity load information of the university, the current study uses the 50%-scaled electricity information of the university. The average electricity demand of the university is computed as 20,300 load information of the university. The average electricity demand of the university is computed as kWh per day, with a peak electricity demand of 1182 kW, equating to a load factor of 0.716.. 20,300 kWh per day, with a peak electricity demand of 1182 kW, equating to a load factor of 0.716. 2.3. University Solar Energy Information. 2.3. University Solar Energy Information. The current study uses the solar resource information collected by NASA. The annual solar The current uses the resource information annual clearness indexstudy is 0.473, and thesolar annual solar radiation 3.999 collected kWh/m2/d.by InNASA. order toThe minimize thesolar 2 /d. In order to minimize the clearness index is(PV)-installation 0.473, and the space annual solar radiation 3.999 kWh/m photovoltaics concern, it is assumed that the rooftops of the buildings in the photovoltaics (PV)-installation concern,photovoltaic it is assumed thatrequires the rooftops of thethe buildings in the university are used. Because aspace 3 kW-capacity panel 7 m2 [34,35], maximum 2 limitation PV panels wasacomputed as about 99,000 kW. panel requires 7 m [34,35], the maximum university areofused. Because 3 kW-capacity photovoltaic. limitation of PV panels was computed as about 99,000 kW. 2.4. University Wind Energy Information. 2.4. University Wind Energy Information The monthly wind speed information was collected by the Korea Meteorological Administration and Because height of the windwas turbine model by used this study is 25 m, the current study TheNASA. monthly windthe speed information collected theinKorea Meteorological Administration uses the average wind speed value between the ground and 50 m above the ground. Based on and NASA. Because the height of the wind turbine model used in this study is 25 m, the currentthe study information, the annual average wind speed is computed as 4.964 m/s (Figure 2).. uses the average wind speed value between the ground and 50 m above the ground. Based on the Sustainabilitythe 2016,annual 8, 877 average wind speed is computed as 4.964 m/s (Figure 2). 6 of 12 information,. Figure usedininthe the simulation. Figure2.2.Wind Windspeed speed information information used simulation.. 3. Key Parameters for the Economic and Environmental Analysis 3.1. South Korea’s Annual Real Interest Rate The current study uses an annual real interest rate of 3.0%, which has been used in the previous feasibility tests in South Korea. Moreover, based on the national renewable energy supporting plans, an annual real interest rate of 1.5% (50% of the reduction of interest program) is also considered in.
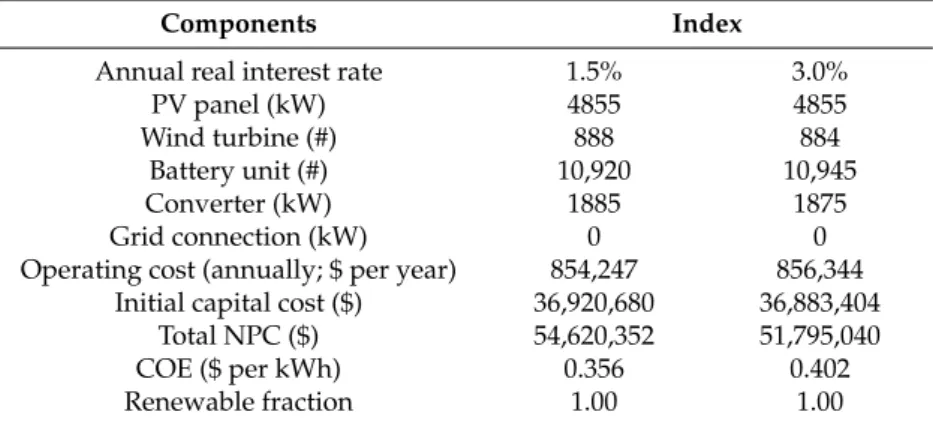
(6) Sustainability 2016, 8, 877. 6 of 12. 3. Key Parameters for the Economic and Environmental Analysis 3.1. South Korea’s Annual Real Interest Rate The current study uses an annual real interest rate of 3.0%, which has been used in the previous feasibility tests in South Korea. Moreover, based on the national renewable energy supporting plans, an annual real interest rate of 1.5% (50% of the reduction of interest program) is also considered in the simulation. 3.2. Three Evaluation Guidelines Three evaluation guidelines are used to evaluate the suggested configuration [34]. First, the renewable fraction of the suggested configuration presented by the simulation should be 1.00 in order to minimize the dependency on the traditional grid system. Second, COE, which is defined as “the consumed cost of a particular generation system in producing 1 kWh of electricity”, is used [34]. Third, NPC, which is “the total cost for establishing, replacing and operating the suggested system in the project lifetime”, is employed [35]. The current study employed 25 years for the lifetime of the project. 3.3. Environmental Parameters Based on the electricity production information of the national grid system, 0.632 kg of carbon dioxide, 0.00274 kg of sulfur dioxide, and 0.00134 kg of nitrogen oxides are reduced when 1 kWh of electricity is eliminated from the traditional grid system. 4. Renewable Electricity Generation Systems Because this study proposes renewable electricity generation systems for Jeju National University, wind turbines, PV panels, battery units, a traditional grid connection, and an electricity converter are considered as potential system components. Therefore, detailed cost information of these components should be included in the simulations [34–36]. The installation and replacement costs for a PV panel are $1800 and $1800, respectively, with an annual managing cost of $25/kW capacity. Moreover, the lifetime of the panel is 20 years when no tracking system is applied. As presented in the previous section, the current study considers the range from 0 to 99,000 kW in the simulation [36]. For the utilization of wind energy, a generic 10 kW wind turbine is considered. This model computes costs of $29,000, $25,000, and $400 for the installation, replacement, and annual operating costs for two turbines, respectively. The hub height and lifetime of the turbine are 25 m and 25 years, respectively. This study considers the range from 0 to 1000 turbines [35,36]. This study employs a Surretts-6CS25P battery model as battery units. This model shows a lifetime throughput of 9645 kWh, nominal voltage of 6 V, and nominal capacity of 1156 Ah. This battery model presents a capital cost of $1229, replacement cost of $1229, and annual operating cost of $10. The current study simulates a range from 0 to 30,000 units [35,36]. In order to convert from AC to DC, an electricity converter should be included. The converter costs $1000, $1000 and $10 for the installation, replacement, and annual management costs for 1 kW capacity, respectively. The converter has a lifetime of 15 years, and an inverter efficiency of 90%. The current study simulates a range of converter capacity from 0 to 3000 kW [34–37]. 5. Results Table 3 shows the optimized configurations of the simulation. Tables 4 and 5 show the total NPC and annualized cost information of the suggested configurations. The proposed configurations achieve a renewable fraction of 100% with COE of $0.356 per kWh (1.5%)–$0.402 per kWh (3.0%) and NPC of $54,620,352 (1.5%)–$51,795,040 (3.0%)..
(7) Sustainability 2016, 8, 877. 7 of 12. Table 3. Optimal simulation configurations. PV: photovoltaic.. COE: cost of energy; NPC: net present cost;. Components. Index. Annual real interest rate PV panel (kW) Wind turbine (#) Battery unit (#) Converter (kW) Grid connection (kW) Operating cost (annually; $ per year) Initial capital cost ($) Total NPC ($) COE ($ per kWh) Renewable fraction. 1.5% 4855 888 10,920 1885 0 854,247 36,920,680 54,620,352 0.356 1.00. 3.0% 4855 884 10,945 1875 0 856,344 36,883,404 51,795,040 0.402 1.00. Table 4. Total net present costs (NPC) of the suggested configurations. Annual Real Interest Rate. Component. Capital ($). Replacement ($). Operation & Management ($). Salvage ($). Total ($). 3.00%. PV Wind turbine Grid Battery Converter System. 8,739,000 12,876,000 13,420,680 1,885,000 36,920,680. 6,488,451 20,613,248 1,507,720 28,609,418. 2,514,843 3,679,804 −6,328,446 2,262,582 390,565 2,519,349. −4,517,229 −8,478,813 −433,051 −13,429,093. 13,225,068 16,555,804 −6,328,446 27,817,700 3,350,234 54,620,356. 1.50%. PV Wind turbine Grid Battery Converter System. 8,739,000 12,818,000 13,451,405 1,875,000 36,883,404. 4,838,575 16,051,752 1,203,492 22,093,820. 2,113,522 3,078,646 −5,288,761 1,905,870 326,497 2,135,773. −3,130,349 −5,889,098 −298,504 −9,317,950. 12,560,749 15,896,647 −5,288,761 25,519,932 3,106,485 51,795,040. Table 5. Annualized costs of the suggested configurations. Annual Real Interest Rate. Component. Capital ($). Replacement ($). O & M ($). Salvage ($). Total ($). 3.00%. PV Wind turbine Grid Battery Converter System. 421,774 621,440 647,728 90,977 1,781,920. 313,155 994,867 72,768 1,380,789. 121,375 177,600 −305,433 109,200 18,850 121,592. −218,017 −409,217 −20,901 −648,134. 638,287 799,040 −305,433 1,342,578 161,694 2,636,167. 1.50%. PV Wind turbine Grid Battery Converter System. 501,862 736,110 772,486 107,677 2,118,136. 277,869 921,818 69,114 1,268,801. 121,375 176,800 −303,722 109,450 18,750 122,653. −179,769 −338,198 −17,142 −535,110. 721,337 912,911 −303,722 1,465,555 178,399 2,974,479. Table 6 presents the electricity production, consumption, and quantity information of the configurations. About 70% of the electricity in the system is produced by wind turbines, and 30% by PV panels. Moreover, 27% of the electricity generated by the system is sold through the grid connection. Table 7 presents the sales volume of the electricity generated from the suggested configurations. Table 8 shows the annual environmental advantages of the suggested configurations. More than 1.7 million kg of carbon dioxide, 7500 kg of sulfur dioxide, and 3700 kg of nitrogen oxides can be reduced annually by using the suggested configuration. Figures 3–5 present the monthly reduced environmental pollutions of the suggested configurations in comparison with the traditional grid system..
(8) Sustainability 2016, 8, 877. 8 of 12. Table 6. Annual electricity production, consumption, and quantity information of the configurations. 3.0% of Real Interest Rate. Production (kWh/Year). Fraction. 1.5% of Real Interest Rate. Production (kWh/Year). Fraction. PV array Wind turbines Grid purchases Total. 6,227,571 13,554,660 0 19,782,230. 31% 69% 0% 100%. PV array Wind turbines Grid purchases Total. 6,227,571 13,615,956 0 19,843,526. 31% 69% 0% 100%. Load. Consumption (kWh/Year). Fraction. Load. Consumption (kWh/Year). Fraction. AC primary load Grid sales Total. 7,403,611 2,761,111 10,164,722. 73% 27% 100%. AC primary load Grid sales Total. 7,403,606 2,776,660 10,180,266. 73% 27% 100%. Quantity. Value (kWh/Year). Quantity. Value (kWh/Year). Excess electricity Unmet load Capacity shortage Renewable fraction. 7,794,651 5840 7395 1.00. Excess electricity Unmet load Capacity shortage Renewable fraction. 7,839,553 5845 7400 1.00. Table 7. Purchasing amounts through the grid connection of the suggested configurations. 3.0% of Real Interest Rate January February March April May June July August September October November December Annual Sustainability 2016, 8, 877. Energy Sold (kWh). Energy Charge ($). 1.5% of Real Interest Rate. Energy Sold (kWh). 315,753 320,229 295,690 222,805 160,620 100,808 187,910 211,874 153,819 232,600 195,519 363,484 2,761,111. −34,733 −35,225 −32,526 −24,509 −17,668 −11,089 −20,670 −23,306 −16,920 −25,586 −21,507 −39,983 −303,722. January February March April May June July August September October November December Annual. 316,334 320,814 297,781 224,242 162,134 102,353 188,652 212,542 154,920 233,785 197,609 365,494 2,776,660. Energy Charge ($). −34,797 −35,290 −32,756 −24,667 −17,835 −11,259 −20,752 −23,380 −17,041 −25,716 −21,737 −40,204 −305,433 9 of 12. Table Table8. 8.Annual Annualpollution pollutionreductions reductions of of the the configurations configurations compared compared to to the the traditional traditional grid system. 3.0% of Real Interest Rate. 3.0% of Real Interest Rate. Pollutants Emissions (kg per Year) Pollutants Emissions (kg per Year) Carbon dioxide 1,745,022 Carbon dioxide 1,745,022 Sulfur dioxide 7565 Sulfur dioxide 7565 NitrogenNitrogen oxides oxides 37003700. 1.5% of Real Interest Rate. 1.5% of Real Interest Rate. Pollutants Pollutants Carbon dioxide Carbondioxide dioxide Sulfur Sulfur dioxide Nitrogen Nitrogen oxides oxides. Emissions (kg per Year) 1,754,849 1,754,849 7608 7608 3721 3721. Emissions (kg per Year). Figure3.3.Monthly Monthlyreductions reductionsin incarbon carbondioxide dioxideemissions emissionswhen whenusing usingthe the suggested suggested configurations. configurations. Figure.
(9) Figure 3. Monthly reductions in carbon dioxide emissions when using the suggested configurations. Figure 3. Monthly reductions in carbon dioxide emissions when using the suggested configurations. 9 of 12. Sustainability 2016, 8, 877. Figure 4. Monthly reductions in sulfur dioxide emissions when using the suggested configurations. Figure4. 4.Monthly Monthlyreductions reductionsin insulfur sulfurdioxide dioxide emissions emissions when when using using the the suggested suggested configurations. configurations. Figure. Figure 5. Monthly reductions in nitrogen oxides emissions when using the suggested configurations. Figure 5. Monthly reductions in nitrogen oxides emissions when using the suggested configurations. Figure 5. Monthly reductions in nitrogen oxides emissions when using the suggested configurations.. 6. Discussion. This study investigates possible renewable electricity production systems for Jeju National University in South Korea. Based on the simulation results, optimal configurations for the university are proposed. The main study findings are presented as follows. Under a real interest rate of 3.0%, the system organized by 4855 kW-capacity PV panels, 884 wind turbines (Generic 10 kW model), and 10,945 battery units with a 1875 kW-capacity converter is suggested. This system shows COE of $0.402 per kWh, NPC of $51,795,040, and annual operating cost of $856,344. In the case of a real interest rate of 1.5%, the system organized by 4855 kW-capacity PV panels, 888 wind turbines (Generic 10 kW model), and 10,920 battery units with a 1885 kW-capacity converter is suggested. This system shows COE of $0.356 per kWh, NPC of $54,620,352, and annual operating cost of $854,247. Considering that Jeju National University annually pays a more than 0.13 million USD electricity bill, the suggested annual costs can be accepted for the university. The initial capital costs are greater than 67% and 71% of the NPC costs under the two cases, respectively, with a capital investment of more than 36.8 million USD. The battery units are the most expensive components of the system. In order to minimize the initial capital investment, the renewable electricity generation system should be installed gradually. For example, PV panels and wind turbines can be installed before the battery units. In this step, the total amount of electricity generated from PV panels and wind turbines can be sold through the grid connection before the battery units are installed and operated. Moreover, in order to reduce the burden on the initial capital costs of the suggested configurations, the supporting plans for renewable energy facilities in South Korea should be applied. In order to reduce the burden of initial capital costs of the suggested configurations, the following steps can be referred:.
(10) Sustainability 2016, 8, 877. • • •. 10 of 12. Stages for gradually installing the suggested components in the system should be planned. The supporting plans and policies operated by South Korean and local governments should be considered and applied. The dependence on renewable electricity generation components will be gradually increased when the dependence of the grid system is reduced.. The suggested configurations from the simulation achieved 100% renewable fraction with a COE of $0.356–$0.402 per kWh. Considering the results of prior research conducted in South Korea ($0.409 per kWh for Kyung-Hee University site; $0.472 per kWh for Geoje island; $0.399 per kWh for Busan metropolitan city; $0.461 per kWh for Daejeon metropolitan city) [35,36,38,39], the introduced configurations show enough competitiveness. 7. Limitations The current study suffers several limitations. First, more detailed renewable-related policies mainly focusing on the supporting plans for the installation and operation of renewable electricity generation facilities could not be considered. For example, the central and local governments of South Korea currently operate several supporting plans for renewable energy facilities located in the areas of educational institutes and islands. Second, the current study uses 50%-scaled electricity load information of Jeju National University, which significantly increases the initial capital cost of the suggested configuration. Based on the present simulation results, future studies can be conducted to further justify the installation of renewable energy facilities. Acknowledgments: This study was supported by the Dongguk University Research Fund of 2015. Support for the UJI Robotic Intelligence Laboratory is provided in part by Ministerio de Economía y Competitividad (DPI2015-69041-R), by Generalitat Valenciana (PROMETEOII/2014/028) and by Universitat Jaume I (P1-1B2014-52). Author Contributions: Eunil Park and Taeil Han conducted the analyses and wrote the majority of the manuscript. Taehyoung Kim revised the manuscript. Sang Jib Kwon and Angel P. del Pobil contributed to the revision of the manuscript and collected the demand data. Conflicts of Interest: The authors declare no conflict of interest.. References 1. 2. 3. 4. 5. 6.. 7. 8.. 9.. Kharecha, P.A.; Hansen, J.E. Prevented mortality and greenhouse gas emissions from historical and projected nuclear power. Environ. Sci. Technol. 2013, 47, 4889–4895. [CrossRef] [PubMed] Steinhauser, G.; Brandl, A.; Johnson, T.E. Comparison of the Chernobyl and Fukushima nuclear accidents: A review of the environmental impacts. Sci. Total Environ. 2014, 470, 800–817. [CrossRef] [PubMed] Hoornweg, D.; Sugar, L.; Gómez, C.L.T. Cities and greenhouse gas emissions: Moving forward. Environ. Urban. 2011, 23, 207–227. [CrossRef] Panwar, N.L.; Kaushik, S.C.; Kothari, S. Role of renewable energy sources in environmental protection: A review. Renew. Sustain. Energy Rev. 2011, 15, 1513–1524. [CrossRef] Park, E.; Ohm, J.Y. Factors influencing the public intention to use renewable energy technologies in South Korea: Effects of the Fukushima nuclear accident. Energy Policy 2014, 65, 198–211. [CrossRef] The Ministry of Trade, Industry and Energy in South Korea. Energy and Green Energy. Available online: http://www.motie.go.kr/motie/py/fe/greenenergy/greeneneregyvision/greenenergyvision.jsp (accessed on 25 June 2016). The Ministry of Trade, Industry and Energy in South Korea. Promotion of New and Renewable Energy. Available online: http://english.motie.go.kr/?p=5444 (accessed on 25 June 2016). Korea Energy Agency. 2015 Energy Statistics Handbook. Available online: http://www.kemco.or.kr/web/ kem_home_new/info/statistics/data/kem_view.asp?sch_key=&sch_value=&c=305&h_page=1&q=19337 (accessed on 25 June 2016). Shin, J.; Woo, J.; Huh, S.Y.; Lee, J.; Jeong, G. Analyzing public preferences and increasing acceptability for the Renewable Portfolio Standard in Korea. Energy Econ. 2014, 42, 17–26. [CrossRef].
(11) Sustainability 2016, 8, 877. 10. 11.. 12. 13. 14. 15.. 16. 17. 18. 19. 20. 21.. 22. 23. 24. 25. 26.. 27.. 28.. 29. 30. 31.. 11 of 12. Kwon, T.H. Rent and rent-seeking in renewable energy support policies: Feed-in tariff vs. renewable portfolio standard. Renew. Sustain. Energy Rev. 2015, 44, 676–681. [CrossRef] The Ministry of Trade, Industry and Energy in South Korea. How to Response Industrial Resource Policies. Available online: http://www.prism.go.kr/homepage/researchCommon/retrieveResearchDetailPopup. do;jsessionid=464647D8ECEC787DE2E38E8223852529.node02?research_id=1411000-201200033 (accessed on 25 June 2016). Jänicke, M. “Green growth”: From a growing eco-industry to economic sustainability. Energy Policy 2012, 48, 13–21. [CrossRef] Kim, S.E.; Kim, H.; Chae, Y. A new approach to measuring green growth: Application to the OECD and Korea. Futures 2014, 63, 37–48. [CrossRef] Sonnenschein, J.; Mundaca, L. Decarbonization under green growth strategies? The case of South Korea. J. Clean. Prod. 2016, 123, 180–193. [CrossRef] Moon, J.H.; Lee, J.W.; Lee, U.D. Economic analysis of biomass power generation schemes under renewable energy initiative with Renewable Portfolio Standards (RPS) in Korea. Bioresour. Technol. 2011, 102, 9550–9557. [CrossRef] Koo, J.; Park, K.; Shin, D.; Yoon, E.S. Economic evaluation of renewable energy systems under varying scenarios and its implications to Korea’s renewable energy plan. Appl. Energy 2011, 88, 2254–2260. [CrossRef] Yoo, S.H.; Kwak, S.Y. Willingness to pay for green electricity in Korea: A contingent valuation study. Energy Policy 2009, 37, 5408–5416. [CrossRef] Ahn, J.; Woo, J.; Lee, J. Optimal allocation of energy sources for sustainable development in South Korea: Focus on the electric power generation industry. Energy Policy 2015, 78, 78–90. [CrossRef] Mathews, J.A. Green growth strategies—Korean initiatives. Futures 2012, 44, 761–769. [CrossRef] Lee, S.K.; Mogi, G.; Kim, J.W. Energy technology roadmap for the next 10 years: The case of Korea. Energy Policy 2009, 37, 588–596. [CrossRef] Chen, W.M.; Kim, H.; Yamaguchi, H. Renewable energy in eastern Asia: Renewable energy policy review and comparative SWOT analysis for promoting renewable energy in Japan, South Korea, and Taiwan. Energy Policy 2014, 74, 319–329. [CrossRef] Park, E.; Yoo, K.; Ohm, J.Y.; Kwon, S.J. Case study: Renewable electricity generation systems on Geoje Island in South Korea. J. Renew. Sustain. Energy 2016, 8, 015904. [CrossRef] Chang, Y.; Fang, Z.; Li, Y. Renewable energy policies in promoting financing and investment among the East Asia Summit countries: Quantitative assessment and policy implications. Energy Policy 2016, 95, 427–436. Park, Y.C.; Kim, D.S.; Huh, J.C.; Kim, Y.G. New and Renewable Energy Policies of Jeju Island in Korea. Available online: http://www.ep.liu.se/ecp/057/vol10/022/ecp57vol10_022.pdf (accessed on 25 June 2016). Jeju Special Self-Governing Province. Carbon Free Island Jeju by 2030. Available online: http://www.ksga. org/down/down.asp?file=Carbon%20Free%20Island%20Jeju%20by%202030.pdf (accessed on 25 June 2016). Jeju Energy Corporation. For Carbon-Free Island. Available online: http://www.jejuenergy.or.kr/index. php/contents/reference/press?act=view&seq=399&bd_bcid=press&q_wops=like&q_wcols=bd_content& q_wvals1=%C8%AE%B4%EB&page=1 (accessed on 25 April 2016). Park, J.; Kim, S. Low Carbon Green Growth Era Effective Renewable Energy of University Sacilities. Available online: http://www.auric.or.kr/user/rdoc/DocRdoc.aspx?returnVal=RD_R&dn=238543#.U8ZhXPl_up9 (accessed on 25 July 2016). National Law Information Center. Energy Management Act. Available online: http://www.law.go.kr/ lsInfoP.do?lsiSeq=169&ancYd=19740104&ancNo=02673&efYd=19740701&nwJoYnInfo=N&efGubun=Y& chrClsCd=010202#0000 (accessed on 25 April 2016). National Law Information Center. Energy Use Rationalization Act. Available online: http://www.moleg.go. kr/english/korLawEng?pstSeq=57721 (accessed on 25 April 2016). Lee, M.K.; Park, H.; Noh, J.; Painuly, J.P. Promoting energy efficiency financing and ESCOs in developing countries: Experiences from Korean ESCO business. J. Clean. Prod. 2003, 11, 651–657. [CrossRef] National Law Information Center. Alternative Energy Development and Promotion Act. Available online: http://www.law.go.kr/lsInfoP.do?lsiSeq=166&ancYd=19871204&ancNo=03990&efYd=19880101& nwJoYnInfo=N&efGubun=Y&chrClsCd=010202#0000 (accessed on 25 April 2016)..
(12) Sustainability 2016, 8, 877. 32.. 33.. 34.. 35. 36. 37. 38. 39.. 12 of 12. National Law Information Center. Act on the Promotion of the Development, Use and Diffusion of New and Renewable Energy. Available online: http://www.law.go.kr/lsInfoP.do?lsiSeq=66131&ancYd= 20041231&ancNo=07284&efYd=20050701&nwJoYnInfo=N&efGubun=Y&chrClsCd=010202#0000 (accessed on 25 April 2016). National Law Information Center. Renewable Energy Act. Available online: http://www.law.go.kr/ lsInfoP.do?lsiSeq=181833&ancYd=20160322&ancNo=14079&efYd=20160923&nwJoYnInfo=N&efGubun= Y&chrClsCd=010202#0000 (accessed on 25 April 2016). Yoo, K.; Park, E.; Kim, H.; Ohm, J.Y.; Yang, T.; Kim, K.J.; Chang, H.J.; del Pobil, A.P. Optimized renewable and sustainable electricity generation systems for Ulleungdo Island in South Korea. Sustainability 2014, 6, 7883–7893. [CrossRef] Park, E.; Kwon, S.J. Solutions for optimizing renewable power generation systems at Kyung-Hee University’s Global Campus, South Korea. Renew. Sustain. Energy Rev. 2016, 58, 439–449. [CrossRef] Park, E.; Kwon, S.J. Towards a Sustainable Island: Independent optimal renewable power generation systems at Gadeokdo Island in South Korea. Sustain. Cities Soc. 2016, 23, 114–118. [CrossRef] Hafez, O.; Bhattacharya, K. Optimal planning and design of a renewable energy based supply system for microgrids. Renew. Energy 2012, 45, 7–15. [CrossRef] Baek, S.; Park, E.; Kim, M.G.; Kwon, S.J.; Kim, K.J.; Ohm, J.Y.; del Pobil, A.P. Optimal renewable power generation systems for Busan metropolitan city in South Korea. Renew. Energy 2016, 88, 517–525. [CrossRef] Park, E.; Kwon, S.J. Renewable electricity generation systems for electric-powered taxis: The case of Daejeon metropolitan city. Renew. Sustain. Energy Rev. 2016, 58, 1466–1474. [CrossRef] © 2016 by the authors; licensee MDPI, Basel, Switzerland. This article is an open access article distributed under the terms and conditions of the Creative Commons Attribution (CC-BY) license (http://creativecommons.org/licenses/by/4.0/)..
(13)
Figure
![Table 1. PEST analysis of the South Korean energy industry [11].](https://thumb-us.123doks.com/thumbv2/123dok_es/3351685.605065/2.892.135.760.446.604/table-pest-analysis-south-korean-energy-industry.webp)
+2
Documento similar
Application of Functional Operators with Shift to the Study of Renewable Systems When the Reproductive Process Is Described by Integrals with Degenerate Kernels.. Oleksandr
aa Department of Nuclear Physics, National Taras Shevchenko University of Kyiv, Kyiv, Ukraine ab Kyungpook National University, Center for High Energy Physics, Daegu, South Korea 11
Therefore, the current study introduces the optimal configuration of renewable energy generation systems for Chiang Mai University, which is one of the largest public universities
In this paper we identify the renewable energy source (RES) demand scenarios for Morocco, the needs of RES installed capacity according to those scenarios and
In this paper, the effects of economic growth and four different types of energy consumption (oil, natural gas, hydroelectric- ity, and renewable energy) on environmental quality
A survey and critique of American Sign Language natural language generation and machine translation systems.. Technical report, University of
• Frequency response and inertia analysis in power systems with high wind energy integration en International Conference on Clean Electrical Power Renewable Energy Resources Impact
International Journal of Electrical Power and Energy Systems Engineering. International Journal of Electrical, Computer, and
