1
Biology Degree
Study of the microbiological
contamination in a gradient of the
Mero River
Guillermo Alberto Smith Ramos
July 2017
3 INDEX
Resumen/Resumo/Summary Key words
1. Introduction
2. Objectives
3. Materias and methods
4. Results
5. Discussion
6. Conclusions
5 RESUMEN
El tramo el río Mero muestreado, comprendido entre la presa de Cecebre (La Coruña) y la depuradora de aguas en A Telva (La Coruña), presentó contaminación fecal en todos los puntos analizados. El rango de concentraciones obtenido fue de 126-294 UFC/mL para E. coli; 299-905 UFC/mL para coliformes totales; 15-48 UFC/mL para Clostridium; 1-45 UFC/mL para Streptococcus faecalis; 200-853 UFC/mL para mesófilos a 37ºC; 68-402 UFC/mL para mesófilos a temperatura ambiente. Uno de los puntos muestreado fue el que presentó el mayor grado de contaminación en todos los parámetros microbiológicos analizados. Esta contaminación parece tener su origen en un efluente (el río Brexa) cuyas aguas vierten en las proximidades del punto muestreado que obtuvo el mayor grado de contaminación. Estos resultados invitan a que las autoridades competentes tomen las medidas oportunas para monitorizar la contaminación del río Mero.
RESUMO
O tramo do río Mero no que se recolleron as mostras, comprendido entre o encoro de Cecebre (A Coruña) e a depuradora de augas na Telva (A Coruña), presentou una contaminación fecal en todos os puntos analizados. O rango de concentracións obtido foi de 126-294 UFC/mL para E.coli; 299-905 UFC/mL para coliformes totais; 15-48 UFC/mL para Clostridium; 1-45 UFC/mL para Streptococcus faecalis; 200-853 UFC/mL para mesófilos a 37ºC; 68-402 UFC/mL para mesófilos a temperatura ambiente. Un dos puntos analizado foi o que presentou o maior grao de contaminación en todo-los parámetros microbiolóxicos analizados. Esta contaminación parece ter a súa orixe nun efluente (o río Brexa) cuxas augas chega ó río Mero nas proximidades do punto analizado que obtivo o maior grao de contaminación. Estes resultados convidan a que as autoridades competentes tomen as medidas oportunas para monitorizar a contaminación do río Mero.
SUMMARY
The sampled stretch of the Mero River, bound between the water-dam in Cecebre (Coruna) and the water-treatment plant in Telva (Coruna), presented faecal contamination in all analysed samples. Concentrations ranged between 126-294 CFU/mL for E. coli; 299-905 CFU/mL for total coliforms; 15-48 CFU/mL for Clostridium; 1-45 CFU/mL for Streptococcus faecalis; 200-853 CFU/mL for mesophiles at 37ºC; 68-402 CFU/mL for mesophiles at room temperature. One of the analysed points presented the highest degree pf contamination in all microbiological parametres analysed. This contamination seems to originate from an effluent (the Brexa River) that pours its waters near the analyzed site that presented the highest contamination concentration. These results warrant authorities to take the necessary steps to monitorize the contamination in the Mero River.
KEY WORDS
6
1. Introduction
Contamination is one of humanity’s greatest challenges for the 21st
century and currently one of the greatest threats to the planet’s ecosystems. The preservation of water reservoirs, particularly those that are important for human consumption, is vital for our society, our economy and our species. And in taking care of them, the externalities that keeping water free from contamination and pollution benefit other species that belong and regulate the niches of ecosystems[1].
According to FAO reports, water quantity and quality will be one of mankind’s greatest challenges by the year 2050[2]. Especially in underdeveloped countries where safely managed drinking-water services are poor and mortality due to unsafe wash services is at its greatest, according to the World Health Organisation statistics report for the year 2017[3]. In many such countries a plethora of diseases are direct results of drinking water contamination. Water contaminated with faecal matter can lead to illnesses such as cholera (Vibrio cholerare), dysentery (Shigella), gastroenteritis (Aeromonas), et cetera. This reality warrants for a special care for continental waters that are used for agricultural, industrial or recreational purposes.
Great strides have been made in human health and technological advances have guaranteed a supply of drinking water in advanced nations. These advances were achieved in large part thanks to the possibility of performing microbiological analysis that allowed for the detection of pathogenic organisms, avoiding the consumption of that water. Within these microbiological analyses the detection of organisms of faecal origin stands out for it is this kind of contamination that introduces pathogens into waters[4]. In this study the faecal contamination in continental water, the Mero River, was tested.
7
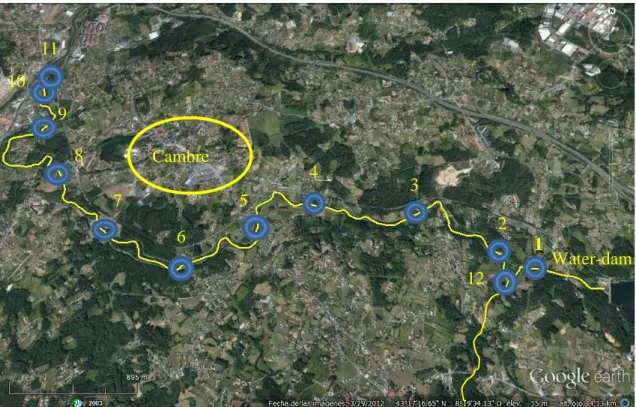
This study of the Mero River focuses on the concentration of microbiological indicators of faecal contamination along a stretch 8,4 km long (Figure 1). This stretch is located between the water-dam (yellow arrow in Figure 1) in Cecebre (Cambre) to the water-treatment plant (Site #10 and Site #11) in A Telva (Cambre) at the mouth of the Burgo Ria. The sampled sites of the designated stretch of the river for this study are shown in Figure 1.
Along this stretch the river is mostly surrounded by forests and fields used by local farmers. Residential houses trickle both sides of the river until As Insúas Bridge, where the first dense residential area is found. The only industrial structure found close to the Mero River is the Norgasa Mill (Site #7), that produces animal food.
2. Objectives
The present study wants to find out if there is a microbial contamination (faecal contamination) in a stretch of the Mero River and the degree of this contamination. A comparison between all sampled sites of the river is carried out with the aim of proving if there are significant differences between all the sampled sites.
3. Materials and methods
Samples were taken from 12 different locations in the studied stretch. Each location was sampled 3 times for statistical purposes and all were analysed in the laboratory of Microbiology at the Faculty of Sciences of the University of Coruña (Spain).
Figure 1. Satellite image representing the sampled stretch of the Mero River. Blue circles indicate the sampled points. Circle 12 indicates where the effluent sample was taken. Source: Google Earth.
8
Sample sites were determined to be as equidistant as possible from one another . Considering that the length of the stretch was 8,4 km long it was decided to divide the river in ten sections. Therefore the average distance obtained was 840 m. With the exception of Site #11, due to Site #10 and Site #11 are located in a restricted swimming zone of the river and for this reason they were collected at <100m apart. Site #12 does not belong to the Mero River
per se, it belong to the effluent Brexa River.
Samples were collected manually in each site. A volume of 400 mL of water per sample was collected in sterile glass bottles and transported to the laboratory under refrigeration. All samples were taken at a depth of 40-50 cm and as close as possible to the middle of the stream following the protocol described by Rodier et al. (2009)[5]. All samples were collected in a span of 4 days and submitted for protocol analyses in less than 24 h after being collected. Temperature for each site was measured in situ using a mercury thermometer and pH was measured in the laboratory using a Crison pH Meter.
Organisms used for this study were mesophiles, Clostridium, Streptococcus faecalis, faecal coliforms and Escherichia coli. Respectively, the mediums used for each organism were:
Plate count agar (g/L)
- Caseine peptone 5,0
- Yeast extract 2,5
- Dextrose 1,0
- Agar 9,0
Final pH 7,0 ± 0,2
*Additional agar was added to the mix in order to get the concentration up to 1,5% to comply with the growth protocol.
Clostridium perfringens selective agar (g/L)
- Sodium sulphite 0,5
- Polymixin (B) sulfate 0,01
- Sodium sulfadiazine 0,12
- Casein peptone 15,00
- Yeast extract 10,00
- Ferric citrate 0,50
- Sodium thioglycolate 0,10
- Polysorbate 80 0,05
- Agar 15,00
Final pH 7,0 ± 0,2 at 25ºC
9 - Proteose peptone 10,000
- Yeast extract 10,000
- Sodium chloride 5,000
- Sodium glycerophosphate 10,000
- Maltose 20,000
- Lactose 1,000
- Sodium azide 0,400
- Bromocresol purple 0,015
- Agar 20,000
Final pH 7,2 ± 0,2
Endo Les Base Agar (g/L)
- Peptone 15,00
- Yeast extract 1,20
- Lactose 9,40
- Sodium chloride 3,70
- Dipotassium phosphate 3,30
- Potassium phosphate 1,00
- Sodium deoxycholate 0,10
- Sodium sulfite 1,60
- Agar 15,00
Final pH 7,2 ± 0,2
Fecal coliforms agar (g/L)
- Tryptose 10,0
- Yeast extract 3,0
- Proteose peptone 5,0
- Bile salts #3 1,5
- Sodium chloride 5,0
- Lactose 12,5
- Aniline blue 0,1
- Agar 15,0
10
All mediums used were a product of Scharlab, S.L. (Barcelona, Spain). Each medium was prepared in the laboratory following the supplier’s instructions.
The procedure for preparing each sample is explained bellow:
The samples destined for the count of mesophiles were submitted to serial dilution until 103. Each dilution was then processed with the pour-plate method: 0,1 mL was pipetted and directly poured onto the agar medium. Samples were spread using a sterile glass rod. Two lots of samples were prepared: one lot was incubated at room temperature and a second lot at 37ºC.
Faecal coliforms, E. coli, Streptococcus faecalis were submitted to the following procedure: samples were diluted by means of serial dilutions up to 103. Each dilution was then filtered through sterile membrane filters HA-type (0,45 µm pore size, Millipore, USA) using a Sterifil Aseptic System (Millipore, USA). The filtered volume was 100 mL and after filtration the membranes with the microorganisms were subsequently deposited in Petri plates where the cultivation medium was placed in advance.Total coliforms were cultivated in the culture chamber for 24h at 37ºC. S. faecalis plates were also cultivated at the same temperature but for 48h due to a slower growth. E. coli plates were cultivated in the culture chamber at 44ºC for 24h.
The samples for Clostridium determination were previously immersed in a bath at 80ºC for 5 minutes with the aim of eliminating vegetative forms.
Clostridium spores are resistant to this process. Then, these samples were submitted to a serial dilution up to 102 and 20 mL of each dilution were placed into Kimax tubes where 20 mL of the Clostridum medium was previously molted and tempered at 50ºC. The medium and sample were mixed in liquid state and allowed to solidify before incubation at 37ºC.
After incubation the colony count was made manually in the laboratory by placing plates on a colony counter with surface-light and a magnifying glass.
All data was collected onto a Microsoft Office 2010 Excel sheet for Microsoft Windows. The data was submitted to an ANOVA and Tukey Test with the purpose of determining if there were significant statistical differences between the sampled points for each microorganism analysed. The test was run on the software SPSS version 24.0.
4. Results
11
differences between all sites for both parameters. However, it’s noted that slight acidification occurs downstream on the studied stretch of the river may be observed. However, temperature presented a greater degree of homogeinity.
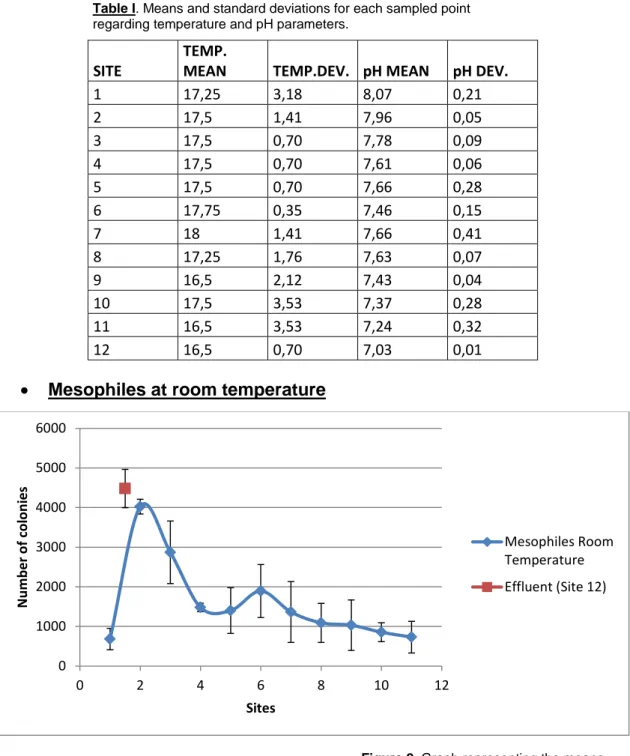
Mesophiles at room temperature
0
Figure 2. Graph representing the means and standard deviations of the data for mesophiles at room temperature. Table I. Means and standard deviations for each sampled point
12 Subset for alfa = 0.05
1 2
1
11
10
9
8
7
5
4
6
3
2
12
Sig. ,424 ,998
Observing Figure 2, an evolution of microorganism concentration can be appreciated, reducing the counts of these microorganisms downstream. In addition, a clear spike in the concentration of mesophiles at room temperature can be observed for Site #2. An immediate drop is followed through Sites #3 and #4. In Site #6 there’s a slight yet noticeable peak in microorganism concentration. Site #12 corresponding with the effluent (Brexa River) had the highest concentration.
Tukey’s Test results (Table II) showed that Sites #1, #3, #4, #5, #6, #7, #8, #9, #10 and #11 were in a subgroup that was significantly different from the subgroup that included Sites #2 and #12.
SI
TES
Table II. Arrangement of sites accord-ing to Tukey’s Test for mesophiles at
room temperature. Each group
con-tains those sites that are not
13
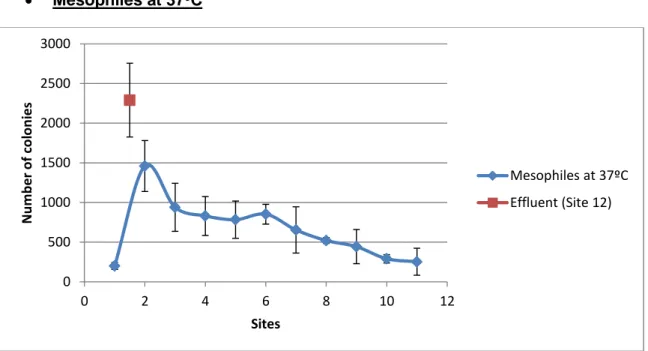
Observing Figure 3, an evolution of microorganism concentration can be appreciated, reducing the counts of these microorganisms downstream. In addition, there’s a clear spike in microorganism concentration in Site #2. From then on it decreases sharply until Site #3, where the decrease continues but with a much smoother slope. In Site #6 there can be seen a gentle increase in
0 2 4 6 8 10 12
Figure 3. Graph representing the means and standard deviations of the
data for mesophiles at 37ºC.
14
concentration before it continues to decrease. Site #12 presented the highest concentration.
Tukey’s Test results (Table III) divide all sampled sites into three subgroups. Differences between most sites are not so clear, except or Site #12, which corresponds to the Brexa River.
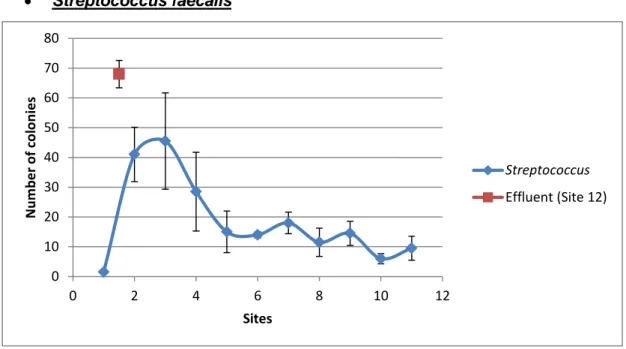
Streptococcus faecalis
Figure 4. Graph representing the means and standard deviations of the data for Streptococcus faecalis.
Table IV. Arrangement of sites according to Tukey’s
Test for Streptococcus faecalis. Each group contains
15
In Figure 4, presence of S. faecalis was confirmed at every sampled site. There’s a sudden spike in microoganism concentration (Sites #2 and #3) before it drops off (Sites #4 and #5). To slight increases are appreciated (Sites #7 and #9). The highest concentration is found in Site #12.
Tukey’s Test for S. faecalis (Table IV) resulted in Sites #2, #3 and #4 of the studied stretch of the Mero River as significantly distinct from the rest of studied sites. Site #12 stands alone in its own group, meaning that it is significantly different from all other sites due to its high concentration.
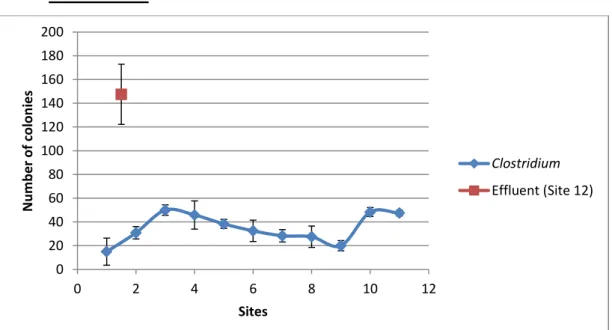
Clostridium
Figure 5. Graph representing the means and standard deviations of the
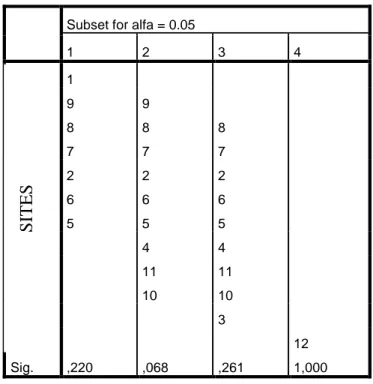
16 Subset for alfa = 0.05
1 2 3 4
1
9 9
8 8 8
7 7 7
2 2 2
6 6 6
5 5 5
4 4
11 11
10 10
3
12
Sig. ,220 ,068 ,261 1,000
In Figure 5 presence of Clostridium was confirmed in all sampled sites. There is a very slight increase in microorganism concentration in Sites #2 and #3 before it gently drops off until there’s a small sudden increase at Sites #10 and #11. The concentration of Site #12, corresponding to the effluent) is far greater than at any other site.
Tukey’s Test results (Table V) do not show that there is a great disparity between all sites from Site #1 to Site #11, but they are all significantly different from Site #12.
S
IT
ES
17
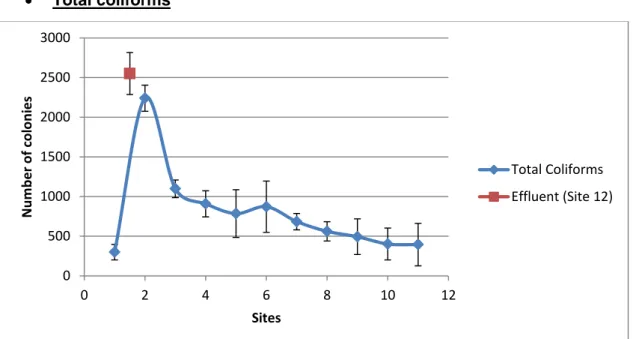
In Figure 6, presence of coliforms was confirmed at every sampled site. There’s a sudden spike in coliform concentration at Site #2. A sharp drop then follows at Site #3 before smoothing the drop at Sites #4 and #5. In Site #6 there is a slight increase before it continues the smooth drop in concentration. The highest recorded concentration was found at Site #12.
0 2 4 6 8 10 12
Figure 6. Graph representing the means and standard deviations of the data for total coliforms.
18
Tukey’s Test results (Table VI) gave 3 subgroups. Subgroups 1 and 2 are not as clearly different from one another as both are from subgroup 3, which includes Sites #2 and #12.
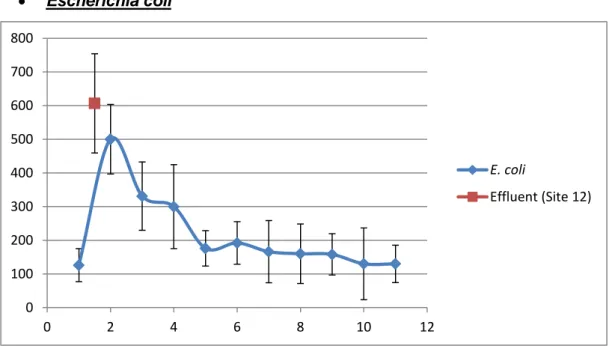
Escherichia coli
Figure 7. Graph representing the means and standard deviations of the
data for E.coli.
Table VII. Arrangement of sites according to
Tukey’s Test for E.coli. Each group contains
19
In Figure 7, presence of E. coli was confirmed in every sampled site. There is a clear sudden spike in E.coli concentration at Site #2. Then the concentration decreases through sites #3, #4 and #5 before stabilizing at a low concentration for the remaining sites. Site #12 has the highest concentration of any point studied for E.coli.
Tukey’s Test results (Table VII) show 3 subgroups that are signifficnatly different from one another. Note that subgroup 3 includes Sites #2, #3, #4 and #12, corresponding to all sites found after the effluent comes into contact with the Mero River and the effluent itself, respectively.
5. Discussion
In all samples the presence of coliforms was obtained, indicating faecal contamination in the studied stretch of the Mero River. No literature regarding legislation on faecal contamination of rivers and other continental waters was available. Comparing the results obtained in this study with Spanish legislation regarding drinking water[6], the Mero River fails to meet any parameter used by the legal protocol by Spanish authorities.
Once the presence of faecal contamination was confirmed, statistical tests were run on the gathered data. First, an ANOVA test to check if there were significant differences between the means obtained for each microorganism at the sampled points. The ANOVA test came out positive, showing that there were significant differences between the means of the groups analysed in this study. According to the results given by Tukey’s Test (Tables II, III, IV, V, VI & VII), the data could be divided into at least two significantly different subgroups along the sample Mero River. One subgroup was most cases just Site #2, which in turn fell into the same subgroup as the effluent, the Brexa River (Site #12). The explanation for this is that Site #2 was the nearest sampling site to the point where the effluent meets the Mero River, thus being the culprit for the sudden increase in faecal contamination. All other sites of the river, in most cases, showed no statistical difference between them.
20
In most graphs there’s a small increase in microbial concentration, though not significant according to Tukey’s Test, at Site #6. This site was located next to a field were a local farmer keeps his cows. Since the cows are less than 50m away from the Mero River, it is likely that their waste seeps through the ground and comes into contact with the water, thus increasing the faecal concentration at that location.
6. Conclusion
It’s clear that a significant ammount of faecal contamination is affecting the studied stretch of the Mero River. Given the fact that the Mero River is a river where local fishing and recreative activities take place, it would be recommended that the public be informed of the state of the Mero River as well as the authorities in order to take measures (such as locating the sources of contamination of the effluents like the Brexa River) .
7. Bibliografía
[1] Larrea Murrell J.A., Rojas Badía M. M., Romeu Álvarez B., Rojas Hernández N. M. & Heydrich Pérez M. (2013). Bacterias indicadoras de contaminación fecal en la evaluación de la calidad de las aguas: revisión de la literatura.
CENIC (Vol. 44).
[2] www.fao.org/land-water/water/en/
[3]www.who.int/gho/publications/world_health_statistics/2017/EN_WHS2017_A nnexA.pdf
[4] Pandey P.K., Kass P.H., Soupir M.L., Biswas S. & Singh V.P. (2014).
Contamination of water resources by pathogenic bacteria. AMB Express 4:51
[5] Rodier J., Legube B. & Merlet N. (2009). Análisis del agua. 9th Edition. Omega. p. 721-727.
[6] Real Decreto 1799/2010, BOE 20.1.2011
[7] Emerson D.J. & Cabelli, V.J. (1982). Extraction of Clostridium perfringens Spores from Bottom Sediment Samples. Applied and Environmental Microbiology. p. 1144-1149.