TítuloMitochondrial activity is modulated by TNFα and IL 1β in normal human chondrocyte cells
17
0
0
Texto completo
(2) Introduction Osteoarthritis (OA) is the most common age-related cartilage and joint pathology. OA is a slowly progressive degenerative disease characterized by degradation of the matrix and cell death resulting in a gradual loss of articular cartilage integrity1,2. The chondrocyte, which is the only cell type present in mature cartilage, is responsible for repairing the damage tissue. Several cytokines may participate in the pathogenesis of cartilage damage by modifying the behavior of chondrocytes. In particular, interleukin-1β (IL-1β) and tumor necrosis factor-α (TNFα) are two of the principal cytokines linked to cartilage destruction3,4,5. However, the exact mechanism by which enhanced cytokine production in the cartilage modulates cartilage degradation remains unclear. Mitochondria are complex organelles that oxidize a wide range of metabolic intermediates. Multienzyme complexes located both in the inner mitochondrial membrane and in the mitochondrial matrix oxidize tricarboxylic acid-cycle intermediates derived from primary nutrients6. The respiratory chain, located in the inner mitochondrial membrane, consists of five multimeric protein complexes: reduced nicotinamide adenine dinucleotide (NADH) dehydrogenase–ubiquinone oxidoreductase (complex I), succinate dehydrogenase (SDH)–ubiquinone oxidoreductase (complex II), ubiquinone–cytochrome c oxidoreductase (complex III), cytochrome c oxidase (complex IV), and adenosine triphosphate (ATP) synthase (complex V). The respiratory chain also requires two small electron carriers, ubiquinone (coenzyme Q10) and cytochrome c6,7. In mitochondrial oxidative phosphorylation, electron transport is coupled by the four enzyme complexes (I–IV) in the mitochondrial inner membrane with ATP synthesis from adenosine diphosphate (ADP) by complex V. The movement of electrons between the first four complexes of the chain produces a proton gradient across the inner mitochondrial membrane, which is one of the factors employed by complex V to generate ATP. Mitochondria are important in regulation of cell survival and the classic signs of cell death are preceded by mitochondrial alterations6,7. Mitochondrial impairment and defective oxidative phosphorylation have been linked to some human disorders8,9,10. Cartilage, due to the absence of vascularization, is living at 2–7% oxygen level, depending on the tissue depth. As a consequence, the activity of the mitochondrial respiratory chain (MRC) is low, compared to vascularized tissues, and most of the ATP molecules are coming from the glycolysis pathway11,12. However, recently we demonstrated that the analysis of MRC activity in OA cells showed a significant decrease in complex II and III activities compared to normal chondrocytes, as well as a reduction in mitochondrial membrane potential (Δψm)13,14. In this sense, different findings implicate a decreased mitochondrial bioenergetic reserve as a pathogenic factor in degenerative cartilage disease 15,16. Based on these results, we postulated that TNFα and IL-1β could contribute to the mitochondrial alteration of chondrocytes and cartilage degradation. In this work, we demonstrate that the exposure of chondrocytes to TNFα and IL-1β modified mitochondrial function through a decrease in the activity of complex I of chain respiratory mitochondrial (CRM) and ATP production, as well as a reduction in Δψm. Besides, we show that the inhibition of complex I in human articular chondrocytes could play a key role in cartilage degradation modulated by TNFα and IL-1β. These data could be of value for a better understanding of the participation of TNFα and IL-1β in the pathogenesis of OA cartilage..
(3) Methods Chondrocyte cultures Normal human cartilage tissue (age 59 ± 22 years) was obtained at autopsy from 52 adults who had no history of joint disease (inflammatory arthritis, OA, microcrystalline arthritis and osteonecrosis). Under aseptic conditions, cartilage slices were removed from the condyles, minced and treated for 15 min with trypsin 0.5 mg/ml (Sigma Chemicals, St. Louis, MO, USA) after which the cartilage was removed from the trypsin and treated with 2 mg/ml clostridial collagenase (Sigma Chemicals) in Dulbecco's modified Eagle's medium (DMEM, Life Technologie, Paisley, UK), overnight at 37°C in an orbital shaker. The digest was centrifuged and the cells were resuspended in fetal calf serum (FCS)-enriched DMEM and cultured in flasks. Subcultures were performed with trypsin–ethylenediaminetetraacetic acid (EDTA) (Gibco) and first-passage cells were used. Cells were made quiescent by 48 h of incubation in the medium containing 0.5% FCS, washed and then stimulated with TNFα or IL-1β (R&D Systems, Abingdon, UK). This study was approved by the Ethics Committee of Galicia (Spain). Measurement of chondrocyte ATP levels To determine intracellular ATP levels, a luminescence ATP detection assay system based on the production of light caused by the reaction of ATP with added luciferase and d-luciferin was employed (ATP, Perkin Elmer, Barcelona, Spain). Briefly, chondrocytes were seeded at 2 × 10⁴ cells per well in 96well plates (Costar, Cambridge, MA, USA). After incubation for 72 h, 50 μl per well of mammalian cell lysis solution at room temperature was added and the plate was shaken for 5 min in an orbital shaker. Then 50 μl of substrate solution was added and the microplate was shaken for another 5 min. The plate was dark-adapted for 10 min; the emitted light was then measured by luminometry in a Micro Beta TriLux (Perkin Elmer). Measurement of the MRC complex activities in digitonin-permeabilized chondrocytes Chondrocytes (3.5 × 10⁶ per 140 mm tissue culture plate) were collected by trypsinization of cells, washed with phosphate buffered saline (PBS) and sedimented at 150g for 5 min at 4°C. The pellet was resuspended in 2 ml of ice-cold solution containing 20 mM 4-morpholinepropanesulphonic acid (MOPS), 0.25 M sucrose and 200 μg of digitonin, per 5 × 10⁶ cells. After 5 min of incubation on ice, the suspension was centrifuged at 5000g for 3 min at 4°C. The pellet was treated with 1.5 ml of 20 mM MOPS, 0.25 M sucrose and 1 mM EDTA buffer, incubated for 5 min and pelleted at 10,000g for 3 min at 4°C. The pellet was resuspended in 200 μl, 10 mM phosphate buffer [potassium phosphate (KP), pH 7.4], frozen and thawed once and then mildly sonicated. These digitonin-permeabilized chondrocyte homogenates (10–50 μl per 1 ml of test volume) were used to measure the activities of the respiratory chain enzymes and citrate synthase (CS) in a DU-650 spectrophotometer (Beckman Instruments, Palo Alto, CA, USA). Incubation temperatures were 30°C for rotenone-sensitive NADH-coenzyme Q1 reductase (complex I), SDH (complex II), antimycin-sensitive ubiquinol cytochrome c reductase (complex III), and CS, and 38°C for cytochrome c oxidase (complex IV). To correct for mitochondrial volume, enzyme activities were normalized to the specific activity of CS17. Briefly, complex I was measured by following the oxidation of NADH at 340 nm in 20 mM KP (pH 8.0), 200 μM NADH, 1 mM NaN3, 0.1% bovine serum albumin (BSA)–EDTA, and 100 μM ubiquinone1 (Sigma Chemicals), in the absence of rotenone (Calbiochem, La Jolla, CA, USA) and then in the presence of 5 μM rotenone so that a rotenone-sensitive rate of NADH oxidation could be calculated. Complex II (SDH) was assessed by following the reduction of 2,6-dichlorophenolindophenol (DCPIP) (Sigma Chemical) at 600 nm in 50 mM Tris–KP (pH 7.0), 1.5 mM potassium cyanide (KCN) 100 μM DCPIP, and 32 mM succinate (Sigma Chemical). Complex III was assayed by measuring the reduction of cytochrome c at 550 nm in 50 mM KP (pH 7.5), 2 mM NaN3, 0.1% BSA–EDTA, 50 μM cytochrome c.
(4) (Roche, Barcelona, Spain) and 50 μM decyl-ubiquinol (Sigma Chemical) in the absence of antimycin A (Sigma Chemical) and then in the presence of 0.01 mg/ml antimycin A, so that an antimycin A-sensitive rate of cytochrome c reduction could be calculated. Complex IV was measured by following the oxidation of reduced cytochrome c at 550 nm in 10 mM KP (pH 7.0) and 80 μM reduced cytochrome (freshly prepared before each experiment by adding sodium dithionite (Sigma Chemical)). CS was evaluated at 420 nm in 75 mM Tris–HCl (pH 8), 100 μM 5,5′-dithiobis-(2-nitrobenzoic) acid (Sigma Chemical), 350 μg/ml acetyl-coenzyme A (Sigma Chemical), 0.5 mM oxaloacetate (Roche), and 0.1% Triton X-100 (Sigma Chemical). Determination of mitochondrial membrane potential (Δψm) To measure the Δψm of chondrocytes, DePsipher (R&D) a lipophilic cation (5, 5′, 6, 6′-tetrachloro-1, 1′, 3, 3′-tetraethylbenzimidazolyl carbocyanine iodide) was used. DePsipher exists as a monomer at low values of Δψm (green fluorescence) and forms aggregates at a high Δψm (red fluorescence). Thus, mitochondria with a normal Δψm concentrate DePsipher into aggregates (red fluorescence), but with a deenergized or depolarized Δψm, DePsipher forms monomers (green fluorescence). Briefly, chondrocytes (5 × 10⁵ cells per well in 6-well plate) were first made quiescent by incubation for 48 h in DMEM with 0.5% FCS, after which basal cells and cells treated with the different stimuli were incubated for 12 h in serum-free medium. As positive control for depolarization valinomycin 1 μM was employed. The chondrocytes, which were collected by trypsinization, were then incubated with 1 μl/ml DePsipher for 20 min at 37°C in a 5% CO2 incubator, sedimented, washed in PBS and analyzed by flow cytometry using FACScan and Cell-Quest software (Becton Dickinson, Mountain View, CA, USA). The analyzer threshold was adjusted on the forward light scatter (FSC) channel to exclude most of the subcellular debris. Photomultiplier settings were adjusted to detect DePsipher monomer fluorescence signals on the FL1 detector (green fluorescence, centered at ∼390 nm) and DePsipher aggregate fluorescence signals on the FL2 detector (red fluorescence, centered at ∼340 nm). Data analyses were performed with Paint-aGate Pro Software (Becton Dickinson). Mean fluorescence intensity values for FL1 and FL2, expressed as relative linear fluorescence channels (arbitrary units scaled from channels 0 to 10,000) were obtained for all experiments. In each experiment, at least 20,000 events were analyzed. RNA isolation and ribonuclease protection analysis Total RNA was extracted from chondrocytes (3.5 × 10⁶ per 140 mm tissue culture plate) by the guanidine isothiocyanate–phenol–chloroform method. The concentration and purity of the RNA samples were determined by spectrophotometry. The probe preparation for the ribonuclease protection assay was carried out according to the instructions of the manufacturer (BD Pharmingen, Heidelberg, Germany). Briefly, single-strand antisense RNA probes, labeled with α [32P]-CTP (Amersham, Çbuckinghamshire, UK) were synthesized from linearized plasmids using T7 RNA polymerase (BD Pharmingen). Approximately 106 cpm of probes were hybridized overnight at 56°C with 10–12 μg of total RNA in 10 μl of hybridization buffer. Unhybridized RNA was digested for 45 min at 30°C in 100 μl RNAse solution. Then, 18 μl of proteinase K cocktail was added to each sample and incubated for 15 min at 37°C to remove the nucleases. The mixture was extracted with phenol/chloroform/isoamyl alcohol and precipitated with ethanol. The protected fragments were analyzed on a 6% TBE–Urea gel (Invitrogen, Paisley, Scotland, UK) and by subsequent autoradiography with X-OMAT AR film (Eastman Kodak, Rochester, NY, USA) with different exposition times form Bcl-2 mRNA and L-32. To quantify the relative amounts of mRNA of Bcl-2, the protected RNA fragments were scanned by bidimensional laser densitometry (Amersham). The data were standardized to the housekeeping gene L-32 (ribosomal protein p32) and the results are expressed as the percentage of basal gene expression as arbitrary densitometric units..
(5) Western-blot After stimulation cells (2.5 × 10⁶ per 100 mm tissue culture plate) were washed in ice-cold PBS, pH 7.5, and lysed in 0.2 M Tris–HCl, pH 6.8 containing 2% SDS, 20% glycerol, 1 μg/ml cocktail inhibitor, and 1 mM phenyl methyl sulfonyl fluoride (PMSF) (Sigma Chemical). Samples were boiled for 5 min and protein concentrations were determined using a BCA reagent assay (Pierce Chemical Co., Rockford, IL, USA). Thirty micrograms of the protein extract was resolved on 12.5% sodium dodecyl sulfate (SDS)-polyacrylamide gels and transferred to polyvinylidene difluoride membranes (Immobilon P, Millipore Co., Bedford, MA, USA). Membranes were first blocked in Tris buffered saline (TBS), pH 7.4 containing 0.1% Tween-20, and 5% nonfat dried milk for 60 min at room temperature and then incubated overnight with anti-Bcl-2 (mouse anti-human Bcl-2, 1:2000, R&D, Abingdon, UK) or anti-Mcl-1 (mouse anti-human Mcl-1, 1:500, Oncogene) in fresh blocking solution at 4°C. After washing, the membranes were incubated with peroxidase conjugated secondary antibodies and developed using an ECL chemiluminescence kit (Amersham). In order to assure that equal amounts of total proteins were charged, we also hybridized each membrane with anti α-tubuline (Sigma Chemical). Cell viability Cell viability (12,000 cells per well in a 96-well plate) was evaluated using a colorimetric assay based on the MTT assay (Roche Diagnostics, Mannheim, Germany). For the colorimetric MTT assay, 10 μl MTT, a soluble tetrazolium salt solution (5 mg/ml in PBS), was added to the wells containing 100 μl medium and the plate was incubated for an additional 4 h. Thereafter, 100 μl of a solubilization solution (10% SDS in 0.01 M HCl) was added to dissolve the water-insoluble formazan salt. Quantification of apoptosis was then conducted with an enzyme-linked immunosorbent assay (ELISA) reader at 570 nm (Amersham). Both pools of cells, floating and attached chondrocytes, were employed in these experiments as well as in the experiments to analyze apoptosis. Histologic study Explants were made with a biopsy punch of 4 mm of diameter, and then they were placed in complete medium and were then incubated for 48 h with rotenone (50 μg/ml). Finally, tissues were fixed in 10% neutral buffered formalin, dehydrated and embedded in paraffin according to a standardized protocol. Sections (6 μm) were placed on SuperFrost Plus slides (Menzel-Glaser, Germany), deparaffinized in xylol, hydrated in a graded series of ethanol, and stained with hematoxylin–eosin or safranin O. Sections were visualized under Olympus BX61 Microscopy. Glycosaminoglycan assay Five explants of cartilage, which were made with biopsy punch of 4 mm of diameter, were cultured for up to 12 days in a 24-well plate with medium alone or with rotenone (50 μg/ml). Every 4 days medium was replaced and new stimuli were added. At day 12 supernatant was recovered and stored at −20°C until further analyzed. The release of proteoglycan was determined in conditioned cultured media as sulfated glycosaminoglycan (GAG) according to the instructions of the manufacturer (Biocolor, Newtownabbey, Northern Ireland). Briefly, reaction between GAG and dye, at acid pH, produces a dye– GAG complex that results in the immediate formation of turbidity, quickly followed by precipitation of the dye–GAG complex within 10 min. Then, GAG-bound dye is recovered to add to each tube 1 ml of dissociation reagent. Finally, the GAG content of the assayed samples is determined by the amount of dye that is recovered from the sulfated GAGs in the test sample that is measured by absorbance to 656 nm and was expressed as ng GAG/mg weight of cartilage..
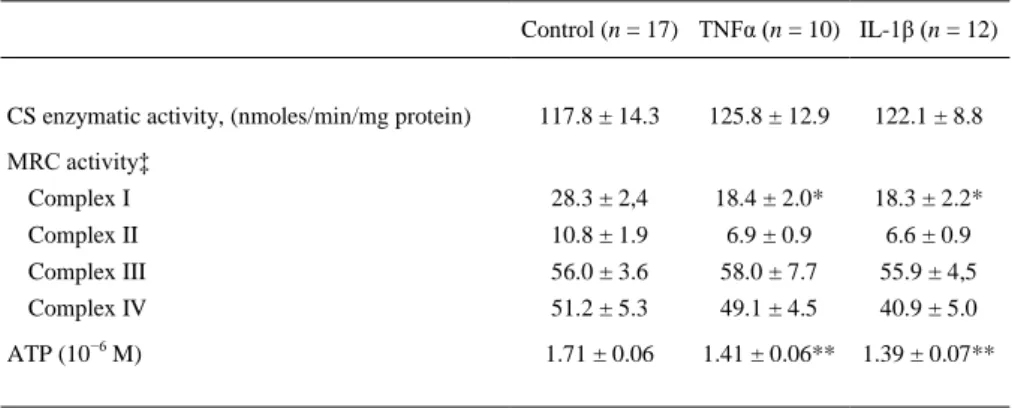
(6) Statistical analyses The data are expressed as the mean ± s.e.m. from determinations (n) or as representative results, as indicated. Individual donors were studied in duplicate or triplicate; cells from different donors were not pooled in any experiment. The statistical software program, SPSS (version 10.0, SPSS, Chicago, IL, USA) was used to perform the analysis of variance (ANOVA) or Tukey test. Differences were considered to be statistically significant at P < 0.05.. Results Effect of cytokines on mitochondria The first set of experiments was focused on studying the effects of both pro-inflammatory cytokines (TNFα and IL-1β) on mitochondrial function by analyzing the activities of the respiratory chain enzyme complexes (I–IV) and CS, ATP synthesis and determining the Δψm. As shown in Table I when chondrocytes are exposed to TNFα (10 ng/ml) and IL-1β (5 ng/ml) for 48 h, the activity of complex I was significantly decreased when compared to basal cells (IL-1β = 18.3 ± 2.2 and TNFα = 18.4 ± 2.0 vs basal = 28.3 ± 2.4, P < 0.01). These reductions represent 35% of the total activity of complex I in basal condition. The mean values for complex II and IV in TNFα and IL-1β stimulated chondrocytes were lower than that in basal cells, but the differences were not statistically significant. The activities of complex III and CS were similar in the three groups. Furthermore, stimulation of cells with both IL-1β (5 ng/ml) and TNFα (10 ng/ml) for 72 h decreased significantly the synthesis of ATP by 19% and 18%, respectively (Table I).. Table I. Modulation of mitochondrial activity induced by TNFα and IL-1β on human chondrocytic cells Control (n = 17) TNFα (n = 10) IL-1β (n = 12). CS enzymatic activity, (nmoles/min/mg protein). 117.8 ± 14.3. 125.8 ± 12.9. 122.1 ± 8.8. Complex I. 28.3 ± 2,4. 18.4 ± 2.0*. 18.3 ± 2.2*. Complex II. 10.8 ± 1.9. 6.9 ± 0.9. 6.6 ± 0.9. Complex III. 56.0 ± 3.6. 58.0 ± 7.7. 55.9 ± 4,5. Complex IV. 51.2 ± 5.3. 49.1 ± 4.5. 40.9 ± 5.0. 1.71 ± 0.06. 1.41 ± 0.06**. 1.39 ± 0.07**. MRC activity‡. −6. ATP (10 M). Confluent chondrocytic cells were incubated for 48 h in basal conditions or in the presence of TNFα (10 ng/ml) or IL-1β (5 ng/ml). MRC complex activities were measured in digitonin-permeabilized chondrocytes as reported in Methods. Values are the mean ± s.e.m. CS = citrate synthase. ‡CS-corrected complex activity is expressed as (nmoles/min/mg protein)/(CS specific activity) × 100. Complex I = rotenone-sensitive NADH-coenzyme Q1 reductase; Complex II = succinate dehydrogenase; Complex III = antimycin-sensitive ubiquinol cytochrome c reductase; and Complex IV = cytochrome c oxidase. *P ≤ 0.01 of stimulated cells vs unstimulated chondrocytes. **P ≤ 0.05..
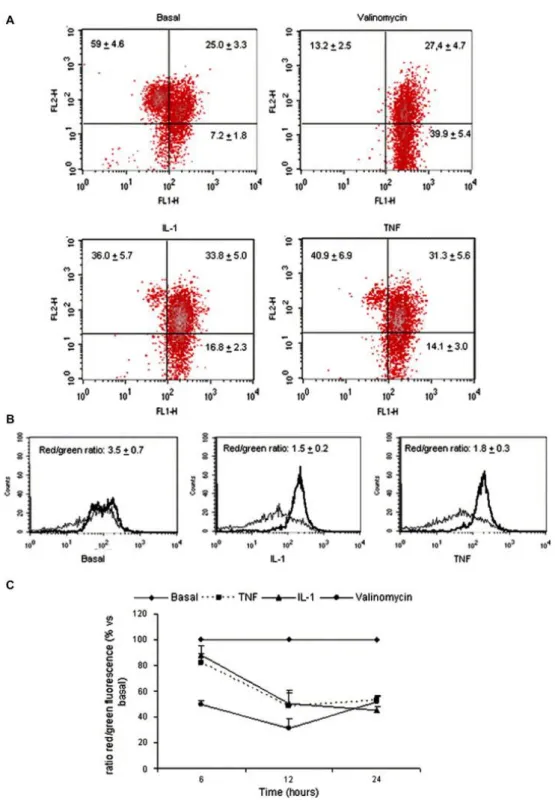
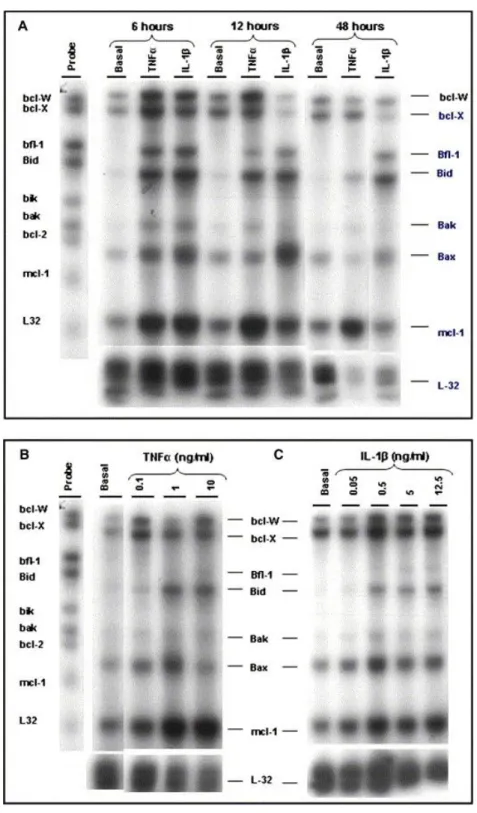
(7) To assess the effect of TNFα and IL-1β on the Δψm of chondrocytes, the fluorescent probe DePsipher was used. The staining pattern of DePsipher for basal chondrocytes was established as the standard. The total cell population could be divided into two subsets: one with an alteration of the Δψm (green fluorescence) and the other with normal Δψm (red fluorescence) [Fig. 1(A)]. Both TNFα (10 ng/ml) and IL-1β (5 ng/ml) caused a definitive decrease in the red/green fluorescence ratio in chondrocytes, indicating depolarization of the mitochondria [Fig. 1(B)]. These results were the consequence of a marked reduction in the percentage of cells with normal mitochondrial polarization (basal = 59 ± 4.6%; IL1β = 36 ± 5.7%; and TNFα = 40.9 ± 6.9%) and by an increased number of cells with mitochondrial depolarization (basal = 7.2 ± 1.8%; IL-1β = 16.8 ± 2.3%; and TNFα = 14.1 ± 3.0%) [Fig. 1(A)]. The mitochondrial depolarization was seen as early as 6 h, peaked at 12 h and was sustained at the highest levels at 24 h [Fig. 1(C)]. As Bcl-2 family proteins constitute a major point control on mitochondria activity, we studied the modulation of Bcl-2 expression by these cytokines. The analysis of the effect of both cytokines on the Bcl-2 family showed mRNA expression and protein synthesis induction. Both TNFα and IL-1β elicited the mRNA expression of the Bfl-1, Bid, Mcl-1 and Bax genes in a time- and dose-dependent manner (Fig. 2). When Bcl-2 protein was evaluated, the results showed that it was induced by TNFα and IL-1β in a time-dependent manner [Fig. 3(A)]. A significant (P < 0.05) effect was detected at 36 h and it increased at 144 h. However, Mcl-1 significantly increased at 6 h and 36 h [Fig. 3(B)]..
(8) Fig. 1. Mitochondrial membrane depolarization induced by TNFα and IL-1β in human chondrocytes. (A) A representative density plot for each condition at 12 h is shown. The numbers represent the percentage of each population. (B) Histograms represent DePsipher fluorescence of normal and TNFα and IL-1β stimulated chondrocytes at 12 h. Relative to basal conditions, the green fluorescence (thick line) increases while red fluorescence (thin line) decreases in TNFα or IL-1β stimulated chondrocytes. The numbers represent the red/green fluorescence ratio values of eight different experiments, each performed in duplicate (mean ± s.e.m.) (P < 0.05 vs control). (C) Confluent human chondrocytes were incubated for the indicated times in medium alone or with TNFα (10 ng/ml) or IL-1β (5 ng/ml) before cells were analyzed by flow cytometry to quantify the mitochondrial membrane potential using 5,5′,6,6′-tetrachloro-1,1′,3,3′-tetraethylbenzimidazolyl carbocyanine iodide (DePsipher). Data acquisition was performed in a FACScan flow cytometer as detailed in Methods. Valinomycin (1 μM) was employed as a positive control for depolarization..
(9) Fig. 2. Time course and dose–response of Bcl-2 family mRNA expression by TNFα and IL-1β in human chondrocytes. Confluent chondrocytes were incubated for the indicated time intervals (6 h, 12 h and 48 h) (A), either in basal conditions or in the presence of TNF (10 ng/ml) or IL-1 (5 ng/ml). Chondrocytes were incubated for 48 h with DMEM alone or with increasing concentrations of TNFα (0.1, 1, and 10) (B) or IL-1β (0.05, 0.5, 5 and 12.5 ng/ml) (C). At the end of the incubation, total RNA was isolated and Bcl-2 family mRNA expression was analyzed by the ribonuclease protection assay as reported in Methods. These blots are representatives of a total of three experiments..
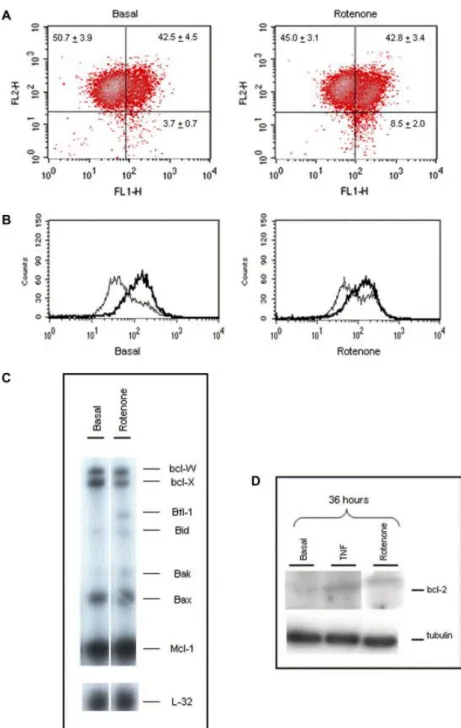
(10) Fig. 3. Time course of Bcl-2 and Mcl-1 protein synthesis by TNFα and IL-1β on human chondrocytes. (A) Confluent chondrocytes were incubated for the indicated time intervals (6 h, 36 h and 144 h) either in basal conditions or in the presence of TNFα (10 ng/ml) or IL-1β (5 ng/ml). Bcl-2 protein was analyzed by Western-blot with rabbit anti-human Bcl-2. One representative blot from three experiments is shown. (B) Confluent chondrocytes were incubated for the indicated time intervals (6 h and 36 h), either in basal conditions or in the presence of TNFα (10 ng/ml) or IL-1β (5 ng/ml). The Mcl-1 protein was analyzed by Western-blot with rabbit anti-human Mcl-1. One representative blot from three experiments is shown.. Inhibition of complex I activity reproduces the effect of TNFα and IL-1β To explain the functional significance of the inhibition of complex I activity by TNFα and IL-1β, several experiments with rotenone, a mitochondrial complex I inhibitor, were conducted. The distribution of the fluorescence in the population of chondrocytes demonstrated that rotenone reduced the cell population with red fluorescence (basal = 50.7 ± 3.9; rotenone = 45.0 ± 3.1) [Fig. 4(A)]. Rotenone caused a significant reduction of the red/green ratio (basal = 3 ± 0.2; rotenone = 1.8 ± 0.13) [Fig. 4(B)]. The study at the molecular level of the effects of rotenone showed that it also increased Bid, Bfl-1 and Mcl-1 mRNA expression, as well as Bcl-2 protein synthesis [Fig. 4(C and D)]..
(11) Fig. 4. Rotenone-induced membrane depolarization and Bcl-2 expression in human chondrocytes. (A) Confluent human chondrocytes were incubated for 12 h in medium alone or with rotenone (50 μg/ml) before cells were analyzed by flow cytometry to quantify the mitochondrial membrane potential using 5,5′,6,6′-tetrachloro-1,1′,3,3′-tetraethylbenzimidazolyl carbocyanine iodide (DePsipher). The numbers represent the percentage of each population. (B) Histograms represent the DePsipher fluorescence of normal and rotenone-stimulated chondrocytes. Relative to the basal conditions, green fluorescence (thick line) increases while red fluorescence (thin line) decreases in rotenone-stimulated chondrocytes. The numbers represent the red/green fluorescence ratio values of eight different experiments, each performed in duplicate (mean ± s.e.m.) (P < 0.05 vs control). For Bcl-2 mRNA expression (C), chondrocytes were incubated for 6 h with DMEM alone or with rotenone (50 μg/ml). At the end of the incubation, total RNA was isolated and processed as described in Methods. This blot is representative of a total of three experiments. (D) Chondrocytes were incubated for the indicated time in medium alone or in the presence of 50 μg/ml rotenone. The whole cell lysate was obtained as described in Methods, and Bcl-2 protein was determined by immunoblot analyses. Tubuline levels were used to confirm the equal loading of samples. This blot is representative of a total of three experiments..
(12) Inhibition of complex I by TNFα and IL-1β is involved in the loss of ECM induced by these cytokines Both, TNFα and IL-1β are able to reduce proteoglycan synthesis and to induce loss of proteoglycan which leads to matrix breakdown18, 19. Thus, we assayed whether inhibition of complex I activity could mediate the effects of both TNFα and IL-1β on the loss of extracellular matrix (ECM) induced by cytokines. Rotenone reduced the proteoglycan content of the ECM in the superficial and middle zones, as shown by safranin O staining in the Fig. 5(B). Quantification of proteoglycans after cartilage stimulation with rotenone showed higher levels of GAG in supernatant compared with no stimulation cartilage [Fig. 5(C)].. Fig. 5. Effect of rotenone on the ECM of human cartilage punches. Cartilage punches were incubated for 48 h in (A) medium alone and (B) rotenone (50 μg/ml). Tissues were stained with safranin O to detect proteoglycans in the ECM. A picture shows that rotenone induces a loss of stain in the superficial and middle zones of the cartilage. (C) Effect of rotenone on GAG's release. Human articular cartilage explants were incubated for 12 days in medium alone or with rotenone (50 μg/ml). At the indicated times GAGs were measured from the supernatants as described under Methods. Data are expressed as ng/mg protein, and represent the mean ± s.e.m. of five independent experiments by duplicate (*P ≤ 0.05 vs control)..
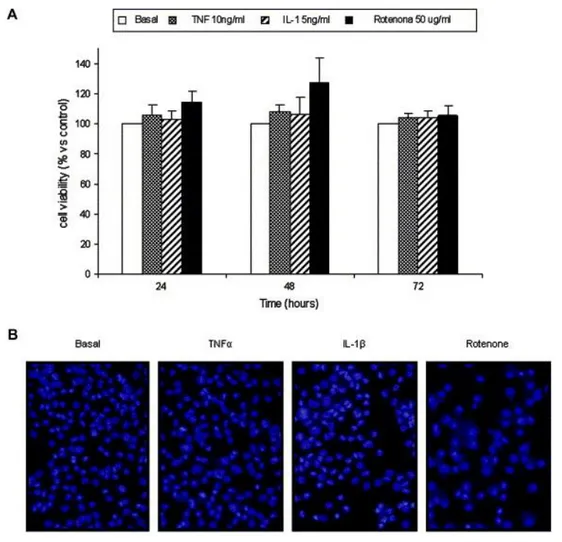
(13) Finally, mitochondria play an important role in apoptosis; both the inhibition of complex I activity and the modification of Δψm are related to the apoptosis process. For this reason, we analyzed the effects of rotenone and both cytokines on cell viability by MTT assay. The results showed that neither stimuli were able to induce cellular death at any concentration and time studied [Fig. 6(A)]. Morphologic studies by 4′, 6-diamidino-2-phenylindole dihydrochloride (DAPI) did not show any cellular change characteristic of apoptosis [Fig. 6(B)]. Additional experiments analyzing apoptosis by flow cytometry (DNA content in propidium iodide stained cells) and by ELISA (DNA fragmentation) confirmed these results (data not shown).. Fig. 6. TNFα, IL-1β and rotenone do not induce cell death in human chondrocytes. (A) Human chondrocytes were incubated in 96well plates in basal conditions or with TNFα (10 ng/ml) or IL-1β (5 ng/ml) or rotenone (50 μg/ml). At 48 h cell viability was evaluated in both floating and attached cells using a colorimetric analyze based on the MTT assay. Data are expressed as percentages with respect to control conditions, and represent the mean ± SE of six independent experiments in triplicate. (B) Fluorescent micrographs are from DAPI untreated cells, and cells treated for 36 h with TNFα (10 ng/ml) or with IL-1β (5 ng/ml) or rotenone (50 μg/ml). All conditions show the normal morphology of chondrocyte nucleus..
(14) Discussion Recently, we demonstrated that the analysis of MRC activity in OA chondrocytes showed a significant decrease in complex II and III activities compared to normal chondrocytes, as well as a reduction in mitochondrial membrane potential (Δψm)13. TNFα and IL-1β are particularly important in the pathophysiology of joint disease. However, the precise contribution of TNFα and IL-1β in mitochondrial alteration of chondrocytes and cartilage degradation remains unknown. This is the first study documenting the effect of both pro-inflammatory cytokines, TNFα and IL-1β, on the activities of the MRC complexes (complex I–IV) and CS, and also on the Δψm in cultured human normal chondrocytes with possible implications for OA. After chondrocytes stimulation with TNFα and IL-1β, activity of complex I was decreased in a 35% vs total activity of complex I (rotenone-sensitive NADH-coenzyme) in basal condition. We measured respiratory chain complexes normalized to CS activity, because this enzyme is considered to be a marker of mitochondrial mass20,21. Therefore, the ratio of the specific respiratory complex/CS activity indicates whether differences in complex activities are due to the enrichment in mitochondrial proteins or result from a change in mitochondrial metabolic function. These results are in agreement with other reported observations showing that MRC complex I was inhibited by TNFα in Myelogenous leukemia cell line22. Similarly, TNFα and IL-1β exposure of the cardiomyocytes resulted in a selective oxygen consumption of the respiratory chain complexes I and II decreased by up to 45% 23. These results differ from those that reported OA chondrocytes show a significant reduction in the activities of complexes II and III13. However, examination in more detail of those results showed a quasi significant reduction in the activity of complex I (P = 0.06). At the same time, the results reported here also show an important numerical reduction in complex II activity with a trend to statistical significance (basal: 10.8 ± 1.9 vs IL-1: 6.6 ± 0.9 and TNF: 6.9 + 0.9). All these data suggest that both complex I and II activities could be reduced in OA chondrocytes and in normal chondrocytes stimulated with TNFα or IL1β, respectively. A possible explanation for the discrepancy with the data reported previously by us, is that TNFα induces a functional modification of complex I activity. This participation of complex I activity in TNFinduced mitochondrial modification could be regulated by substrate availability rather than by a permanent modification of complex I proteins22,24. However, alterations of MRC activities reported by our group in OA are permanent and definitive because they were shown in chondrocytes after several weeks in culture. These permanent modifications can be performed by several mutagen molecules such as nitric oxide (NO) or reactive oxygen species (ROS) localized in the synovial fluid of OA joints at high concentrations25,26. Then it is possible that OA chondrocytes express permanent alteration of complex II and III caused by mutations of DNA, and both cytokines (TNFα and IL-1β) induce a functional and reversible modification in the complex I. The combination of both effects (permanent and functional alteration of mitochondrial complexes) could cause a stronger modification of mitochondrial activity. Inhibition of the MRC by rotenone, a specific inhibitor of complex I, has been widely used to study the role of the MRC in several biologic processes20,24,27,28. In this paper, to explain the functional significance of the inhibition of complex I activity by TNFα and IL-1β, several experiments with rotenone were conducted. Interestingly, rotenone reproduced several effects mediated by both cytokines. It decreased Δψm, increased the Bfl-1 and Mcl-1 mRNA expression and Bcl-2 protein synthesis. Furthermore, rotenone, as well as TNFα and IL-1β, caused depletion of GAGs in the ECM with a histologic pattern similar to described after cartilage stimulation with both cytokines. TNFα and IL-1β are catabolic cytokines involved in cartilage degradation. The involvement of IL-1β in cartilage degradation was established from studies showing that intra-articular administration of IL-1β in rabbit and mouse joints resulted in prolonged loss of proteoglycans from the cartilage3,4,5,18. In this sense, studies in OA animal models have also demonstrated chondroprotective effects of anticytokine therapy18,29. We have confirmed previous results showing that both cytokines in vitro caused a depletion of proteoglycans in the superficial and middle zones of human normal cartilage (data not shown). A possible explanation for the.
(15) depletion of proteoglycans by both cytokines could be the reduction of cell viability. However, we have demonstrated that both cytokines, and also rotenone, in our experimental conditions, are not capable of inducing cell death in chondrocyte. Other mechanisms can explain the effect of both TNFα and IL-1β on the depletion of proteoglycans. Both cytokines are able to reduce proteoglycan synthesis. Biosynthesis of aggrecans requires ATP and nicotinamide adenine dinucleotide phosphate (reduced) (NADPH). Cytokines could induce a decrease of NADPH supply at the level of pentose phosphate pathway, which could in turn take a part in the downregulation of aggrecan synthesis24. Furthermore, cytokines induce matrix metalloproteinases (MMPs) activity, and increase the synthesis of NO or ROS. Inhibition of complex I with rotenone also reduced the proteoglycan content of the ECM in the superficial and middle zones and it increased the release of GAGs from cartilage to supernatant. Under physiological conditions, the MRC is one of the most important sites of ROS production24,26. In chondrocytes ROS are produced in the membrane NADPH-oxidase and in the MRC30. In other cell types, such as macrophages or astrocytes, two sites in the respiratory chain, complex I and complex III, have been suggested to be the major ROS source 31,32. However, the inhibition of complex I by rotenone in human chondrocytes does not modify basal and IL-1-induced NO synthesis (data not shown) as it was reported in other cell types33. Finally, chondrocytes activated by cytokines produce ECM-degrading enzymes; this process is associated with proteoglycan depletion. It was reported that rotenone induced up-regulation of gene sets involved in mitochondrial chaperone activity, protein degradation (proteases), respiratory chain assembly and division34. Several mechanisms to explain the effect of rotenone on gene expression have been described. Rotenone impeded ascorbate biosynthesis, demonstrating a link between complex I activity and synthesis of a key cellular anti-oxidant. The reduction of ascorbate levels may result in markedly increases of oxidized proteins. Furthermore, the activity of the proteosome system degrading oxidized proteins was reduced intensely after treatment with rotenone 35,36. However, the capacity of mitochondria to induce the synthesis of MMPs in human chondrocytes is actually unknown and represents an attractive mechanism currently under study in our laboratory. Cartilage is a tissue influenced by acting factors both in epiphyseal zone (deep zone) and synovial fluid or synovium (superficial zone). Several lines of experimentation suggest that provision of glucose and oxygen supplied from synovial fluid may be critical particularly for chondrocytes in deep zone 11,12, and that an anaerobic glycolysis and lactate production are involved in respiratory metabolism of articular cartilage even in aerobic conditions11,37. In our case, chondrocytes from superficial and deep zones were kept in standard media with high glucose concentration (4.5 mM) and aerobic conditions that could lead to cells to obtain their energy predominantly from an anaerobic glycolysis. For this reason, it is likely that the effect of cytokines observed here, in cultures maintained in normal atmosphere, is even more crucial in vivo, where the mitochondrial activity is probably lower. Taken together, our results indicate that both cytokines, TNFα and IL-1β, modified mitochondrial function by a mechanism involving decrease in the activity of complex I of CRM and ATP production, as well as a reduction in Δψm in human chondrocyte cells. These data suggest that inhibition of complex I may play an important role in the cartilage degradation modulated by TNFα and IL-1β. The present data support the idea that development of complex I activators may represent a novel therapeutic approach for cartilage degradation diseases. These data also could be important for a better understanding of the participation of TNFα and IL-1β in the pathogenesis of inflammatory arthropathies..
(16) Acknowledgments This study was supported by grants from Fondo Investigación Sanitaria-Spain; Expediente 01/1426, 02/1700 and 02/1635. B. Carames was supported by the “Ministerio de Sanidad” (03/1252). B. CilleroPastor is the recipient of a grant from the “Secretaria Xeral IGalicia”. M. Lires-Dean was supported by the “Fondo de Investigación Sanitaria (BEFI)”. M. J. López-Armada was supported by the Ministerio de Ciencia Tecnologia, Programa Ramon y Cajal. The authors express appreciation to the Department of Orthopedics (Dr Ramallal and Mrs Luourdes Sanjurjo) and the Tissue Bank of the CHU Juan Canalejo for providing cartilage samples. We are grateful to Mrs Pilar Cal Purriños for her expert help in the preparation of the manuscript.. References 1.. 2. 3. 4. 5. 6. 7. 8. 9. 10. 11. 12. 13.. 14. 15. 16.. 17.. 18. 19.. 20.. Bullough P. The Pathology of Osteoarthritis. In: Moskowitz, Howell, Goldberg, Mankin, Eds. Osteoarthritis: Diagnosis and Medical/Surgical Mangement. Philadelphia: Saunders WB 1984:39-69. López-Armada MJ, Carames B, Cillero-Pastor B, Blanco FJ. Patogénesis de la Artrosis. Rev Esp Reum 2004;31:379-93. Page Thomas DP, King B, Stephens T, Dingle JT. In vivo studies of cartilage regeneration after damage induced by catabolin/interleukin-1. Ann Rheum Dis 1991;50:75-80. Van der Kraan PM, Van der Berg WB. Anabolic and destructive mediators in osteoarthritis. Curr Opin Clin Nutr Metab Care 2000;3:205-11. Blanco FJ. Catabolic events in osteoarthritic cartilage. Osteoarthritis Cartilage 1999;7:308-9. Green DR, Kroemer G. The pathophysiology of mitochondrial cell death. Science 2004;305:626-9. Green DR, Reed JC. Mitochondria and apoptosis. Science 1998;281:1309-12. Kosel S, Hofhaus G, Maassen A, Vieregge P, Graeber MB. Role of mitochondria in Parkinson disease. J Biol Chem 1999;380:865-70. Leonard JV, Schapira AH. Mitochondrial respiratory chain disorders I: mitochondrial DNA defects. Lancet 2000;355:299-304. Fromenty B, Robin MA, Igoudjil A, Mansouri A, Pessayre D. The ins and outs of mitochondrial dysfunction in NASH. Diabetes Metab 2004;30:121-38. Otte P. Basic cell metabolism of articular cartilage. Manometric studies. Z Rheumatol 1991;50:304-12. Lee RB, Urban JP. Evidence for a negative Pasteur effect in articular cartilage. Biochem J 1997;321:95-102. Maneiro E, Martín MA, De Andrés MC, López-Armada MJ, Fernández-Sueiro JL, Del Hoyo P, et al. Mitochondrial respiratory activity is altered in OA human articular chondrocytes. Arthritis Rheum 2003;48:700-8. Blanco FJ, Lopez-Armada MJ, Maneiro E. Mitochondrial dysfunction in osteoarthritis. Mitochondrion 2004;4:715-28. Terkeltaub R, Johnson K, Murphy A, Ghosh S. Invited review: the mitochondrion in osteoarthritis. Mitochondrion 2002;1:301-9. Johnson A, Svensson CI, Van Etten D, Ghosh S, Murphy AN, Powell HC, et al. Mediation of spontaneous knee osteoarthritis by progressive chondrocyte ATP depletion in Hartley guinea pigs. Arthritis Rheum 2004;50:1216-25. Zeviani M, Gellera C, Antozzi C, Rimoldi M, Morandi L, Villani F, et al. Maternally inherited myopathy and cardiomyopathy: association with mutation in mitochondrial DNA tRNA(Leu)(UUR). Lancet 1991;338:143-7. Goldring MB. Anticytokine therapy for osteoarthritis. Expert Opin Biol Ther 2001;1:817-29. Kobayashi M, Squires GR, Mousa A, Tanzer M, Zukor DJ, Antoniou J, et al. Role of interleukin-1 and tumor necrosis factor alpha in matrix degradation of human osteoarthritic cartilage. Arthritis Rheum 2005;52:128-35. DiDonato S, Zeviani M, Giovannini P, Savarese N, Rimoldi M, Mariotti, et al. Respiratory chain and mitochondrial DNA in muscle and brain in Parkinson’s disease patients. Neurology 1993;43:2262-8..
(17) 21.. 22.. 23.. 24.. 25. 26.. 27.. 28.. 29. 30. 31.. 32.. 33. 34.. 35.. 36.. 37.. Hanson O, Petersen A, Leis M, Nicotera P, Castilho F. Transgenic mice expressing a Huntington’s disease mutation are resistant to quinolinic acid-induced striatal excitotoxicity. Proc Natl Acad Sci U S A 1999;96:8727-32. Higuchi M, Proske RJ, Yeh ET. Inhibition of mitochondrial respiratory chain complex I by TNF results in cytochrome c release, membrane permeability transition, and apoptosis. Oncogene 1998;17:2515-24. Zell R, Geck P, Werdan K, Boekstegers P. TNF-alpha and IL-1 alpha inhibit both pyruvate dehydrogenase activity and mitochondrial function in cardiomyocytes: evidence for primary impairment of mitochondrial function. Mol Cell Biochem 1997;177:61-7. Goossens V, Stange G, Moens K, Pipeleers D, Grooten J. Regulation of tumor necrosis factorinduced, mitochondria and reactive oxygen species-dependent cell death by the electron flux through the electron transport chain complex I. Antioxid Redox Signal 1999;1:285-95. Breimer LH. Repair of DNA damage induced by reactive oxygen species. Free Radic Res Commun 1991;14:159-71. Yook YH, Kang KH, Maeng O, Kim TR, Lee JO, Kang KI, et al. Nitric oxide induces BNIP3 expression that causes cell death in macrophages. Biochem Biophys Res Commun 2004;321:298-305. Li N, Ragheb K, Lawler G, Sturgis J, Rajwa B, Melendez JA, et al. Mitochondrial complex I inhibitor rotenone induces apoptosis through enhancing mitochondrial reactive oxygen species production. J Biol Chem 2003;278:8516-25. Newhouse K, Hsuan SL, Chang SH, Cai B, Wang Y, Xia Z. Rotenone-induced apoptosis is mediated by p38 and JNK MAP kinases in human dopaminergic SH-SY5Y cells. Toxicol Sci 2004;137-46. Zhang X, Mao Z, Yu C. Suppression of early experimental osteoarthritis by gene transfer of interleukin-1 receptor antagonist and interleukin-10. J Orthop Res 2004;22:742-50. Henrotin Y, Kurz B, Aigner T. Oxygen and reactive species in cartilage degradation: friend or foes? Osteoarthritis Cartilage 2005;13:643-54. Fiskum G, Starkov A, Polster BM, Chinopoulos C. Mitochondrial mechanisms of neural cell death and neuroprotective interventions in Parkinson’s disease. Ann N Y Acad Sci 2003;991:111-9 Almeida A, Almeida J, Bolaños JP, Moncada S. Different responses of astrocytes and neurons to nitric oxide: the role of glycolytically generated ATP in astrocyte protection. Proc Natl Acad Sci U S A 2001;98:15294-9. He Y, Imam SZ, Dong Z, Jankovic J, Ali SF, Appel SH, et al. Role of nitric oxide in rotenoneinduced nigrostriatal injury. J Neurochem 2003;86:1338-45. Lister R, Chew O, Lee MH, Heazlewood JL, Clifton R, Parker KL, et al. A transcriptomic and proteomic characterization of the Arabidopsis mitochondrial protein import apparatus and its response to mitochondrial dysfunction. Plant Physiol 2004;134:777-89. Shamoto-Nagai M, Maruyama W, Kato Y, Isobe K, Tanaka M, Naoi M, et al. An inhibitor of mitochondrial complex I, rotenone, inactivates proteasome by oxidative modification and induces aggregation of oxidized proteins in SH-SY5Y cells. J Neurosci Res 2003;74:589-97. Petit PX, Lecoeur H, Zorn E, Dauguet C, Mignotte B, Gougeon ML. Alterations in mitochondrial structure and function are early events of dexamethasone e induced thymocyte apoptosis. J Cell Biol 1995;130:157-67. Spencer CA, Palmer TN, Mason RM. Intermediary metabolism in the Swarm rat chondrosarcoma chondrocyte. Biochem J 1990;265:911-4..
(18)
Figure

+4

Documento similar
Here, we investigated the effect of fluoride- exposure on the reproductive ability of male rats and the relationship of oxidative damage and spermatozoa mitochondrial
Abstract: Transepidermal water-loss (TEWL), stratum-corneum hydration (SCH), erythema, elas- ticity, pH and melanin, are parameters of the epidermal barrier function and
These results demonstrate that MNPs interact with human monocytes without activating the release of pro-inflammatory mediators (Figure 2A), whereas BMNPs significantly trigger
The meta-analysis focused on studying the main effects of different factors on the description-experience gap: over- and under-weighting of rare events in description- and
Effect of cactus seed oil, olive oil, or colza oil treatment on gene expression of the proin- flammatory markers Il-1β (A,D), iNos (B,E), and Il-6 (C,F), in the brain and
In section 3, the effect of spurious transitions on datapath power and the efectiveness of pipelining and partitioning improvements is quantified by a set of case-studies;
Specifically, ERK1/2 can participate in HuR phosphorylation, modifying its activity in a lung cancer cell line (Yang et al., 2004) or HuR cytoplasmic location in hepatic
(C) Phenotype of human B-cells, monocytes, pDCs, and cDCs from healthy controls (HCs) and inflammatory bowel disease (IBD) patients based on the basal expression of CCR2, CD40,
