Elsevier Editorial System(tm) for Cement and Concrete Research Manuscript Draft
Manuscript Number: CEMCON-D-11-00691R1
Title: Rietveld quantitative phase analysis of Yeelimite-containing cements Article Type: Research Paper
Keywords: 4CaO.3Al2O3.CaSO4 Sulfoaluminate
X-Ray Diffraction Amorphous Material Characterization
Corresponding Author: Dr MIGUEL A. G. ARANDA, PhD Corresponding Author's Institution: Universidad de Málaga First Author: Gema Álvarez-Pinazo
Order of Authors: Gema Álvarez-Pinazo; Ana Cuesta; Marta García-Maté; Isabel Santacruz; Enrique R Losilla; Angeles G De la Torre; Laura León-Reina; MIGUEL A. G. ARANDA, PhD
Abstract: Yeelimite-containing cements are attracting attention for their tailored properties. Calcium sulfoaluminate, CSA, cements have high contents of Yeelimite and they are used for special
applications. Belite calcium sulfoaluminate, BCSA or sulfobelite, cements have high contents of belite and intermediate contents of Yeelimite, and they may become an alternative to OPC. Here, we report Rietveld quantitative phase analyses for three commercially available CSA clinkers, one CSA cement, and two laboratory-prepared iron-rich BCSA clinkers. The crystalline phases are reported and quantified. Selective dissolutions are employed for BCSA clinkers to firmly establish their phases. Finally, the overall unaccounted contents (amorphous plus crystalline not quantified) have been determined by two approaches: i) external standard procedure (G-method) with reflection data; ii) internal standard procedure (spiking method with ZnO) with transmission data. The overall
Revised manuscript (CEMCON-D-11-00691) submitted to Cement and Concrete Research 1
Rietveld quantitative phase analysis of Yeelimite-containing cements
2
G. Álvarez-Pinazo1, A. Cuesta1, M. García-Maté1, I. Santacruz1, E. R. Losilla,1 A. G. De la Torre1, 3
L. León-Reina2 and M. A. G. Aranda*,1 4
1
Departamento de Química Inorgánica, Cristalografía y Mineralogía, Universidad de Málaga, 5
29071 Málaga, Spain 6
2
Servicios Centrales de Apoyo a la Investigación, Universidad de Málaga, 29071-Málaga, Spain 7
Abstract. 8
Yeelimite-containing cements are attracting attention for their tailored properties. Calcium 9
sulfoaluminate, CSA, cements have high contents of Yeelimite and they are used for special 10
applications. Belite calcium sulfoaluminate, BCSA or sulfobelite, cements have high contents of 11
belite and intermediate contents of Yeelimite, and they may become an alternative to OPC. Here, 12
we report Rietveld quantitative phase analyses for three commercially available CSA clinkers, one 13
CSA cement, and two laboratory-prepared iron-rich BCSA clinkers. The crystalline phases are 14
reported and quantified. Selective dissolutions are employed for BCSA clinkers to firmly establish 15
their phases. Finally, the overall unaccounted contents (amorphous plus crystalline not quantified) 16
have been determined by two approaches: i) external standard procedure (G-method) with reflection 17
data; ii) internal standard procedure (spiking method with ZnO) with transmission data. The overall 18
unaccounted contents for CSA clinkers were ~10 wt%. Conversely, the unaccounted contents for 19
BCSA clinkers were higher, ~25 wt%. 20
Keywords: 4CaO.3Al2O3.CaSO4; calcium sulfoaluminate; X-Ray Diffraction analysis; Rietveld 21
method; amorphous material 22
*
Corresponding author. Tel.: +34952131874; fax: +34952132000; E-mail address: 23
[email protected] (Miguel A. G. Aranda) 24
*Manuscript
1. Introduction. 25
Calcium sulfoaluminate (CSA) cements have been applied worldwide from the 60‘s as expansive 26
binders mixed with Portland cements [1]. These cements are characterised by containing high 27
amounts of Yeelimite, also called Klein‘s salt or tetracalcium trialuminate sulfate (C4A3S). 28
Hereafter, cement nomenclature will be used, i.e. C=CaO, S=SiO2, A=Al2O3, F=Fe2O3, M=MgO, 29
S=SO3, C=CO2, H=H2O, K=K2O and N=Na2O. Therefore, C4A3S corresponds to Ca4Al6O12(SO4). 30
During the 70‘s, CSA cements were introduced into the Chinese market as high performance and 31
dimensionally stable cementitious matrices developed by China Building Materials Academy [2]. In 32
Europe, the use of CSA cements is strongly limited by the lack of standards concerning special 33
cements derived from non-Portland clinkers. Nevertheless, their manufacture has recently been 34
started by several companies. The main uses of these CSA cements, or blends with Portland 35
cements, are for quick repairs and pre-cast products or floor concrete applications. 36
Moreover, Yeelimite-containing cements have become highly popular over the last few years for 37
research. The driving force for these investigations is much lower CO2 emissions in their 38
manufacture when compared to those of Portland cement production due to the following main 39
reasons [3,4]: i) Yeelimite releases during its synthesis only a third part of the CO2 released by the 40
production of alite, ii) firing temperature is about 200ºC lower than that of OPC clinker, iii) various 41
industrial by-products can be used in the kiln feed, and iv) Yeelimite-containing clinkers are easier 42
to grind than OPC clinkers. The improvement of cement performances and the reduction of the 43
environmental impact related to its manufacture are most likely the main areas of innovation for the 44
cement industry [5]. It must be highlighted that CSA cements may have important special 45
applications such radioactive element encapsulation in high-density cement pastes [6]. Other 46
low solution alkalinity as well as high impermeability and chemical resistance against several 48
aggressive media [7]. 49
However, while the composition of Portland cement is defined by long-standing codes and 50
standards, there is no corresponding compositional framework for Yeelimite-containing cements. 51
These clinkers may show very variable phase assemblage. The raw mix composition can be based 52
on conventional raw materials (limestone, clay, bauxite and iron ores); in addition, industrial by-53
products and wastes can also be added [8,9]. Yeelimite-containing cements could be classified 54
according to their C4A3S contents as: 55
I) Calcium Sulfo-Aluminate (CSA) cements which would refer to those with high C4A3S 56
contents. They may be prepared from CSA clinkers containing C4A3S as the main phase ranging 57
between 50 to 90 wt% [10]. The calcium sulfate addition is very important as it may profoundly 58
affect the properties of the resulting binder [11-13]. The calcium sulfate source and content have 59
to be customized for a given application. These cements can be used alone or in combination 60
with other cements to provide an improved early resistance, low shrinkage, high 61
impermeability, and a strong resistance to sulfate attack. 62
II) Belite Calcium Sulfo-Aluminate (BCSA) cements which would refer to those with C2S 63
(belite) as the main phase and intermediate C4A3S contents. These cements, also known as 64
sulfobelite, are prepared from clinkers containing more than 40-50 wt% of C2S and 20-30% 65
C4A3S. The most common formulation of BCSA clinkers consists on -C2S, C4A3S and C4AF 66
[6, 14-18]. These are iron-rich BCSA cements, also termed as BCSAF, and they are produced at 67
~1250ºC and show a rapid hardening, excellent durability, self-stressing and volume stability, 68
depending on the amount of gypsum added [19]. Recently, a new class of BCSAF cement has 69
polymorphs (-forms) has been promoted (for instance with borax) to enhance early age 71
hydration of these cements. 72
Alternatively, in order to further enhance mechanical strengths at very early ages, <1 day, C4AF 73
phase may be substituted by C12A7; however, the clinkering temperature should be increased 74
~100ºC and the durability with respect to sulfate attack is limited [22,23]. This formulation 75
corresponds to aluminium-rich BCSA clinkers (or BCSAA) with C2S, C4A3S, C12A7 and CA as 76
main phases [24]. In this type of clinkers, aluminate phases and C4A3S are responsible for the 77
early strength development, while C2S provides hardening at much later ages. An in-situ study 78
of the clinkering of both BCSAF and BCSAA samples has been very recently reported using 79
high-energy synchrotron X-ray powder diffraction [25]. 80
III) Alite Calcium Sulfo-Aluminate (ACSA) cements which would correspond to those 81
characterized by the simultaneous presence of C3S and C4A3S phases. In this special case, 82
Yeelimite phase content may be even higher than that of alite [26]. Other phases may appear in 83
the clinkers including C2S and C3A. However, this type of clinker is quite difficult to prepare 84
because the optimum temperatures for the synthesis of the two phases differ considerably. 85
Nevertheless the addition of a small amount of CaF2 (and/or CuO, TiO2) to the raw mixes 86
allows the coexistence of both phases at temperatures between 1230 and 1300°C. 87
CSA and BCSA clinkers are complex materials due to the presence of many crystalline phases, 88
some of them also displaying polymorphism. X-ray powder diffraction (XRPD) is the most 89
appropriate technique to identify, characterize and quantify the crystalline phases within these 90
samples. The application of Rietveld methodology [27] to XRPD data in order to obtain quantitative 91
phase analyses (RQPA) was reported long time ago [28]. To derive the phase contents from the 92
Rietveld optimised scale factors, this methodology normalizes the results to 100% of crystalline 93
has an appreciable amount of amorphous phase, this method is considered as semi-quantitative. To 95
overcome this problem, two approaches have been developed, the internal and the external standard 96
methods (to be briefly described just below). The presence of a glassy or amorphous component in 97
Portland cements and clinkers has been debated by several authors [29-31]. 98
I) Internal standard method or ―spiking method‖, which consists on the addition of a known 99
amount of a crystalline standard, Wst. This standard must be free of amorphous content or at 100
least it should contain a known non-diffracting content. This (artificial) mixture must be well 101
homogenised since the particles should be randomly arranged. The addition of the standard will 102
dilute the crystalline phases within the samples, hence this may be a problem for low-content 103
phases. A procedure for Rietveld quantitative amorphous content analysis was outlined 104
elsewhere [32] and the effects of systematic errors in the powder patterns were studied. A very 105
recent report uses this methodology in depth [33]. This method permits the determination of an 106
overall unaccounted content which is composed by amorphous phase(s), misfitting problems of 107
the analysed crystalline phases, and because some crystalline phases may not be included in the 108
control file due to several reasons (its crystal structure is not known, the phase was not 109
identified, etc.). This overall content is hereinafter named ACn which stands for Amorphous and 110
Crystalline quantified, to highlight that not only an amorphous fraction but any not-111
computed crystalline phase and any misfit problem (for instance the lack of an adequate 112
structural description for a given phase) may contribute to this number. 113
II) External standard method (G-factor approach), which consists in recording two patterns (one 114
for the sample and another for the standard). It is possible to use an external standard method to 115
avoid the complications that may arise from mixing an internal standard with the sample. This 116
approach requires the recording of two patterns in identical diffractometer 117
proposed by O‘Connor and Raven [34] and very recently applied to anhydrous cements [35] and 119
to pastes [36]. This methodology is also known as G-method since the standard allows 120
calculating the factor of the diffractometer in the operating conditions. This calculated G-121
factor represents a calibration factor for the whole experimental setup and comprises the used 122
diffractometer, radiation, optics, and all data acquisition conditions (f.i. detector configuration, 123
integration time, etc.). It is experimentally more demanding but it may have the brightest future 124
as it does not interfere with the hydration reactions. 125
In this work, we report Rietveld quantitative phase analysis for several Yeelimite-containing 126
clinkers and cements. Both CSA and BCSAF clinkers have been studied to illustrate the suitability 127
of Rietveld methodology. Furthermore, the ACn contents have been determined using both 128
strategies, internal and external standard procedures. The obtained results are discussed. 129
2. Experimental section. 130
2.1. Material description. 131
In this work, six different types of Yeelimite-containing samples have been investigated. Three of 132
them are commercially available CSA clinkers. A CSA cement prepared in an industrial trial, but 133
not commercially available, has been also studied. Finally, two BCSAF clinkers prepared in our 134
laboratory have been also analysed. 135
2.1.1. Commercial CSA clinkers. 136
The following commercial clinkers with high C4A3S contents (ranging between 55 to 70 wt%) have 137
been studied: 138
- ALIPRE® (2009), a CSA clinker industrially produced by Italcementi Group. 139
- BELITH_CS10, a CSA clinker industrially produced in China and marketed in Europe by Belith 140
- S.A.cement, a CSA clinker industrially produced by Buzzi Unicem. 142
2.1.2. Non-commercial CSA cement. 143
It has also been studied a CSA cement, with ~ 40% C4A3S, produced in an industrial trial which is 144
not commercially available. This cement is named CSA_trial in this study. 145
2.1.3. Laboratory-prepared BCSAF clinkers. 146
Approximately two kilograms of two BCSAF clinkers have been prepared in our laboratory in 147
several steps. The raw materials were weighed to have an expected phase composition of 50 wt% 148
C2S, 30 wt% of C4A3S and 20 wt% of C4AF. Table 1 shows the amounts of raw materials used for 149
the preparations. The difference in both samples is the addition of borax in one of them, 2 wt% 150
expressed as B2O3 in the resulting clinker. Hereafter, these clinkers are named BCSAF_B0 and 151
BCSAF_B2, for boron-free and boron-containing clinker, respectively. The raw materials mixture 152
(approximately 3 kilograms) was pre-homogenised for 15 minutes in a micro-Deval machine 153
(A0655, Proeti S.A., Spain) at 100 rpm with steel balls (9 balls of 30 mm, 21 balls of 18 mm and a 154
number of balls of 10 mm up to a total ball weight of 2500 g). The mixture was pressed into pellets 155
of about 40 g (55 mm of diameter and approximately 5 mm of height). Six pellets, one on top of 156
each other, were placed in a large Pt/Rh crucible of 325 ml of volume. The pellets were heated at 157
900ºC and held for 30 min (heating rate of 5 ºC/min). Then, they were further heated at 1350ºC and 158
held for another 30 min (heating rate of 5 ºC/min). Finally, the samples were quenched with air 159
flow. The clinkered pellets were grinded in the micro-Deval mill at 100 rpm for 1 hour. Under these 160
milling conditions, all clinker material passed through a 250 m sieve. 161
2.1.4. Selective dissolution of laboratory-prepared BCSAF clinkers. 162
Selective dissolutions have been performed to study the laboratory-prepared BCSAF clinkers [37]. 163
Selective dissolution to remove the aluminate phases (silicate residue). A solution composed of 165
60 ml demineralised water, 8 g of KOH and 8 g of sucrose was heated to 95 °C with magnetic 166
stirring in a 250 ml beaker. After around 30 minutes, it becomes brown-yellow. Then, 4 g of clinker 167
powder was added and kept under stirring for 15 minutes. After this treatment, the resulting 168
suspension was filtered with a Whatman system (Whatman filter with diameter 70 mm). Once this 169
initial filtration step was finished, the minimum amount of water was added to eliminate the sucrose 170
and finally the residue was rinsed twice with isopropyl alcohol to remove water. After filtration, the 171
residue was mashed with a spatula to break up agglomerated particles, dried and analyzed by 172
XRPD. 173
Selective dissolution to remove the silicate phases (aluminate residue). A mixture of 4 g of 174
clinker powder, 52 ml methanol and 24 g salicylic acid was prepared. This mixture was stirred in a 175
250 ml beaker with a glass cover for 50 minutes. After that treatment, the mixture was filtered with 176
a Whatman system (Whatman filter with diameter 70 mm) and rinsed with ethanol. The residue was 177
dried in an oven at 60ºC for 30 minutes, ground and analyzed by XRPD. 178
2.2. Analytical techniques. 179
2.2.1. Elemental analysis by X-ray fluorescence. 180
Table 2 gives the elemental analysis for the 6 studied samples prepared as fused beads. The X-ray
181
fluorescence (XRF) data were taken in a Magic X spectrometer (PANalytical, Almelo, The 182
Netherlands) using the calibration curve of silica-alumina materials. The elemental analyses of the 183
raw materials used for the BCSAF clinker preparations are available upon request, but they are not 184
reported here since the analyses of the clinkers are provided. 185
The amounts of Na2O and B2O3 in the laboratory-prepared BCSAF clinkers were determined by 187
ICP-MS on Perkin Elmer spectrophotometer (Nexion 300D). Previously, the samples were digested 188
in an Anton Paar device (Multiwave 3000) by using HNO3, HCl and HF. 189
2.2.3. Laboratory X-ray powder diffraction. 190
All six samples were studied by laboratory X-ray powder diffraction (LXRPD) to identify, 191
characterize and quantify the crystalline phases. In order to study the ACn contents, both internal 192
and external standard approaches were employed. 193
On the one hand, the patterns studied by the external standard method were recorded in Bragg-194
Brentano reflection geometry (/2) on an X'Pert MPD PRO diffractometer (PANalytical B.V.) 195
using strictly monochromatic CuKα1 radiation (λ=1.54059Å) [Ge (111) primary monochromator]. 196
In addition to the patterns for the samples to be studied, this approach requires the recording of 197
additional patterns collected in identical diffractometer configuration/conditions for the standard, in 198
this case -Al2O3 (SRM-676a). The X-ray tube worked at 45 kV and 40 mA. The optics 199
configuration was a fixed divergence slit (1/2°), a fixed incident antiscatter slit (1°), a fixed 200
diffracted anti-scatter slit (1/2°) and X'Celerator RTMS (Real Time Multiple Strip) detector, 201
working in scanning mode with maximum active length. Data were collected from 5º to 70° (2θ) for 202
2 hours. The samples were rotated during data collection at 16 rpm in order to enhance particle 203
statistics. NIST standard reference material SRM-676a, corundum (-Al2O3) powder, has been 204
certified to have a crystalline phase purity of 99.02% 1.11% (95% confidence interval) by RQPA 205
against a suitable primary standard, powder silicon carefully prepared from a single crystal [33]. 206
On the other hand, the patterns studied by the internal standard method were recorded in flat-207
sample transmission geometry on an EMPYREAN diffractometer (PANalytical B.V.) equipped 208
component is capable of converting the divergent beam into a convergent radiation focused on the 210
goniometer circle. The EMPYREAN diffractometer was equipped with fixed incident and diffracted 211
beam anti-scatter slits of ¼ º and 5 mm, respectively. The detector was PIXCEL 3D RTMS, which 212
comprises more than 65000 pixels, each 5555 microns in size; each having its own circuitry. As 213
internal standard, ZnO (99.99%, Sigma-Aldrich, St. Louis, MO, USA), was added to the samples to 214
a total content of 25 wt%. The mixtures were homogenized for 20 minutes in an agate mortar. The 215
powder samples (mixed with ZnO) were placed in the holders between two Kapton films. The 216
cylindrical sample diameter and thickness were ~10.0 mm and ~0.3 mm, respectively. The overall 217
measurement time was ~3 h per pattern to have very good statistic over the 2θ range of 5-70º with 218
0.0131º step size (2). 219
2.2.4 XRPD data analysis. 220
Powder patterns of the samples were analyzed by the Rietveld method as implemented in the GSAS 221
software package [38] by using a pseudo-Voigt peak shape function [39] with the asymmetry 222
correction included [40] to obtain Rietveld Quantitative Phase Analysis (RQPA). The refined 223
overall parameters were: phase scale factors, background coefficients, unit cell parameters, zero-224
shift error, peak shape parameters and preferred orientation coefficient, if needed. March-Dollase 225
ellipsoidal preferred orientation correction algorithm was employed [41]. In addition to these 226
parameters, and only for the Rietveld refinements of transmission powder data, a flat-sample 227
absorption coefficient was also optimized as implemented in GSAS. Table 3 reports the crystal 228
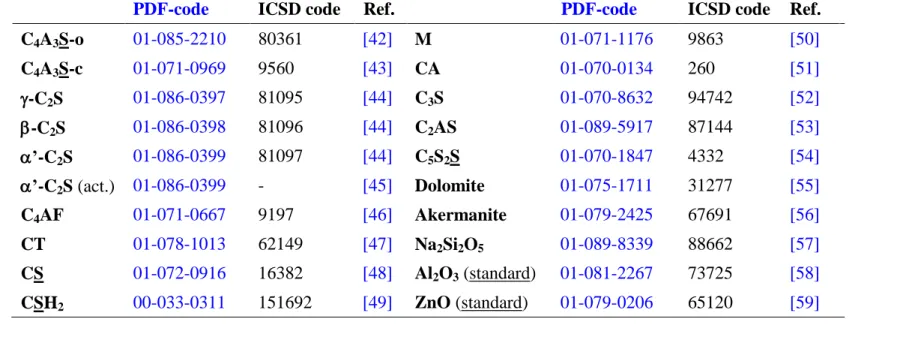
structures used in this study to simulate the crystalline phase powder patterns [references 42-59]. 229
The powder diffraction file (PDF) codes for all identified phases in the studied cements are also
230
given in Table 3.
The output of a RQPA study for a sample with m-crystalline phases is a set of m-crystalline phase 232
scale factors, mS. A phase scale factor, S, is related to the phase weight content, W, by 233
equation 1 [28]. 234
S = Ke
s ) ZM V (
W
(1) 235
Where Ke is a constant which depends on the diffractometer operation conditions, s is the sample 236
mass absorption coefficient, Z is the number of chemical units/formulas within the unit cell of -237
phase, M is the molecular mass of the chemical formula for -phase, and V the unit cell volume for 238
-phase. Once the crystal structure is known, the ‗ZMV‘ term is known. The parameter of interest, 239
W, depends on the phase scale factor, S, but also on Ke and s. Unfortunately, these two variables 240
are not known and they can not derived from the single powder diffraction pattern of the sample 241
under study. 242
Currently, there are three main ways to derive the phase content, W, from the Rietveld refined
243
scale factor, S. These three methods are based on different mathematical approaches and they have
244
different experimental complexities. They are very briefly discussed below. 245
2.2.4.1 Normalization to full crystalline content method. 246
The simplest approach is the approximation that the sample is only composed of crystalline phases 247
with known structures. These crystal structures are used to compute the powder pattern with any 248
Rietveld program code, in this case GSAS. Under this approximation, W is given by equation (2)
249
[28]: 250
W =
m
1 i
i
i(ZM V)
S ) ZM V ( S
The use of equation (2) in RQPA eliminates the need to measure the instrument calibration 252
constant, Ke, and the sample mass absorption coefficient, s. However, the method normalizes the 253
sum of the analysed weight fractions to 1.0. Thus, if the sample contains amorphous phases, and/or 254
some amounts of unaccounted crystalline phases, the analysed weight fractions will be 255
overestimated. This approach is by far the most widely used method in RQPA. However, it must be 256
highlighted that the resulting weight fractions are only accurate if the ACn amount is very small 257
(negligible). 258
2.2.4.2 External standard method (G-factor approach). 259
One possibility to quantify the amount of the ACn content is to use the G-factor approach by 260
employing a suitable external standard. In this approach, the diffractometer constant, Ke, is 261
calculated according to equation 3 (in this case the standard was NIST Al2O3) [34]: 262
G = Ke = Sst
st st 2 st st
W
V
(3) 263
where Sst is the Rietveld scale factor of the (external) standard, st is density of the standard, Vst is 264
the unit cell volume of the standard, Wst is weight fraction the standard (in our case 100 wt%), all 265
values derived from the Rietveld refinement of the external standard pattern collected in identical 266
conditions than those of the cements. μst is the mass attenuation coefficient of the standard. This G-267
factor (the average of three independent measurements) was used to determine the mass 268
concentration of each phase in the RQPA of the Yeelimite-containing cements by equation 4: 269
W = S
G V2 s
(4) 270
This method allowed determining the absolute weight fractions by previously obtaining the 271
These values were independently determined by X-ray fluorescence analysis from data in Table 2. 273
The calculated G factor for NIST Al2O3, as well as selected structural details of the used standard, is 274
given in Table 4. The mass attenuation coefficients (MAC) of the individual oxides (calculated with
275
the HighScore Plus 2.2 program) were given in Table 2. Furthermore, the MAC values of the six
276
studied samples were also given in that Table.
277
2.2.4.3 Internal standard method. 278
An alternative method to quantify the ACn content is to use the internal standard method. In this 279
approach, the sample is spiked with an appropriate standard that should fulfil at least three 280
conditions. It must have an absorption coefficient close to the sample, negligible ACn content, and 281
small average particle size in order to be easily homogenised with the sample under study. In our 282
case, ZnO was used as internal standard. This compound was selected because its MAC value,
283
50.34 cm2/g, yields a linear attenuation coefficient, 285 cm-1, very similar to those of the analysed
284
cements. Furthermore, its particle size is small, approximately 0.5 m as determined by scanning
285
electron microscopy; its face-centred crystal structure gives a very simple pattern avoiding strong
286
overlapping with the diffraction lines of the studied cements; and a previous study [60] showed very
287
small, if any, ACn content.
288
A simple Rietveld refinement using the methodology explained in section 2.2.4.1 will yield a set of 289
weight fractions normalized to 100%. However in this case, in addition to the weight fractions of 290
the phases in the sample, the Rietveld refined weight fraction of the standard, Rst, is also obtained. It 291
should be kept in mind that the weight fraction added of the internal standard is precisely known, 292
Wst. If the sample contains ACn, Rst will be (much) larger than Wst. From this overestimation, the 293
overall ACn content is derived according to equation (5) [32]: 294
ACn =
st st st
W 00 1
R / W -1
10
4
Once the overall ACn content of the sample under study, ACn, is known, the initial RQPA can be 296
recalculated to yield the real sample phase contents. All details for these calculations have been 297
already reported [32]. Furthermore, the errors associated to this approach and the optimum amount 298
of standard has been recently discussed [61]. 299
3. Results and discussion. 300
3.1. Standard RQPA of Yeelimite-containing clinkers/cement. 301
Three commercial CSA clinkers (ALIPRE®, BELITH_CS10 and S.A.cement), one CSA cement 302
(CSA_trial) and two laboratory-prepared BCSA clinkers (BCSAF_B0 and BCSAF_B2) have been 303
analyzed by LXRPD. Table 5 reports the direct RQPA results (wt%) obtained for these samples 304
where Rietveld results were normalized to 100% of crystalline phases. These values were obtained 305
from the approach described in section 2.2.4.1, and hence, the presence of an ACn fraction is 306
neglected. Standard deviations are derived from three independent measurements (not the 307
mathematical errors from the Rietveld fits). These three analyses were carried out to different 308
portions of the samples for better averaging (i.e. not recording three patterns for the same sample). 309
Figures 1 to 6 show a selected range of the Rietveld plots for the six studied Yeelimite-containing 310
cements. The major peaks for each phase are labelled. 311
Several conclusions can be drawn from the phase analyses reported in Table 5. 312
I) Yeelimite, ideal stoichiometry Ca4Al6O12(SO4), is known to crystallise in the tectosilicate sodalite 313
type structure, Na4Al3Si3O12.Cl. Replacement of chloride by sulfate and partial replacement of 314
sodium by calcium gives hauynite, Na3CaAl3Si3O12(SO4). Both sodalite and hauynite minerals are 315
cubic. However, some aluminates with sodalite structure are known to be orthorhombic, for 316
instance Ca4Al6O12(WO4) [62,63]. Therefore, both orthorhombic and cubic structural descriptions 317
have been included in the control file for the RQPA, see Table 3. It is noteworthy that five out of six 318
BCSAF_B2 sample showed just cubic Yeelimite. We speculate that this is due to the simultaneous 320
presence of Na, Fe and Si within cubic Yeelimite in BCSAF_B2. A deep synthetic and structural 321
study of cubic and orthorhombic C4A3S-type phases is in progress, including neutron powder 322
diffraction, and it will be reported elsewhere. 323
II) It is also important to identify the belite polymorph and its quantification. Borax addition fully 324
transform -belite in BCSAF_B0 to fully 'H-belite in BCSAF_B2, in complete agreement with a 325
previous report [60]. The mechanism for the borax-activation of belite has been very recently 326
unravel as a solid solution, Ca2-xNax(SiO4)1-x(BO3)x, has been proved and the crystal structure of 327
'H-Ca1.85Na0.15(SiO4)0.85(BO3)0.15 has been worked out [45]. It is also noteworthy that S.A.cement 328
has a high 'H-belite content. This can be justified with the elemental composition reported in Table 329
2, as its Na2O content is quite high, 1.4 wt%. Na2O is known to stabilise -forms of belite [64,65]. 330
III) CS quantified in ALIPRE®, S.A.cement and CSA_trial is the high temperature polymorph, 331
anhydrite-II [48]. So, this less reactive CS was likely produced during the clinkering process. It 332
should be noted that gypsum, bassanite and less-soluble anhydrite-II can be easily distinguished and 333
quantified by RQPA. However, bassanite and highly soluble anhydrite-III can only be distinguished 334
in especial experimental conditions [66] with high-quality laboratory X-ray powder diffraction data. 335
IV) The good accuracy of the analyses can be estimated by the comparison of the XRF results 336
(Table 2) and RQPA results (Table 5). RQPA showed the highest amount of periclase (MgO) for 337
BELITH_CS10, 2.2(2) wt%, and this is in full agreement with elemental analysis reported in Table 338
2, where this clinker showed the highest MgO content, 2.7 wt%. Furthermore, S.A.cement was the 339
second sample with the highest magnesium content determined by XRF, 1.5 wt%, and RQPA 340
showed the second highest periclase content, 1.1 wt%. We choose to compare magnesium oxide 341
V) The presence of ternesite (also known as sulfate-spurrite), C5S2S, is quite uncommon in CSA or 343
BCSA clinkers. However, CSA_trial has a high amount of ternesite, 16.2(5) wt%. This is likely due 344
to a very high SO3 dosage in the raw materials. XRF SO3 value for this cement, 16.7 wt%, is very 345
high even taken into account the ~14 wt% of gypsum added. Overall SO3 values range 346
approximately from 9 to 14 wt% for CSA clinkers and between 3 and 4 wt% for BCSA clinkers. 347
VI) Titanium is usually present in CSA and BCSA cements as it accompanies aluminium in 348
bauxites. High aluminium contents in CSA clinkers are linked to high titanium contents as shown in 349
Table 2. Consequently, lower aluminium contents in BCSA are linked to lower titanium contents. 350
Furthermore, titanium may replace aluminium in some phases but the solubility limits are exceeded 351
in CSA and BCSA clinkers. This is evident from the RQPA as the perovskite CaTiO3 phase 352
segregates. We have carried out the RQPA with this assumed stoichiometry, CaTiO3, however 353
further studies are needed in order to establish the stoichiometry of the perovksite phase as it is very 354
well known that this phase forms extensive solid solutions with transition metals. 355
Finally, selective dissolutions have been carried out for BCSAF_B0 and BCSAF_B2, see Figures 7 356
and 8. This work was carried out for a better characterisation of these samples. For instance, it can 357
be highlighted that the main peak of CT is strongly overlapped with the main peak of C3A and 358
merwinite, Ca3Mg(SiO4)2. Therefore, RQPA, itself, can not distinguish between these phases. 359
Figure 7 shows a small selected region of the Rietveld plots for BCSAF_B0 clinker plus the 360
aluminate and silicate residues. Figure 8 shows the same type of graphic for BCSAF_B2. The 361
Rietveld plot for the silicate residue of BCSAF_B0 is very informative as the diffraction peaks from 362
C4AF disappear but the diffraction peak at ~33.3º (2) is still present. Hence, this phase could be 363
pervoskite or merwinite but not C3A. The Rietveld refinements of the silicate residue indicated that 364
Furthermore, a close analysis of the Rietveld plots of the residues indicates that the peaks widths in 366
the BCSAF_B2 are narrower than those in BCSAF_B0. For instance, the diffraction peaks from CT 367
and C4A3S in BCSAF_B2 aluminate fraction are narrower than those in the BCSAF_B0 aluminate 368
fraction, see Figure 8b and 7b, respectively. This behaviour is likely due to a better particle growth 369
when borax is added. In fact, scanning electron microscopy data (not shown) indicate that the 370
average particle sizes for BCSAF_B2 are larger than those of BCSAF_B0. However, the unit cell
371
values of some phases change between the two studied clinkers. Furthermore, these values also
372
slightly change between a clinker and the residues. So, the unit cell variations may also influence
373
the degree of overlapping and consequently, some peak widths.
374
3.2. Absolute RQPA of Yeelimite-containing clinkers/cement. 375
Table 6 shows the RPQA results (wt%) for the Yeelimite-containing samples including the ACn 376
contents employing the two methodologies previously described. The values obtained from 377
reflection geometry using an external standard (G-method) are given in the first row. The values 378
obtained from transmission geometry using ZnO as internal standard are given in the second row. In 379
both cases, standard deviations are derived from three independent measurements. 380
Three important conclusions can be drawn from the comparative study shown in Table 6. Firstly, 381
using the G-factor (previously obtained with an external standard, see Table 4), it allowed 382
measuring both the crystalline phases and the ACn contents. The ACn contents of CSA 383
clinkers/cements are similar to those found in OPC cements, ~ 10 wt% [30-32]. However, these 384
contents are much higher in BCSA clinkers, of the order of 25 wt%. We would like to highlight that 385
this measurement does not mean that there is about 25 wt% of amorphous/sub-cooled liquid in these 386
clinkers. These high values are likely due to the high concentration of impurities and defects in 387
Secondly, transmission powder diffraction data were also recorded for the same samples. An 389
alternative methodology is always advisable to show the appropriateness of data recording and data 390
analysis strategies. Furthermore, although the internal standard dilutes the phases in the samples, 391
ZnO was added to determine the overall ACn contents. Table 6 also reports the analytical results 392
obtained from this methodology. Overall, the same trend was obtained concerning the ACn 393
contents. CSA clinkers have ACn contents close to 10 wt% except for BELITH_CS10, which 394
essentially had a cero value. Furthermore, the BCSA clinkers displayed high ACn contents, ~ 25 395
wt%, in full agreement with those obtained with the G-method. 396
For the internal standard method, the reported uncertainties in Table 6 are those arising from the
397
average of three measurements. However, the uncertainties resulting from the amount of standard
398
used, 25 wt%, are not taken into account. Therefore, the standard deviations reported for the ACn
399
numbers are underestimated. Errors close to 3 wt% are more likely to occur, but they are very
400
difficult to quantify with precision.
401
Thirdly, a brief discussion on the results obtained by these two methods is worthy, see Table 6. For
402
four samples, S.A.cement, CSA_trial, BCSA_B0 and BCSAF_B2, the Rietveld quantitative phase
403
analysis values agree quite well. However, for ALIPRE® and BELITH_CS10, the results are not
404
that satisfactory. For ALIPRE®, the differences in the quantification of C4A3S-c, -belite and ACn 405
are 5.7, 4.3 and 10.3 wt%. Three times the standard deviations is commonly used for a good level of
406
confidence. So, the sum of 3 for the two analyses was calculated giving 3.0, 5.1 and 9.6 wt% for
407
C4A3S-c, -belite and ACn values, respectively. Therefore, the quantification of C4A3S-c for 408
ALIPRE® is well out of the limits. For BELITH_CS10, the differences in the quantification of
409
C4A3S-o, -belite and ACn are 4.3, 7.2 and 14.5 wt%, with the sum of 3 for the two analyses 410
giving 3.9, 3.9 and 5.7 wt%, respectively. In this case, the quantification of -belite and ACn does
not agree. We do not have a definitive answer for this behaviour but correlations of the phase scale
412
factors with the peak shape parameters may be likely playing a role.
413
Finally, it is worth to highlight the importance of having accurate structural description for every 414
phase in the cements to be analysed. This is more important for high-content phases, and it will be 415
illustrated for the RQPA of BCSAF_B2. If the ‗old‘ approximate crystal structure of 'H-C2S is 416
used [44], one Rietveld fit of the reflection data gave RWP=5.22% and RF('H-C2S)=7.24%. The 417
application of the G-method gave 'H-C2S and ACn contents of 35 and 33 wt%, respectively. If a 418
better structural description is used, 'H-Ca1.85Na0.15(SiO4)0.85(BO3)0.15 [45], then, the Rietveld fit of 419
the same pattern was better (lower disagreement factors): RWP=4.87% and RF('H-C2S)=5.72%. 420
This better fit gave a larger 'H-C2S scale factor (30.94 instead of 25.53) and therefore, the 'H-C2S 421
content was larger (40 wt%) and ACn content smaller, 28 wt%. So, the use of approximate crystal 422
structures give lower determined crystalline phase contents and higher ACn contents, as expected. 423
424
4. Conclusions. 425
Rietveld quantitative phase analyses of three commercially-available calcium sulfoaluminate 426
clinkers have been successfully carried out. In addition, two laboratory prepared iron-rich belite 427
calcium sulfoaluminate clinkers have been also studied. All commercial CSA clinkers contained 428
mixtures of orthorhombic and cubic Yeelimites. Only, the borax-activated BCSA clinker contained 429
just cubic-Yeelimite. Moreover borax addition transform -belite in BCSAF_B0 to fully ‘H-belite 430
in BCSAF_B2. Other accompanying phases have been quantified. It has been found a good 431
agreement between elemental compositions obtained by X-ray fluorescence and mineralogical 432
compositions obtained by Rietveld analysis of powder diffraction data as shown for MgO/periclase. 433
sulfoaluminate clinkers. Using this approach, every phase in the samples was firmly established. 435
Finally, the ACn contents of these materials were measured by both external and internal standard 436
methods. The agreement was fairly good for some cements but the variations for ALIPRE® and
437
BELITH_CS10 were larger than expected. Overall, the analyses showed that the commercial 438
calcium sulfoaluminate clinkers have ACn contents quite similar to those of OPCs, ~ 10 wt%. 439
Conversely, the ACn contents of the belite calcium sulfoaluminate clinkers were higher, ~ 25 wt%. 440
Acknowledgments 441
This work has been supported by Spanish Ministry of Science and Innovation through MAT2010-442
16213 research grant, which is co-funded by FEDER. I.S. thanks a Ramón y Cajal fellowship, 443
RYC-2008-03523. 444
References 445
[1] A. Klein, Calciumaluminosulfate and expansive cements containing same, US Patent No. 3, 446
155, 526 (1963) 4 pp. 447
[2] Y. Wang, M. Su, The third cement series in China, World Cem. 25 (1994) 6-10. 448
[3] E.M. Gartner, Industrially interesting approaches to ―low- CO2‖ cements, Cem. Concr. Res. 34 449
(2004) 1489-1498. 450
[4] G.S. Li, G. Walenta, E.M. Gartner, Formation and hydration of low-CO2 cements based on 451
belite, calcium sulfoaluminate and calcium aluminoferrite, Proceedings of the 12th ICCC, Montreal, 452
Canada (2007) pp TH3-15.3. 453
[5] M.C.G. Juenger, F. Winnefeld, J.L. Provis, J.H. Ideker, Advances in alternative cementitious 454
binders, Cem. Concr. Res. 41 (2011) 1232-1243. 455
[6] Q. Zhou, N.B. Milestone, M. Hayes, An alternative to Portland cement for waste 456
[7] F.P. Glasser, L. Zhang, High-Performance Cement Matrices Based on Calcium 458
Sulphoaluminate-Belite Compositions, Cem. Concr. Res. 31 (2001) 1881-1886. 459
[8] J. Beretka, M. Marroccoli, N. Sherman, G.L. Valenti, The influence of C4A3S content and WS 460
ratio on the performance of calcium sulfoaluminate-based cements, Cem. Concr. Res. 26 (1996) 461
1673-1681. 462
[9] S. Sahu, J. Majling, Preparation of sulphoaluminate belite cement from fly ash, Cem. Concr. 463
Res. 24 (1994) 1065-1072. 464
[10] I. Odler, Special inorganic cements, Taylor and Francis Publisher. Cap. 4 (2000) 69-74. 465
[11]F. Winnefeld, S. Barlag, Calorimetric and thermogravimetric study on the influence of calcium
466
sulfate on the hydration of yeelimite, J. Therm. Anal. Calorim. 101 (2010) 949-957.
467
[12] S. Berger, C.C.D. Coumes, P. Le Bescop, D. Damidot, Influence of a thermal cycle at early age
468
on the hydration of calcium sulphoaluminate cements with variable gypsum contents, Cem. Concr.
469
Res. 41 (2011) 149–160.
470
[13] I.A. Chen, C.W. Hargis, M.C.G. Juenger, Understanding expansion in calcium
sulfoaluminate-471
belite cements, Cem. Concr. Res. 42 (2012) 51-60.
472
[14] L. Zhang, F.P. Glasser, Hydration of calcium sulfoaluminate cement at less than 24 h, Adv. 473
Cem. Res. 14 (2002) 141-155. 474
[15] G.S. Li, E.M. Gartner, High-belite sulfoaluminate clinker: fabrication process and binder 475
preparation, World Patent Application WO 2006/018569 A2. 476
[16] K. Quillin, Performance of belite-sulfoaluminate cements, Cem. Concr. Res. 31 (2001) 1341-477
1349. 478
[17] I. Janotka, U. Krajci, S.C. Mojumdar, Performance of sulphoaluminate-belite cement with high 479
C4A3$ content, Ceram. Silik. 51 (2007) 74-81. 480
[18] D. Adolfsson, N. Menad, E. Viggh, B. Bjorkman, Hydraulic properties of sulphoaluminate 481
[19] J. Pera, J. Ambroise, New applications of calcium sulfoaluminate cement, Cem. Concr. Res. 34 483
(2004) 671-676. 484
[20] G. Walenta, C. Comparet, V. Morin, E. Gartner, Hydraulic binder based on sulfoaluminate 485
clinker and minerals additions, World Patent Application WO 2010/070215 A1 (2010). 486
[21] G. Walenta, E. Gartner, V. Morin, Additives for hydraulic binder based on iron-rich belite 487
calcium sulfoaluminate clinker, World Patent Application WO 2011/020958 A1 (2011). 488
[22] A. Wolter, Belite cements and low energy clinker, Cem. Inter. 3 (2005) 106-117. 489
[23] G.L. Valenti, M. Marroccoli, F. Montagnaro, M. Nobili, A. Telesca, Synthesis, hydration 490
properties and environmental friendly features of calcium sulfoaluminate cements, Proceedings of 491
the 12th International Congress of Cement Chemistry, Montreal (2007) W3 11.2. 492
[24] M.C Martín-Sedeño, A.J.M. Cuberos, A.G. De la Torre, G. Álvarez-Pinazo, L.M. Ordónez, M. 493
Gateshki, M.A.G. Aranda, Aluminum-rich belite sulfoaluminate cements: Clinkering and early age 494
hydration, Cem. Concr. Res. 40 (2010) 359–369. 495
[25] A.G. De la Torre, A.J.M. Cuberos, G. Alvarez-Pinazo, A. Cuesta, M.A.G. Aranda, In situ 496
powder diffraction study of belite sulfoaluminate clinkering, J. Synchr. Rad. 18 (2011) 506–514. 497
[26] J. Li, H. Ma, H. Zhao, Preparation of Sulphoaluminate-alite Composite Mineralogical Phase 498
Cement Clinker from High Alumina Fly Ash, Key Eng. Mat. 334-335 (2007) 421–424. 499
[27] H.M. Rietveld, A Profile Refinement Method for Nuclear and Magnetic Structures, J. Appl. 500
Cryst. 2 (1969) 65-71. 501
[28] D.L. Bish, S.A. Howard SA, Quantitative phase analysis using the Rietveld method, J. Appl. 502
Cryst. 21 (1988) 86-91. 503
[29] O. Pritula, L. Smrcok, B. Baumgartner, On reproducibility of Rietveld analysis of reference 504
Portland cement clinkers, Pow. Diffr. 18 (2003) 16-22. 505
[30] P.M. Suherman, A.V. Riessen, B. O‘connor, D. Li, D. Bolton, H. Fairhurst, Determination of
506
[31] P.S. Whitfield, L.D. Mitchell, Quantitative Rietveld analysis of the amorphous content in 508
cements and clinkers, J. Mater. Sci. 38 (2003) 4415-4421. 509
[32] A.G. De la Torre, S. Bruque, M.A.G. Aranda, Rietveld quantitative amorphous content 510
analysis, J. Appl. Cryst. 34 (2001) 196-202. 511
[33] J.P. Cline, R.B. Von Dree, R. Winburn, P.W. Stephens, J.J. Filliben, Addressing the 512
amorphous content issue in quantitative phase analysis: the certification of NIST standard reference 513
material 676a, Acta Cryst. Sect A 67 (2011) 357-367. 514
[34] B.H. O‘Connor, M.D. Raven, Application of the Rietveld refinement procedure in assaying 515
powdered mixtures, Pow. Diffr. 3 (1988) 2-6. 516
[35] D. Jansen, Ch. Stabler, F. Goetz-Neunhoeffer, S. Dittrich, J. Neubauer, Does Ordinary Portland 517
Cement contain amorphous phase? A quantitative study using an external standard method, Pow. 518
Diffr. 26 (2011) 31-38. 519
[36] D. Jansen, F. Goetz-Neunhoeffer, B. Lothenbach, J. Neubauer, The early hydration of Ordinary 520
Portland Cement (OPC): An approach comparing measured heat flow with calculated heat flow 521
from QXRD, Cem. Concr. Res. 42 (2012) 134-138. 522
[37] J. Wang, Hydration mechanism of cements based on low-CO2 clinkers containing belite, 523
ye‘elimite and calcium alumino-ferrite, PhD Thesis, University of Lille (2010). 524
[38] A.C. Larson, R.B. Von Dreele, General Structure Analysis System (GSAS), Los Alamos 525
National Laboratory Report LAUR (2000) pp 86-748. 526
[39] P. Thompson, D.E. Cox, J.B. Hasting, Rietveld refinement of Debye-Scherrer synchrotron X-527
ray data from Al2O3, J. Appl. Cryst. 20 (1987) 79-83. 528
[40] L.W. Finger, D.E. Cox, A.P. Jephcoat, A correction for powder diffraction peak asymmetry 529
due to diaxial divergence, J. Appl. Cryst. 27 (1994) 892-900. 530
[41] W.A. Dollase, Correction of intensities for preferred orientation in powder diffractometry: 531
[42] N.J. Calos, C.H.L. Kennard, A.K. Whittaker, R.L.Davis, Structure of calcium aluminate 533
sulphate Ca4Al6O16S, J. Solid State Chem. 119 (1995) 1-7. 534
[43] H. Saalfeld, W.Depmeier, Silicon-free compounds with sodalite structure, Kristall und 535
Technik, 7 (1972) 229-233. 536
[44] W.G. Mumme, R.J. Hill, G. Bushnell-Wye, E.R. Segnit, Rietveld crystal structure refinement, 537
chemistry and calculated powder diffraction data for the polymorphs of dicalcium silicate and 538
related phases, N. Jb. Miner. Abh. 169 (1995) 35-68. 539
[45] A. Cuesta, E.R. Losilla; M.A.G. Aranda, A.G. De la Torre, Reactive belite stabilization 540
mechanisms by boron-bearing dopants, Cem. Concr. Res. 42 (2012) 598-606.
541
[46] A.A. Colville, S. Géller, The crystal structure of brownmillerite, Ca2FeAlO5, Acta Cryst. B27 542
(1971) 2311-2315.
543
[47] S. Sasaki, C.T. Prewitt, J.D.Bass, Orthorhombic perovskite CaTiO3 and CdTiO3: structure and 544
space group, Acta Cryst. C43 (1987) 1668-1674. 545
[48] A. Kirfel, G. Will, Charge density in anhydrite, CaSO4, from X-ray and neutron diffraction, 546
Acta Cryst. B36 (1980) 2881-2890. 547
[49] A.G. De la Torre, M.G. Lopez-Olmo, C. Alvarez-Rua, S. Garcia-Granda, M.A.G. Aranda, 548
Structure and microstructure of gypsum and its relevance to Rietveld quantitative phase analyses, 549
Pow. Diffr. 19 (2004) 240-246. 550
[50] S. Sasaki, K. Fujino, Y. Takeuchi, X-ray determination of electron-density distributions in 551
oxides, MgO, MnO, CoO, and NiO, and atomic scattering factors of their constituent atoms, Proc. 552
Jap. Acad. 55 (1979) 43-48. 553
[51] W. Hörkner, Hk. Müller-Buschbaum, Crystal-structure of CaAl2O4, Inorg. Nuclear Chem. 38 554
[52] A.G. De la Torre, S. Bruque, J. Campo, M.A.G. Aranda, The superstructure of C3S from 556
synchrotron and neutron powder diffraction and its role in quantitative phase analyses, Cem. Concr. 557
Res. 32 (2002) 1347-1356.
558
[53] S.J. Louisnathan, Refinement of the crystal structure of a natural gehlenite, Ca2Al(Al,Si)O7, 559
Can. Min. 10 (1971) 822-837. 560
[54] P.D. Brotherton, J.M. Epstein, M.W. Pryce, A.H. White, Crystal structure of calcium 561
sulphosilicate, Ca5(SiO4)2(SO4), Australian J. Chem. 27 (1974) 657-660. 562
[55] H. Effenberger, A. Kirfel, G. Wil, Studies of the electron-density distribution of dolomite, 563
CaMg(CO3)2, Tschermaks Mineralogische und Petrographische Mitteilungen, 31 (1983) 151-164. 564
[56] I.P. Swainson, , M.T. Dove, W.W.Schmahl, A. Putnis, Neutron Diffraction Study of the 565
Akermanite-Gehlenite Solid Solution Series, Phys. Chem. Min. 19 (1992) 185-195. 566
[57] V. Kahlenberg, G. Doersam, M. Wendschuh-Josties, R.X. Fischer, The crystal structure of 567
delta-(Na2Si2O5), J. Solid State Chem. 146 (1999) 380-386. 568
[58] E.N. Maslen, V.A. Streltsov, N.R. Streltsova, N. Ishizawa, Y. Satow, Synchrotron X-ray study 569
of the electron density in alpha-Al2O3, Acta Cryst. B49 (1993) 973-980. 570
[59] J. Albertsson, S.C. Abrahams, A. Kvick, Atomic displacement, anharmonic thermal vibration, 571
expansivity and pyroelectric coefficient thermal dependences in ZnO, Acta Cryst. B45 (1989) 34-572
40. 573
[60] A.J.M. Cuberos, A.G. De la Torre, G. Álvarez-Pinazo, M.C. Martín-Sedeño, K. Schollbach, H. 574
Pöllmann, M.A.G. Aranda, Active Iron-Rich Belite Sulfoaluminate Cements: Clinkering and 575
Hydration, Environ. Sci. Technol. 44 (2010) 6855-6862. 576
[61] T. Westphal, T. Füllmann, H. Pöllmann, Rietveld quantification of amorphous portions with an 577
internal standard-mathematical consequences of the experimental approach, Pow. Diffr. 24 (2009) 578
[62] W. Depmeier, Aluminate Sodalite Ca8[Al12O24](WO4)2 at Room Temperature, Acta Cryst. C40 580
(1984) 226-231. 581
[63] W. Depmeier, Structure of Cubic Aluminate Sodalite Ca8[Al12O24](WO4)2 in Comparison with 582
its Orthorhombic Phase and with Cubic Sr8[Al12O24](CrO4)2, Acta Cryst. B44 (1988) 201-207. 583
[64] K. Morsli, AG. de la Torre, S. Stober, A.J.M. Cuberos, M. Zahir, M.A.G. Aranda, Quantitative 584
Phase Analysis of Laboratory-Active Belite Clinkers by Synchrotron Powder Diffraction, J. Am. 585
Ceram. Soc. 90 (2007) 3205-3212. 586
[65] K. Morsli, AG. de la Torre, M. Zahir, M.A.G. Aranda, Mineralogical phase analysis of alkali 587
and sulfate bearing belite rich laboratory clinkers, Cem. Concr. Res. 37 (2007) 639-646. 588
[66] S. Seufert, C. Hesse, F. Goetz-Neunhoeffer, J. Neubauer, Discrimination of bassanite and 589
anhydrite III dehydrated from gypsum at different temperatures, Z. Kristallogr. Suppl. 30 (2009) 590
447-452. 591
592
593
Figure Captions 594
Figure 1. Selected range of the Rietveld plot for ALIPRE® clinker. Crosses are the experimental 595
scan, solid line is the calculated pattern and the bottom line is the difference curve. The major peaks 596
for each phase are labelled. 597
Figure 2. Selected range of the Rietveld plot for BELITH_CS10 clinker. Crosses are the 598
experimental scan, solid line is the calculated pattern and the bottom line is the difference curve. 599
The major peaks for each phase are labelled. 600
Figure 3. Selected range of the Rietveld plot for S.A.cement clinker. Crosses are the experimental 601
scan, solid line is the calculated pattern and the bottom line is the difference curve. The major peaks 602
Figure 4. Selected range of the Rietveld plot for CSA_trial cement. Crosses are the experimental 604
scan, solid line is the calculated pattern and the bottom line is the difference curve. The major peaks 605
for each phase are labelled. 606
Figure 5. Selected range of the Rietveld plot for BCSAF_B0 clinker. Crosses are the experimental 607
scan, solid line is the calculated pattern and the bottom line is the difference curve. The major peaks 608
for each phase are labelled. 609
Figure 6. Selected range of the Rietveld plot for BCSAF_B2 clinker. Crosses are the experimental 610
scan, solid line is the calculated pattern and the bottom line is the difference curve. The major peaks 611
for each phase are labelled. 612
Figure 7. Selected small range (30 – 36 º /2) of the Rietveld plots for: (a) BCSAF_B0 clinker, (b) 613
BCSAF_B0 aluminate residue, (c) BCSAF_B0 silicate residue. All details as in previous Rietveld 614
figures. 615
Figure 8. Selected small range (30 – 36 º /2) of the Rietveld plots for: (a) BCSAF_B2 clinker, (b) 616
BCSAF_B2 aluminate residue, (c) BCSAF_B2 silicate residue. All details as in previous Rietveld 617
figures. 618
619
Table 1. Raw materials employed for the preparation of BCSAF clinkers (expressed in grams).
Limestone Kaolin Bauxite Gypsum Marl Borax
BCSAF_B0 1796.30 281.03 519.53 227.51 209.78 -
BCSAF_B2 1744.21 272.88 504.47 220.91 203.70 120.26
Table 2. Elemental composition, determined by XRF and expressed as oxide wt%, of the Yeelimite-containing clinkers. The mass attenuation coefficients (MAC) used in this study are also given in italics.
ALIPRE® BELITH_CS10 S.A.cement CSA_trial BCSAF_B0 BCSAF_B2 MAC (cm2/g)
CaO 41.59 41.86 44.10 45.59 51.75 50.99 120.47
Al2O3 33.64 33.85 27.30 20.93 18.78 17.03 30.91
SiO2 6.52 8.21 9.00 10.13 16.70 16.53 34.84
SO3 13.97 8.81 12.20 16.66 3.68 3.70 42.48
Fe2O3 0.89 2.37 2.60 3.63 6.72 6.28 220.77
B2O3# - - - - 0.13 2.37 8.26
Na2O# 0.09 <0.08 1.40 0.18 0.10 1.00 24.28
K2O 0.39 0.25 0.30 0.31 0.34 0.33 116.82
MgO 0.68 2.73 1.50 1.26 0.99 0.97 27.88
TiO2 1.48 1.50 1.30 1.00 0.65 0.62 121.97
SrO 0.50 0.15 0.20 0.17 0.028 0.03 100.36
Cr2O3 - 0.017 - 0.02 0.028 0.023 176.40
MnO - 0.011 - 0.02 0.036 0.034 217.87
ZrO2 0.10 0.070 - 0.05 0.021 0.019 104.15
P2O5 0.16 0.13 0.10 0.04 0.055 0.059 38.59
MAC (cm2/g) 73.81 75.96 78.56 82.31 92.00 89.28 -
Table 3. ICDD-PDF and ICSD collection codes for all phases used for Rietveld refinements.
PDF-code ICSD code Ref. PDF-code ICSD code Ref.
C4A3S-o 01-085-2210 80361 [42] M 01-071-1176 9863 [50]
C4A3S-c 01-071-0969 9560 [43] CA 01-070-0134 260 [51]
-C2S 01-086-0397 81095 [44] C3S 01-070-8632 94742 [52]
-C2S 01-086-0398 81096 [44] C2AS 01-089-5917 87144 [53]
’-C2S 01-086-0399 81097 [44] C5S2S 01-070-1847 4332 [54]
’-C2S (act.) 01-086-0399 - [45] Dolomite 01-075-1711 31277 [55]
C4AF 01-071-0667 9197 [46] Akermanite 01-079-2425 67691 [56]
CT 01-078-1013 62149 [47] Na2Si2O5 01-089-8339 88662 [57]
CS 01-072-0916 16382 [48] Al2O3 (standard) 01-081-2267 73725 [58]
CSH2 00-033-0311 151692 [49] ZnO (standard) 01-079-0206 65120 [59]
Table 4. Computed G factor and selected structural details for the alumina standard used.
Rietveld scale factor from GSAS program# 236.60#
Sst (NIST Al2O3) 0.92748
Cell volume 2.551·10-22 (cm3)
Density 3.998 (g/cm3)
MAC 30.91 (cm2/g)
Table 5. Direct RQPA results (wt%) for the Yeelimite-containing clinkers normalized to 100% of crystalline phases. Standard deviations are derived from three independent measurements (not the mathematical errors from the Rietveld fit).
C4A3S-o C4A3S-c ’-C2S -C2S C4AF CT M C5S2S CSH2 CS C3S
ALIPRE®1 51.0(7) 18.5(6) 9.4(3) 7.7(1) 3.5(1) 0.52(2) 9.0(4)
BELITH_CS102 40.1(9) 25.5(6) 16.0(2) 2.4(1) 9.3(1) 2.2(2)
S.A.cement3 27.5(5) 28.7(6) 21.4(9) 9.7(4) 3.5(4) 1.1(1) 6.3(1)
CSA_trial4 16.5(1.3) 23.6(7) 9.0(9) 4.8(2) 16.2(5) 13.7(4) 8.5(2) 5.9(5)
BCSAF_B05 14.6(1.1) 13.5(1.2) 48.7(6) 14.9(2) 1.3(2)
BCSAF_B2 31.1(1.7) 56.7(1.8) 10.1(6) 2.1(2)
2
Also contains 4.6(1) wt% of akermanite.
3
Also contains 1.9(1) wt% of CA.
4
Also contains 1.8(7) wt% of dolomite.
5
Table 6. RQPA results (wt%) for the Yeelimite-containing clinkers including the overall amorphous plus not-quantified crystalline phase(s) content. The values obtained from reflection geometry using an external standard (G-method) are given in the first row. The values obtained from transmission geometry using ZnO as internal standard are given in the second row (italics). Standard deviations are derived from three independent measurements (not the mathematical errors from the Rietveld fit).
C4A3S-o C4A3S-c ’-C2S -C2S C4AF CT M C5S2S CSH2 CS C3S ACn#
ALIPRE®1 42.0(9) 15.3(5) 7.7(2) 6.4(1) 2.9(1) 0.43(1) 7.5(4) 17.5(1.4)
41.0(8) 21.0(5) 7.6(2) 10.7(1.6) 3.0(2) 0.5(2) 8.2(1) 7.2(1.8)
BELITH_CS102 35.8(4) 22.8(3) 14.3(3) 2.1(1) 8.3(2) 2.0(2) 10.6(8)
40.1(9) 23.0(9) 21.5(1.0) 2.1(4) 7.9(1) 2.1(1) -3.9(1.1)
S.A.cement3 24.2(6) 25.3(9) 18.8(4) 8.6(5) 3.1(4) 0.92(2) 5.6(2) 11.9(1.7)
23.0(7) 27.2(6) 17.1(3) 8.8(6) 2.9(1) 0.7(1) 6.1(1) 13.5(6)
CSA_trial4 14.6(7) 21.2(1.0) 8.0(1.1) 4.3(3) 14.4(8) 12.2(7) 7.6(1) 5.3(6) 10.8(2.9)
14.3(6) 20.7(8) 9.0(6) 3.4(2) 13.0(1) 13.3(3) 7.5(2) 6.0(6) 12.3(1.4)
BCSAF_B05 10.9(1.0) 10.0(8) 36.2(1.3) 11.1(2) 1.0(1) 25.5(2.1)
10.2(7) 8.8(6) 33.3(1) 12.9(3) 0.6(2) 26.1(4)
BCSAF_B2 22.5(1.6) 40.9(1.0) 7.3(4) 1.5(2) 27.7(1.2)
22.1(3) 41.9(4) 10.3(2) 0.9(2) 24.9(9)
#
ACn stands for amorphous plus not-quantified crystalline phase(s) which includes misfitting problems and not-computed phase(s).
1
Also contains: 0.4(1) wt% Na2Si2O5. 0.8(3) wt% Na2Si2O5.
2
Also contains: 4.1(1) wt% akermanite. 7.3(1) wt% akermanite.
3
Also contains 1.6(1) wt% CA. 0.8(2) wt% CA
4
Also contains 1.6(5) wt% dolomite. 1.0(4) wt% dolomite
5
R7_Alipre Hist 1
Lambda 1.5406 A, L-S cycle 879 Obsd. and Diff. Profiles
2-Theta, deg
C
oun
ts
20.0 25.0 30.0 35.0 40.0 45.0
X1
0E
4
-1
.0
0
.0
1
.0
2
.0
3
.0
*
ALIPRE
®
C
4A
3S-o
C
4A
3S-c
α’-C
2S
β-C
2S
CS
CT
*
2_CS10 Hist 1
Lambda 1.5406 A, L-S cycle 704 Obsd. and Diff. Profiles
2-Theta, deg
C
oun
ts
20.0 25.0 30.0 35.0 40.0 45.0
X1
0E
4
-1
.0
0
.0
1
.0
2
.0
3
.0
*
BELITH_CS10
C
4A
3S-o
C
4A
3S-c
β-C
2S
CT
4_SA_Cement_alfa&beta Hist 1
Lambda 1.5406 A, L-S cycle 757 Obsd. and Diff. Profiles
2-Theta, deg
C
oun
ts
20.0 25.0 30.0 35.0 40.0 45.0
X1
0E
4
-1
.0
0
.0
1
.0
2
.0
3
.0
*
S.A.cement
β-C
2S
CS
CT
C
4A
3S-o
C
4A
3S-c
RR3_Dycker Hist 1
Lambda 1.5406 A, L-S cycle 347 Obsd. and Diff. Profiles
2-Theta, deg
C
oun
ts
20.0
25.0
30.0
35.0
40.0
45.0
X1
0E
4
-0
.5
0
.0
0
.5
1
.0
1
.5
*
CSA_trial
C
4A
3S-o
C
4A
3S-c
β-C
2S
CSH
25_BCSAF_B0 Hist 1
Lambda 1.5406 A, L-S cycle 479 Obsd. and Diff. Profiles
2-Theta, deg
C
oun
ts
20.0 25.0 30.0 35.0 40.0 45.0
X1
0E
4
0
.0
0
.5
1
.0
BCSAF_B0
C
4A
3S-o
C
4A
3S-c
β-C
2S
RR6_BCSAF_B2 Hist 1 Lambda 1.5406 A, L-S cycle 581 Obsd. and Diff. Profiles
2-Theta, deg
C
oun
ts
20.0 25.0 30.0 35.0 40.0 45.0
X1
0E
4
0
.0
0
.5
1
.0
*
BCSAF_B2
C
4A
3S-c
α’-C
2S
*
5_BCSAF_B0 Hist 1 Lambda 1.5406 A, L-S cycle 483 Obsd. and Diff. Profiles
2-Theta, deg C oun ts
30.0 31.0 32.0 33.0 34.0 35.0 36.0
X1 0E 3 0 .0 2 .0 4 .0
Residuo_metanol-salicilico_B0_CT Hist 1 Lambda 1.5406 A, L-S cycle 512 Obsd. and Diff. Profiles
2-Theta, deg C oun ts
30.0 31.0 32.0 33.0 34.0 35.0 36.0
X1 0E 3 0 .0 2 .0 4 .0 6 .0 8 .0
Residuo_B0_KOH_CT Hist 1 Lambda 1.5406 A, L-S cycle 611 Obsd. and Diff. Profiles
C oun ts X1 0E 3 -2 .0 0 .0 2 .0 4 .0 6 .0
*
*
*
C4A3S-o C4A3S-c
β-C2S
C4AF C2AS
CT
*
C4A3S-o C4A3S-c
β-C2S
C4AF C2AS