http://doi.org/10.18172/cig.3823 © Universidad de La Rioja
Please, cite this article as: Pisabarro, A. 2019. Snow cover as a morphogenic agent determining ground climate, landforms and runoff in the Valdecebollas massif, Cantabrian Mountains. Cuadernos de Investigación Geográfica 46, http://doi.org/10.18172/cig.3823.
SNOW COVER AS A MORPHOGENIC AGENT DETERMINING
GROUND CLIMATE, LANDFORMS AND RUNOFF IN THE
VALDECEBOLLAS MASSIF, CANTABRIAN MOUNTAINS
1A. PISABARRO
Department of Geography, University of Valladolid, Plaza del Campus s/n, 47011 Valladolid, Spain.
ABSTRACT. Snowfalls are important meteorological events affecting the physical environment of the Cantabrian Mountains. This work analyzes the effects of snow on several elements such as relief, landforms, ground climate and snowmelt waters. The ground thermal regime and associated parameters were studied using temperature data loggers and satellite images and were described in combination with observed geomorphological processes and landforms. A geomorphological map was drawn up and trends in climate patterns and runoff were calculated. Ground temperature monitoring in warm years is not optimal, though allow to know the limit conditions for developing cold processes. Results show that geomorphological processes are not significant and that solifluction deriving from snowmelt, is the only active process in years without freeze or with thick snow cover. Snowfall evolution in recent decades in correlation with flow water and climate features provide the certainty that snow distribution also affects efficacy in runoff generation and moves the flow peak in rivers due to early snowmelt.
La cubierta nival como agente morfogénico que determina el régimen climático del
suelo, las formas de relieve y la escorrentía en el Macizo de Valdecebollas, Montaña
Cantábrica
RESUMEN. Las nevadas son importantes eventos meteorológicos que afectan al ambiente físico de la Montaña Cantábrica. Este trabajo analiza los efectos sobre varios elementos como el relieve, el clima del suelo y la hidrología nival. El régimen termal del suelo y parámetros asociados se estudiaron utilizando data loggers de temperatura e imágenes de satélite, y se describieron en combinación con procesos geomorfológicos observados y formas de relieve. Se elaboró un mapa geomorfológico y se calcularon las tendencias en los patrones climáticos y en la escorrentía. La monitorización de la temperatura del suelo en años cálidos no ha dado los mejores resultados, aunque permiten conocer las condiciones límite para el desarrollo de procesos fríos. Los resultados muestran que los procesos geomorfológicos no son significativos, y que la solifluxión derivada de la fusión de nieve es el único proceso activo en años sin heladas o con un potente manto de nieve. La evolución de la precipitación en forma de nieve en décadas recientes en relación con los rasgos del flujo hídrico y del clima proporciona la certeza de que la distribución de la nieve también afecta a la eficacia de la generación de escorrentía y desplaza el pico de caudal en los ríos debido a una fusión más temprana.
Key words: snow, periglacial geomorphology, Cantabrian Mountains, runoff, landforms.
Palabras clave: nieve, geomorfología periglaciar, Montaña Cantábrica, escorrentía, formas de relieve.
Received: 2 November 2018
Accepted: 25 January 2019
1 This paper has received the Third Prize from the Young Researcher Innovation Award on Cryosphere Science,
granted by the Research Group on Physical Geography in High Mountains, Complutense University of Madrid (Department of Geography), Spain.
PAPER
ACCEPTED.
PRE-PRINT
Corresponding author: Alfonso Pisabarro, Department of Geography, University of Valladolid, Plaza del Campus s/n, 47011 Valladolid, Spain. E-mail address: [email protected]
1. Introduction
In the Central Cantabrian Mountains snow cover has been confirmed as an outstanding morphogenetic agent, causing landforms and associated deposits (Nossin, 1959; Ugarte, 1992; García de Celis, 1993, 2002; Castañón and Frochoso, 1994; González Gutiérrez, 2002; González-Trueba, 2007b; Rodríguez-Pérez, 2009; Santos-González et al., 2009; González-Trueba and Serrano, 2010a, b; Santos-González, 2011; González-Trueba et al., 2012; Pellitero and Serrano, 2012; Pellitero, 2013, 2014; Hernández Holgado, 2014; Ruiz-Fernández et al., 2015; Pisabarro et al., 2017), and there are natural hazards in mountain areas in which interaction of snow cover with topography, meteorological events or land cover is determinant (Wozniak and Marquínez, 2004; Vada et al., 2012, 2013; García-Hernández et al., 2015, 2017; Poblete et al., 2016; Serrano et al., 2016).
Another aspect of snow is its major role on mountain rivers water regime, e.g. in the Pyrenees (López-Moreno and García-Ruíz, 2004; López-Moreno et al. 2009; García-Ruíz et al. 2011; Sanmiguel
et al., 2017). The dominant snow-fed fluvial regime is a characteristic of periglacial environments with a higher ratio between runoff and precipitation (Kane et al., 1998; Ballantyne, 2018). Snow accumulation produces a more efficient runoff regime that moves greater quantities of water and creates relevant geomorphological events (Woo, 2012). In the Duero/Douro catchment, which includes this massif, clear reductions in runoff and fluvial regime changes have already been recorded (Ceballos-Barbancho et al., 2008; Morán-Tejeda et al., 2010; Morán-Tejeda, 2012). Most of the research shows a very good correlation between decreases in snowfall and air temperature increases (Adam et al., 2009). Moreover, changes in the duration of snow cover also have consequences, bringing about alterations in microbial processes in soils (Edwards et al., 2007).
Nevertheless, most contributions to date on the Central Cantabrian Mountains have focused on the search for active processes (Castañón and Frochoso, 1994, 1998; Serrano and González-Trueba, 2004b; González-Trueba, 2007a; Santos-González et al., 2009; González-Trueba and Serrano, 2010b; Santos-González, 2011; Pellitero, 2013; Pisabarro et al., 2015, 2017) and conclude that snow cover is the driver of freeze-thaw cycles (F/Tc) and seasonal frozen grounds (SFG). In this sense, the study of the ground thermal regime (GTR) facilitates the understanding of the capacity of the climate to trigger active periglacial processes and shows it to be a good indicator of snow cover characteristics (Zhang, 2005; French, 2007; Ballantyne, 2018), particularly in the Mediterranean mountains (Vieira et al., 2003; Andrés and Palacios, 2010; Oliva et al., 2014, 2016) where the snow cover is highly variable in time because of the climatic characteristics of this region.
GTR studies in the Cantabrian Mountains confirmed the presence of an active periglacial belt above 2100 m (Oliva et al., 2016) according to the topoclimate. Nevertheless, this belt is beneath the threshold for mountain permafrost (French, 2007; Dobinski, 2011) except in Picos de Europa massif, where it may be found at the edge of ice patches (Serrano et al., 2011; Pisabarro et al., 2015) and in ice caves (Gómez Lende et al., 2014; Gómez-Lende, 2015). The other periglacial landforms were active in the Pleistocene and are good evidence of the past with permafrost e.g. rock glaciers in the Younger Dryas (YD) and Last Glacial Maximum (LGM) (Alonso, 1989; García de Celis, 1991; Serrano and Gutiérrez, 2000; Redondo-Vega et al., 2004, 2013; Santos-González et al., 2009; Pellitero et al., 2011; Rodríguez-Rodríguez et al., 2016; Oliva et al., 2018).
This paper aims to synthesize the main processes of the physical environment in the Cantabrian Mountains and obtain new relationships among snow cover, ground climate, relief, landforms and hydric resources at a little studied site, the Pisuerga headwaters and Valdecebollas massif.
2. Study area
The Valdecebollas massif is in the North of Palencia at the source of the river Pisuerga, tributary of Duero catchment. The summit is at just 2143 m and is part of the western edge of the Mesozoic cover
PAPER
ACCEPTED.
PRE-PRINT
of the Cantabrian Mountains, touching Alto Campoo and Cantabria to the northeast (N 42º 58’ 0,16”; W 4º 21’ 55,94”) (Fig. 1). This glacial landscape is appropriate for measuring these processes due to its topoclimatic features, glacial and periglacial landforms and recent cold processes such as ice waterfalls. The study area is north-facing over a glacial cirque with a tongue at the front that flowed to 1700 m in the LGM (Serrano et al., 2013). The glacial landforms are complex due to relief and geological structure. A wide variety of frontal and lateral moraines remain due to a succession of advances in three main stages, linked to a period since LGM to YD (Pellitero and Serrano, 2008; Serrano et al., 2013; Serrano and González-Trueba, 2004).
Figure 1. Location map of Valdecebollas massif cirque glacier.
The area shows clear evidence of fossil periglacial landforms above 1400 m as rock slopes in the Pisuerga valley (Pellitero and Serrano, 2008; Pisabarro, scheduled for 2019), a rock glacier in Alto Campoo (Serrano and Gutiérrez, 2000) Several asymmetric and dry NE-SW valleys are observed in Sierra Labra slopes (Nossin, 1959), splitting cryoplanation slopes in accordance with the definition by Ballantyne (2018). There are also covered ploughing boulders moved by a combination of solifluction and slumping (Nossin, 1959). Deep Pleistocene solifluction and gelifluction sheets were observed in 1.5 to 2 m profiles in stratified deposits in Tres Mares western face (Pisabarro, scheduled for 2019).
The rivers are fed by both snow and rainfall with flow peaks generally in spring due to the snowmelt, however the regime varies strongly due to the Mediterranean influence, which causes irregular warm episodes. During the study period (2015-2017), mean winter air temperatures (December-March) of 2016-2017 were the warmest of the period 1961-2017 in this region increasing the historical average of winters (3,47ºC) in 2,02ºC in the closest long-term data (Fig. 2). Winter 2015-2016 was moderately warm (3,8ºC). Although this transitional climate has several warm and dry years, total precipitation is higher than 2,000 mm. and mean annual air temperature (MAAT) is 5,8ºC, minimum annual air temperature (Min AAT) is 2,8 ºC and maximum annual air temperature (Max AAT) is 9,1ºC (Fig. 3).
PAPER
ACCEPTED.
PRE-PRINT
Logically, over several years, snowfalls are much more compensated and have a profound effect on the physical environment and socio-economic features of the area, e.g. the snowfalls of 2015 and 2018. Moreover, it is important to know that the area has been intensely affected by fires and overgrazing since the Middle Ages.
Figure 2. Mean winter air temperatures in Requejada meteorological station (December - March).
Figure 3. Mean climate features at Valdecebollas telenivometer (precipitation estimated by snow wáter equivalent values. Rainfalls are excluded, so real values are greater.
3. Methodology
The research is structured in three sections. Firstly, mean annual ground temperature (MAGT) features are analyzed, then active periglacial landforms are interpreted, and finally snow behaviour and runoff tendencies are compared to these of temperature and precipitation.
PAPER
ACCEPTED.
PRE-PRINT
3.1. GTR features
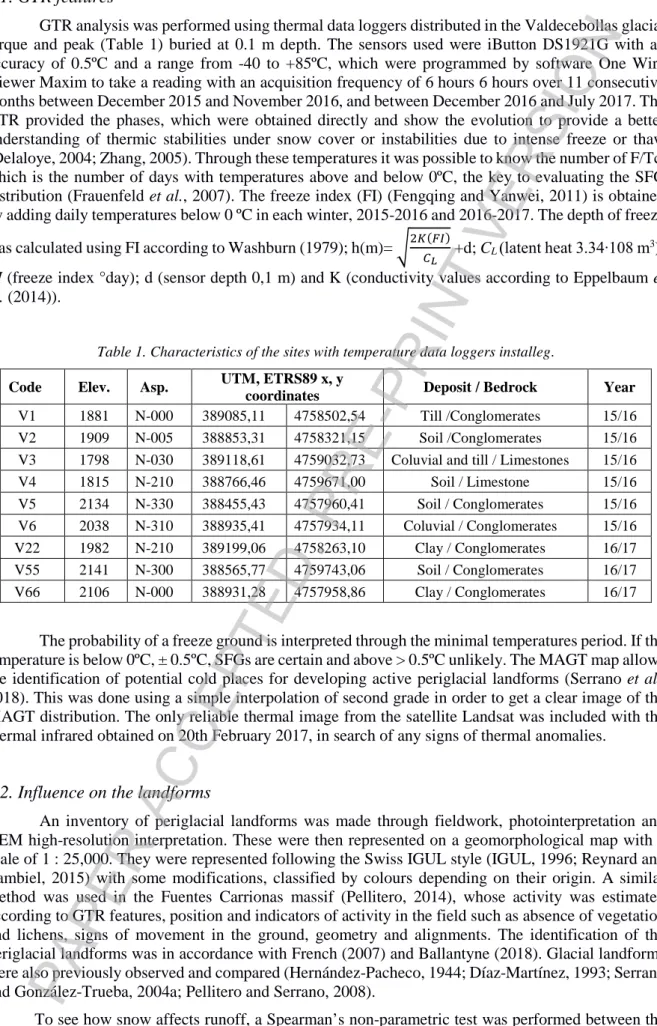
GTR analysis was performed using thermal data loggers distributed in the Valdecebollas glacial cirque and peak (Table 1) buried at 0.1 m depth. The sensors used were iButton DS1921G with an accuracy of 0.5ºC and a range from -40 to +85ºC, which were programmed by software One Wire Viewer Maxim to take a reading with an acquisition frequency of 6 hours 6 hours over 11 consecutive months between December 2015 and November 2016, and between December 2016 and July 2017. The GTR provided the phases, which were obtained directly and show the evolution to provide a better understanding of thermic stabilities under snow cover or instabilities due to intense freeze or thaw (Delaloye, 2004; Zhang, 2005). Through these temperatures it was possible to know the number of F/Tc, which is the number of days with temperatures above and below 0ºC, the key to evaluating the SFG distribution (Frauenfeld et al., 2007). The freeze index (FI) (Fengqing and Yanwei, 2011) is obtained by adding daily temperatures below 0 ºC in each winter, 2015-2016 and 2016-2017. The depth of freeze
was calculated using FI according to Washburn (1979); h(m)=
�
2𝐾𝐾(𝐹𝐹𝐹𝐹)𝐶𝐶𝐿𝐿 +d; CL (latent heat 3.34∙108 m
3);
FI (freeze index °day); d (sensor depth 0,1 m) and K (conductivity values according to Eppelbaum et al. (2014)).
Table 1. Characteristics of the sites with temperature data loggers installeg.
Code Elev. Asp. UTM, ETRS89 x, y
coordinates Deposit / Bedrock Year
V1 1881 N-000 389085,11 4758502,54 Till /Conglomerates 15/16
V2 1909 N-005 388853,31 4758321,15 Soil /Conglomerates 15/16
V3 1798 N-030 389118,61 4759032,73 Coluvial and till / Limestones 15/16
V4 1815 N-210 388766,46 4759671,00 Soil / Limestone 15/16
V5 2134 N-330 388455,43 4757960,41 Soil / Conglomerates 15/16
V6 2038 N-310 388935,41 4757934,11 Coluvial / Conglomerates 15/16
V22 1982 N-210 389199,06 4758263,10 Clay / Conglomerates 16/17
V55 2141 N-300 388565,77 4759743,06 Soil / Conglomerates 16/17
V66 2106 N-000 388931,28 4757958,86 Clay / Conglomerates 16/17
The probability of a freeze ground is interpreted through the minimal temperatures period. If the temperature is below 0ºC, ± 0.5ºC, SFGs are certain and above > 0.5ºC unlikely. The MAGT map allows the identification of potential cold places for developing active periglacial landforms (Serrano et al., 2018). This was done using a simple interpolation of second grade in order to get a clear image of the MAGT distribution. The only reliable thermal image from the satellite Landsat was included with the thermal infrared obtained on 20th February 2017, in search of any signs of thermal anomalies.
3.2. Influence on the landforms
An inventory of periglacial landforms was made through fieldwork, photointerpretation and DEM high-resolution interpretation. These were then represented on a geomorphological map with a scale of 1 : 25,000. They were represented following the Swiss IGUL style (IGUL, 1996; Reynard and Lambiel, 2015) with some modifications, classified by colours depending on their origin. A similar method was used in the Fuentes Carrionas massif (Pellitero, 2014), whose activity was estimated according to GTR features, position and indicators of activity in the field such as absence of vegetation and lichens, signs of movement in the ground, geometry and alignments. The identification of the periglacial landforms was in accordance with French (2007) and Ballantyne (2018). Glacial landforms were also previously observed and compared (Hernández-Pacheco, 1944; Díaz-Martínez, 1993; Serrano and González-Trueba, 2004a; Pellitero and Serrano, 2008).
To see how snow affects runoff, a Spearman’s non-parametric test was performed between the following two data series:
PAPER
ACCEPTED.
PRE-PRINT
(i) Number of days with snow precipitation between 1961 and 2005.
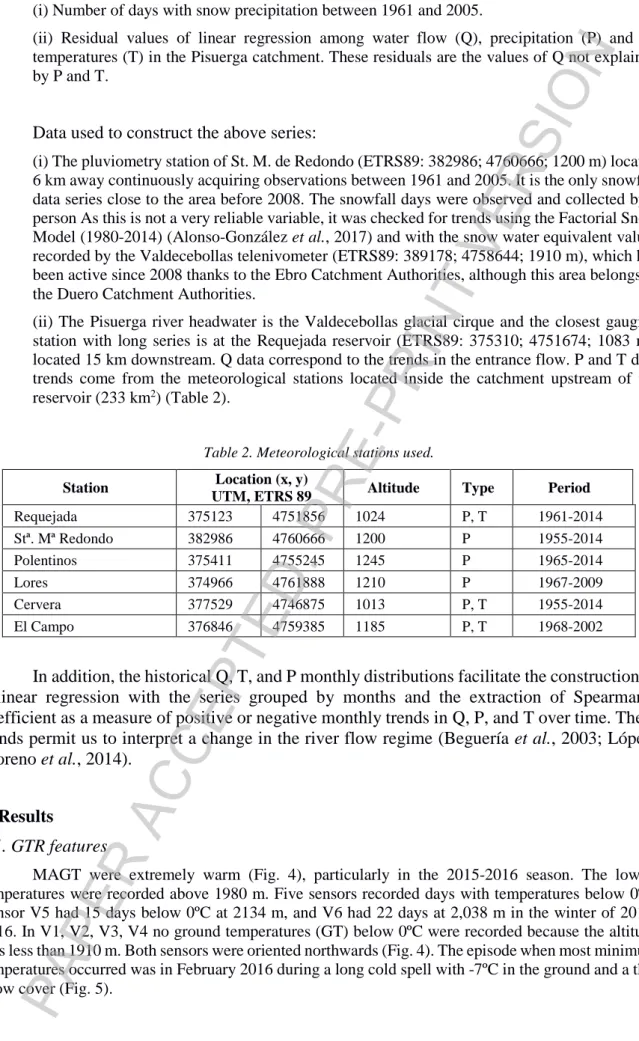
(ii) Residual values of linear regression among water flow (Q), precipitation (P) and air temperatures (T) in the Pisuerga catchment. These residuals are the values of Q not explained by P and T.
Data used to construct the above series:
(i) The pluviometry station of St. M. de Redondo (ETRS89: 382986; 4760666; 1200 m) located 6 km away continuously acquiring observations between 1961 and 2005. It is the only snowfall data series close to the area before 2008. The snowfall days were observed and collected by a person As this is not a very reliable variable, it was checked for trends using the Factorial Snow Model (1980-2014) (Alonso-González et al., 2017) and with the snow water equivalent values recorded by the Valdecebollas telenivometer (ETRS89: 389178; 4758644; 1910 m), which has been active since 2008 thanks to the Ebro Catchment Authorities, although this area belongs to the Duero Catchment Authorities.
(ii) The Pisuerga river headwater is the Valdecebollas glacial cirque and the closest gauging station with long series is at the Requejada reservoir (ETRS89: 375310; 4751674; 1083 m), located 15 km downstream. Q data correspond to the trends in the entrance flow. P and T data trends come from the meteorological stations located inside the catchment upstream of the reservoir (233 km2) (Table 2).
Table 2. Meteorological stations used.
Station Location (x, y)
UTM, ETRS 89 Altitude Type Period
Requejada 375123 4751856 1024 P, T 1961-2014
Stª. Mª Redondo 382986 4760666 1200 P 1955-2014
Polentinos 375411 4755245 1245 P 1965-2014
Lores 374966 4761888 1210 P 1967-2009
Cervera 377529 4746875 1013 P, T 1955-2014
El Campo 376846 4759385 1185 P, T 1968-2002
In addition, the historical Q, T, and P monthly distributions facilitate the construction of
a linear regression with the series grouped by months and the extraction of Spearman’s
coefficient as a measure of positive or negative monthly trends in Q, P, and T over time. These
trends permit us to interpret a change in the river flow regime (Beguería
et al.
, 2003;
López-Moreno
et al.
, 2014).
4. Results
4.1. GTR features
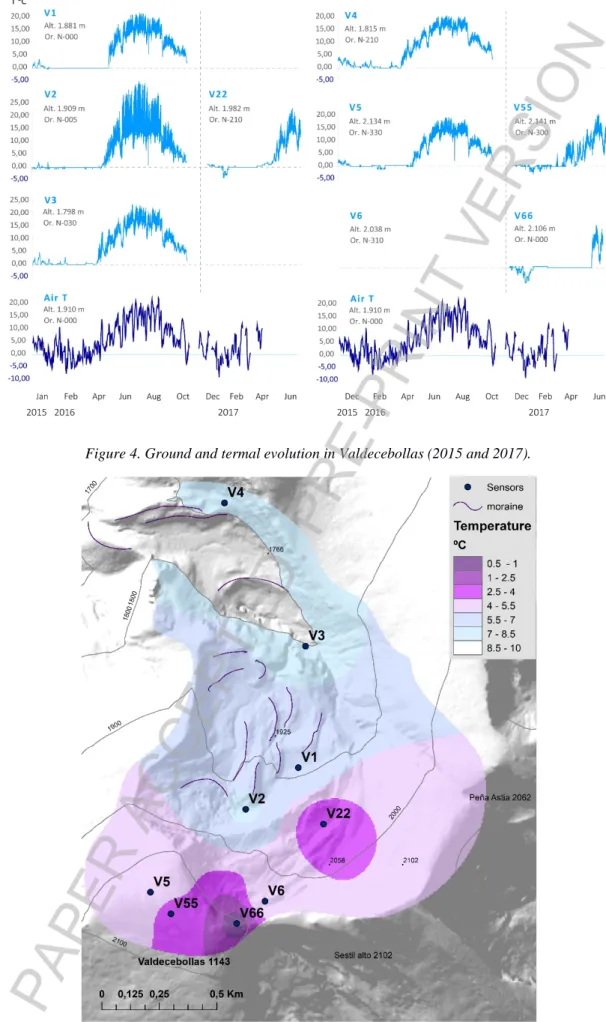
MAGT were extremely warm (Fig. 4), particularly in the 2015-2016 season. The lowest temperatures were recorded above 1980 m. Five sensors recorded days with temperatures below 0ºC. Sensor V5 had 15 days below 0ºC at 2134 m, and V6 had 22 days at 2,038 m in the winter of 2015-2016. In V1, V2, V3, V4 no ground temperatures (GT) below 0ºC were recorded because the altitude was less than 1910 m. Both sensors were oriented northwards (Fig. 4). The episode when most minimum temperatures occurred was in February 2016 during a long cold spell with -7ºC in the ground and a thin snow cover (Fig. 5).
PAPER
ACCEPTED.
PRE-PRINT
Figure 4. Ground and termal evolution in Valdecebollas (2015 and 2017).
Figure 5. MAGT in the study area.
PAPER
ACCEPTED.
PRE-PRINT
During 2016 temperatures did not fall below -2ºC. In the winter of 2016-2017 the threshold of -2ºC was crossed by V22 (7 days) and V66 (13 days) between December and January with GT of at most -8 ºC on the telenivometer. Between December 2016 and February 2017 GT were recorded below 0 ºC at sensor V55 in addition to the aforementioned V22 (14 days) and V66 (38 days).
With the exception of micro-cycles, which went undetected by the sensors, F/Tc were scarce, with 5 or less in whole data loggers with temperatures below 0ºC. All of these occurred together at the start of winter due to snow cover variability and successive changes in the atmosphere. The curtain effect was inferior to 5 months above 2000 m.
FI is very low in 4 of the 5 mentioned data loggers (V5, V6, V22, V55), between 12 and 20. V66 reaches 80.7. Freeze depth, if was acting directly over the bedrock, would reach 50 cm in V66 due to the higher conductivity of conglomerates present on the top (Table 3). Data loggers V5, V6, V22 and V55 located above 1,982 m would reach 30 cm approximately. Below this threshold (1950 - 2000 m) a clear incidence over the active layer can be ruled out. While it is true that temperatures in the winters analyzed were extremely warm, the thin snow cover favoured cold penetration. The possibility of SFG over very short periods is limited in the top parts (Table 3) depending on the snow cover, relief and cold intensity, e.g. January 2017 with ground temperatures below -2ºC (V55) and down to -6,5ºC (V66), and air temperatures around -8ºC in the telenivometer station at 1910 m.
Table 3. Ground thermal results synthesis.
Code Alt. Asp. Deposit /
Bedrock Year
Days < 0ºC & Days< -2ºC
FI F/Tc Tº C
Winter SFG
Depth frozen ground2
Bedrock
conductivity1 MAAT
V1 1881 N-000 Till /
Conglomerates 15/16 0 0 0,0 0
0,5 a
4 No 0,00 4,32∙10
5 6,66
V2 1909 N-005 Soil /
conglomerates 15/16 0 0 0,0 0
-1 a
2 Unlikely 0,00 4,32∙10
5 7,07
V3 1798 N-030 Coluvial and
till / limestones 15/16 0 0 0,0 0 0 a 5 No 0,00 2,05∙10
5 7,21
V4 1815 N-210 Soil /
Limestone 15/16 0 0 0,0 0 0 a 4 No 0,00 2,05∙10
5 8,05
V5 2134 N-330 Soil /
Conglomerates 15/16 15 0 12,1 2
-2 a
2 Likely 0,28 4,32∙10
5 5,49
V6 2038 N-310 Coluvial /
Conglomerates 15/16 22 0 17,3 4
-2 a
3 Likely 0,31 4,32∙10
5 4,69
V22 1982 N-210 Clay /
Conglomerates 16/17 14 7 26,4 2
-4,5
a 1,5 Yes 0,36 4,32∙10
5 3,38
V55 2141 N-300 Soil /
Conglomerates 16/17 20 0 21,0 5
-2 a
0,5 Yes 0,33 4,32∙10
5 3,69
V66 2106 N-000 Clay /
Conglomerates 16/17 38 13 80,7 3
-6,5
a 0,5 Yes 0,56 4,32∙10
5 0,81
1 Conductivity: 105 J°day (Eppelbaum et al., 2014)
2 Washburn (1979); h(m)= �2𝐾𝐾(𝐹𝐹𝐹𝐹)
𝐶𝐶𝐿𝐿 +d; K (Conductivity); 𝐶𝐶𝐶𝐶(Latent heat 3.34∙10
8 ∙m-3);𝐹𝐹𝐹𝐹(Freeze Index °day); d (sensor depth 0,1m)
The GTR (Fig. 4) had only two clear phases, a warm regime adapted to air temperatures and a short equilibrium phase at around 0ºC in which the snow interferes with heat exchange (Ishikawa, 2003) called curtain effect (Outcalt et al., 1990). Transitional phases did not have a clear progressive trend. The curtain effect phase is short due to the limited snowfalls in these warm years. In V1, V2, V3, and V4 this phase was stable and close to zero reaching March but had positive MAGT in 2016. In V22 and V66 the curtain effect was observed from December 2016 to May 2017. It is feasible this change in GTR behavior indicates the moment of the snowmelt. V55 did not reach this month, the snow cover at the peak probably having disappeared earlier due to higher solar radiation or wind action. The satellite image with reflectance of thermal infrared band (Fig. 6) revealed the places with homogenous and thick snow cover. These reflected a colder response than irregular grounds, e.g. fossil landslide to the southwest of the image. Besides, the shadows of ridges clearly affect decreasing temperatures. The
PAPER
ACCEPTED.
PRE-PRINT
location of sensors with lowest GT, V66 and V55, reflects more energy, which means a thin snowpack because GT was above 0ºC on 20th February 2017 (Fig. 4).
Figure 6. Left: multispectral image. All the image is covered by snow. Right: classification of the reflectance of the spectral band of thermal infrared (B-10). Satellite image. Landsat 8. 23rd February 2017.
4.2. Influence on the landforms
The study area is full of fossil landforms from Pleistocene glacial activity, but also due to a small series of active landforms mostly linked to snow cover dynamics (Fig. 7). The large amounts of snow cover produce enough water melt to elevating moisture and mobilizing sediments along the slope. The active landforms with F/Tc and SFG action are limited to the area above 2000 m where the accumulation of snow is greater. Structural cryoturbations (Fig. 8) are clear above 2100 at the summit and under the north ridge. These processes trigger a certain organization of clasts, though not large enough to construct geometric structures (Ballantyne, 2018). Deposits are rich in clay with a high moisture level. Snow here is not stable due to the action of the wind. Below this summit area, where slopes increase between 2000 and 2100 m, terracettes have developed over shallow slope sediments, but only in the western slopes where the snowpack is reduced due to wind action. In the areas adjoining the terracettes there is brittle bedrock, mudrock lithology, erosion and the development of gullies with rills. There are also well developed solifluction lobes at one point favourable to cold at less than 2000 m. Other solifluction landforms are also visible in the top area. These can trigger the movement of ploughing boulders oriented downslope (Fig. 8), which are active around 2100-2050 m.
Figure 7. Geomorphological map of Valdecebollas massif.
PAPER
ACCEPTED.
PRE-PRINT
Figure 8. a) Cryoturbation at 2050 m, northern slope. b) Needle ice at 1200 m during the cold period of 2016 c) Solifluction lobes in the glacier cirque of Valdecebollas at 1932 m. d) Structural cryoturbations on the top 2143 m e) Terracettes in the glacier western ridge of Valdecebollas. Gullies area is also visible. f) Ploughing
boulder at 2100 m. g) Terracettes and other solifluctional landforms in the Western area of the peak.
These slope movements produced by snowmelt are created in many cases without F/Tc action (Matsuoka, 2001) , but they can also develop landforms deriving from snowmelt as sheets, bank-turf lobes, terraces with very ephemeral events of air freeze able to trigger surface forms such as needle ice above 1200 m. Sometimes freezing at night can develop pipkrake in combination with water melt moving slowly down the slopes. Without freeze features the water melt can also source enough moisture to trigger the movement of slopes and the reactiveness of certain asymmetrical valleys. Snow activity in the past has occurred with other nivation features that do not appear to be active. In the slopes above 1600 m it is possible to identify cryoplanation slopes, nivation hollows and snowbanks, abrasion surfaces and stratified deposits. Moreover, movements of disperse large blocks have taken place. In all of these landforms movement can be ruled out due to the arboreal and shrub vegetation. Landforms deriving from SFG are more disperse and only above slopes on which the snowpack does not accumulate. There are some block slopes and debris talus and cones.
4.3. Relationship between snow cover over runoff and river peak flow regimes
Days of snowfall at the pluviometry station of Stª Mª de Redondo (Fig. 9) fit well to the snow water equivalent modelled by Alonso-González et al. (2017) with a spatial resolution of 10 km and thickness recorded in situ by the telenivometer station.
PAPER
ACCEPTED.
PRE-PRINT
Figure 9. Standardized comparison of different snow variables with the objective of checking if snowfall days variable is able to approximate the main trends in volume of snow. In the period with overlapping there are
similar trends so snowfall days data can be considered useful.
Snowfall days and the residuals of the linear regression of Q = aP+bT+c (Fig. 10) have a significant bivariate correlation at a correlation level of α < 0,01 (double tail) with a high Spearman’s correlation coefficient ρ=0.412. The correlation is particularly strong after 1987 with fewer snowfalls.
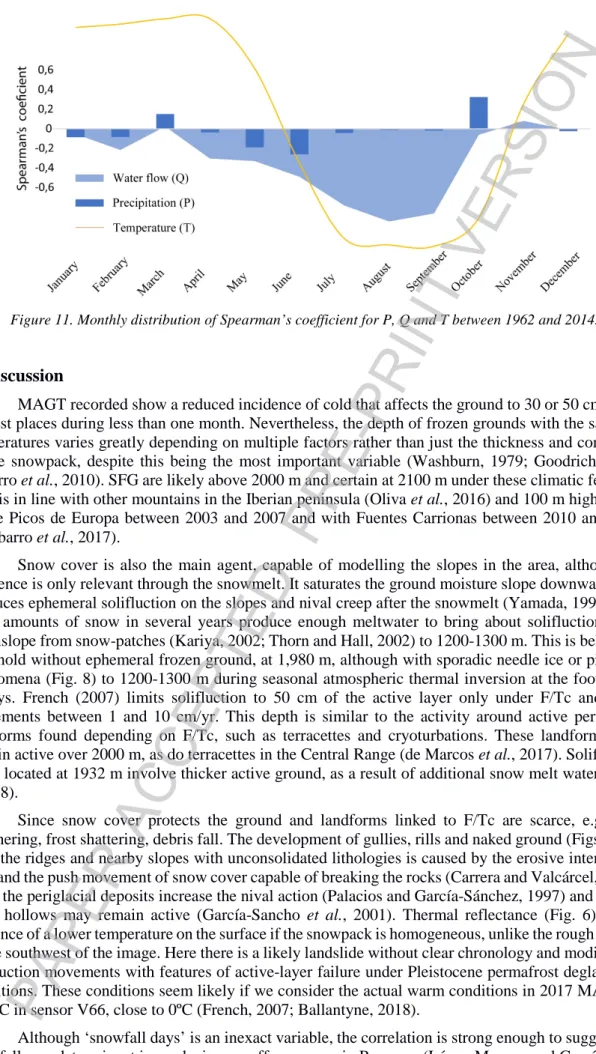
On a monthly scale, the Spearman correlation coefficient indicates statistically significant changes in trends in water flow and temperature (Fig. 11). It exhibits significant decreasing trends in water flows between June and September. In the case of temperatures, trends differ greatly between winter and spring with respect to those of summer and early autumn. Nevertheless, there are no significant changes in monthly precipitations.
Figure 10. Temporal evolution of residuals of linear regression (Q = aP+bT+c) and snowfall days in Stª Mª de Redondo.
PAPER
ACCEPTED.
PRE-PRINT
Figure 11. Monthly distribution of Spearman’s coefficient for P, Q and T between 1962 and 2014.
5. Discussion
MAGT recorded show a reduced incidence of cold that affects the ground to 30 or 50 cm in the coldest places during less than one month. Nevertheless, the depth of frozen grounds with the same air temperatures varies greatly depending on multiple factors rather than just the thickness and continuity of the snowpack, despite this being the most important variable (Washburn, 1979; Goodrich, 1982; Tanarro et al., 2010). SFG are likely above 2000 m and certain at 2100 m under these climatic features. This is in line with other mountains in the Iberian peninsula (Oliva et al., 2016) and 100 m higher than in the Picos de Europa between 2003 and 2007 and with Fuentes Carrionas between 2010 and 2012 (Pisabarro et al., 2017).
Snow cover is also the main agent, capable of modelling the slopes in the area, although its incidence is only relevant through the snowmelt. It saturates the ground moisture slope downwards and produces ephemeral solifluction on the slopes and nival creep after the snowmelt (Yamada, 1999). The huge amounts of snow in several years produce enough meltwater to bring about solifluction, even downslope from snow-patches (Kariya, 2002; Thorn and Hall, 2002) to 1200-1300 m. This is below the threshold without ephemeral frozen ground, at 1,980 m, although with sporadic needle ice or pipkrake phenomena (Fig. 8) to 1200-1300 m during seasonal atmospheric thermal inversion at the foot of the valleys. French (2007) limits solifluction to 50 cm of the active layer only under F/Tc and slope movements between 1 and 10 cm/yr. This depth is similar to the activity around active periglacial landforms found depending on F/Tc, such as terracettes and cryoturbations. These landforms only remain active over 2000 m, as do terracettes in the Central Range (de Marcos et al., 2017). Solifluction lobes located at 1932 m involve thicker active ground, as a result of additional snow melt water inputs (Fig. 8).
Since snow cover protects the ground and landforms linked to F/Tc are scarce, e.g. frost weathering, frost shattering, debris fall. The development of gullies, rills and naked ground (Figs. 6 and 7) in the ridges and nearby slopes with unconsolidated lithologies is caused by the erosive intensity of cold and the push movement of snow cover capable of breaking the rocks (Carrera and Valcárcel, 2010). Even the periglacial deposits increase the nival action (Palacios and García-Sánchez, 1997) and several nival hollows may remain active (García-Sancho et al., 2001). Thermal reflectance (Fig. 6) shows evidence of a lower temperature on the surface if the snowpack is homogeneous, unlike the rough ground in the southwest of the image. Here there is a likely landslide without clear chronology and modified by solifluction movements with features of active-layer failure under Pleistocene permafrost deglaciation conditions. These conditions seem likely if we consider the actual warm conditions in 2017 MAGT of 0.81ºC in sensor V66, close to 0ºC (French, 2007; Ballantyne, 2018).
Although ‘snowfall days’ is an inexact variable, the correlation is strong enough to suggest that snowfalls are determinant in producing runoff, as occurs in Pyrenees (López-Moreno and García-Ruiz,
PAPER
ACCEPTED.
PRE-PRINT
2004). While it is true that there are doubts as to whether pluviometers underestimate precipitations in snowfall (Buisán et al., 2017), from the data the influence of the snowpack over runoff is clear. Nor is the karstic environment at some points responsible for water loss by catchment changes (Alcalde, 1981) in the Pisuerga headwaters where the Cobre cave drives water to the Pisuerga.
On a monthly scale, P, Q and T, significant changes can be seen as Morán-Tejeda (2012) stated in this same reservoir using management data. The Spearman’s coefficient of Q decreased greatly in spring and early summer and increased in winter. Q change in spring may be slightly related with P change, but the influence of T seems to be determinant since its decrease is more marked and moves the snowmelt flow peak forward due to the snow melt. This behaviour is in common with other catchments in the Duero/Douro system (Ceballos-Barbancho et al., 2008; Morán-Tejeda et al., 2010). This may be evidence of a less important role of snow in the river regime, with an earlier flow peak. Evidence of this has been found in Pyrennean rivers (García-Ruíz et al., 2015) and could develop less effective geomorphologic activity in spring, as occurs in the Central Range (Palacios et al., 2003) if we take into account the irregularity of snowfalls, which in some years produced exceptional thicknesses (2014-15 and 2017-18).
6. Conclusions
Snow cover is the main variable determining GTR, active periglacial landforms and hydric resources in the Valdecebollas massif and similar behaviors could be expected on areas with similar characteristics (i.e. Cantabrian Mountains).
Even in warm years with a scarce number of snowfalls and snowpack permanence this can limit frost action, and the only active periglacial landforms linked to GTR are above 2000 m in places unfavourable to snowpack accumulation and continuity or in dry and cold years.
Hydric resources are also determined by the snowpack, which dictates the efficacy of solid precipitations by generating more or less runoff. By means of the monthly evolution of flows we can also estimate that the snowpack melts earlier and earlier and can modify peak flows.
Acknowledgements
This research was supported by the Formación de Profesorado Universitario FPU13/05837 (Ministerio de Educación Cultura and Deporte) program, by the I+D+I CGL2015-68144-R (Ministerio de Economia and Competitividad). I would like to thank Manuel Gómez Lende, Alberto Merino and Ramón Pellitero for their support in the fieldwork and to Juan Ignacio López Moreno and Esteban Alonso González for their support with climate analysis and snow data.
References
Adam, J.C., Hamlet, A.F., Lettenmaier, D.P. 2009. Implications of global climate change for snowmelt hydrology in the twenty-first century. Hydrological Processes 23, 962-972. https://doi.org/10.1002/hyp.7201
Alcalde, G. 1981. La Pernía. Estudios del equipo de investigaciones speleo-etnograficas.
Alonso, V. 1989. Glaciares rocosos fósiles en el área Degaña-Leitariegos (occidente de Asturias, Cordillera Cantábrica). Cuaternario y Geomorfología 3, 9-15.
Alonso-González, E., López-Moreno, J.I., Navarro-Serrano, F., Sanmiguel-Vallelado, A., Ceballos-Barbancho, A. 2017. Snowpack Simulation over Iberian Peninsula during 1980-2014.
Andrés, N., Palacios, D. 2010. Cobertura nival y distribución de las temperaturas en el suelo en las cumbres de la Sierra de Guadarrama. Cuadernos de Investigación Geográfica 36 (2), 7-38. https://doi.org/10.18172/cig.1236.
Ballantyne, C.K. 2018.
PAPER
Periglacial Geomorphology. John Wiley & Sons.ACCEPTED.
PRE-PRINT
Beguería, S., López-Moreno, J.I., Lorente, A., Seeger, M., García-Ruiz, J.M. 2003. Assessing the effect of climate oscillations and land-use changes on streamflow in the Central Spanish Pyrenees. AMBIO: A Journal of the Human Environment 32, 283-286. https://doi.org/10.1579/0044-7447-32.4.283.
Buisán, S.T., Earle, M.E., Collado, J.L., Kochendorfer, J., Alastrué, J., Wolff, M., Smith, C.D., López-Moreno, J.I. 2017. Assessment of snowfall accumulation underestimation by tipping bucket gauges in the Spanish operational network. Atmospheric Measurement Techniques 10, 1079. https://doi.org/10.5194/amt-10-1079-2017.
Carrera, P., Valcárcel, M. 2010. La acción geomorfológica del manto nivoso estacional en la Sierra de Ancares: vertiente noriental del Pico Cuiña (León). Cuadernos de Investigación Geográfica 36 (2), 85-98. https://doi.org/10.18172/cig.1239.
Castañón, J.C., Frochoso, M. 1994. El periglaciarismo de la Cordillera Cantábrica. Periglaciarismo de la Península Ibérica, Canarias y Baleares, pp. 75-91.
Castañón, J.C., Frochoso, M. 1998. La alta montaña cantábrica: condiciones térmicas y morfodinámica en los Picos de Europa. In: A. Gómez Ortiz, S. Franch, L. Schulte, A. García Navarro (Eds.), Procesos biofísicos actuales en medios fríos, Universitat de Barcelona, Barcelona, pp. 113-132.
Ceballos-Barbancho, A., Morán-Tejeda, E., Luengo-Ugidos, M.Á., Llorente-Pinto, J.M. 2008. Water resources and environmental change in a Mediterranean environment: The south-west sector of the Duero river basin (Spain). Journal of Hydrology 351, 126-138. https://doi.org/10.1016/j.hydrol.2007.12.004.
Delaloye, R. 2004. Contribution à l’étude du pergélisol de montagne en zone marginale. Université de Fribourg.
Díaz-Martínez, E. 1993. Notas sobre el Glaciarismo y Periglaciarismo Cuaternario de la Sierra de Peña Labra (Cordillera Cantábrica). Actas de la II Reunión del Cuaternario Ibérico, pp. 73-79.
Dobinski, W. 2011. Permafrost. Earth-Science Reviews 108, 158-169. https://doi.org/10.1016/j.earscirev.2011.06.007.
Edwards, A.C., Scalenghe, R., Freppaz, M. 2007. Changes in the seasonal snow cover of alpine regions and its effect on soil processes: A review. Quaternary International 162-163, 172-181. https://doi.org/10.1016/j.quaint.2006.10.027.
Eppelbaum, L., Kutasov, I., Pilchin, A. 2014. Thermal Properties of Rocks and Density of Fluids. In: L. Eppelbaum, I. Kutasov, A. Pilchin (Eds.), Applied Geothermics, Lecture Notes in Earth System Sciences, pp. 99-149. Springer Berlin Heidelberg, Berlin, Heidelberg.
Fengqing, J., Yanwei, Z. 2011. Freezing and Thawing Index. In: Encyclopedia of Snow, Ice and Glaciers, Springer, p. 301. https://doi.org/10.1007/978-3-642-34023-9_2.
Frauenfeld, O.W., Zhang, T., Mccreight, J.L. 2007. Northern Hemisphere freezing/thawing index variations over the twentieth century. International Journal of Climatology 27, 47-63. https://doi.org/10.1002/joc.1372.
French, H.M. 2007. The periglacial environment. John Wiley & Sons, Chichester. https://doi.org/10.1002/9781118684931.
García de Celis, A. 1991. Los glaciares rocosos de la Sierra del Suspirón (León). Polígonos. Revista de Geografía
1, 9-20. https://doi.org/10.18002/pol.v0i1.567.
García de Celis, A. 1993. Geomorfología de la vertiente meridional de la Cordillera Cantábrica la Montaña Occidental de León y su piedemonte. Universidad de León, León.
García de Celis, A. 2002. Formas periglaciares relictas en la Sierra de Suspirón (Cordillera Cantábrica, León): campos de bloques. In: Periglaciarismo en montaña y altas latitudes, Valladolid, pp. 37-52.
García-Hernández, C., Ruiz Fernández, J., Sánchez de Posada, C., Poblete Piedrabuena, M.Á. 2015. El impacto del episodio avalanchoso de 1888 en el Macizo Asturiano, a través de la prensa. In: A. Gómez Ortiz, F. Salvador Franch, M. Oliva Franganillo, M. Salvà Catrineu (Eds.), Avances, métodos y técnicas en el estudio del periglaciarismo, Universitat de Barcelona, Barcelona, pp. 55-64.
García-Hernández, C., Ruiz-Fernández, J., Sánchez-Posada, C., Pereira, S., Oliva, M., Vieira, G. 2017. Reforestation and land use change as drivers for a decrease of avalanche damage in mid-latitude mountains (NW Spain). Global and Planetary Change 153, 35-50. https://doi.org/10.1016/j.gloplacha.2017.05.001.
García-Ruiz, J.M., López-Moreno, J.I., Lasanta, T., Vicente-Serrano, S.M., González-Sampériz, P., Valero-Garcés, B.L., Sanjuán, Y.
PAPER
et al. 2015. Los efectos geoecológicos del cambio global en el Pirineo CentralACCEPTED.
PRE-PRINT
español: una revisión a distintas escalas espaciales y temporales. Pirineos 170, e012. https://doi.org/10.3989/Pirineos.2015.170005.
García-Sancho, L., Palacios, D., de Marcos, J., Valladares, F. 2001. Geomorphological significance of lichen colonization in a present snow hollow: Hoya del Cuchillar de las Navajas, Sierra de Gredos (Spain).
Catena 43, 323-340. https://doi.org/10.1016/S0341-8162(00)00131-4.
Gómez Lende, M., Berenguer, F., Serrano, E. 2014. Morphology, ice types and thermal regime in a high mountain ice cave. First studies applying terrestrial laser scanner in The Peña Castil Ice Cave (Picos de Europa, Northern Spain). Geografia Fisica e Dinamica Quaternaria 37, 141-150.
Gómez-Lende, M. 2015. Las cuevas heladas en Picos de Europa: clima, morfologías y dinámicas. Universidad de Valladolid, Valladolid.
Gómez-Villar, A., González-Gutierrez, R.B., Redondo-Vega, J.M., Santos-González, J. 2013. Distribution of relict rock glaciers in the Cantabrian Mountains (León, Spain). Cuadernos de Investigación Geográfica 37, 49-80. https://doi.org/10.18172/cig.1256.
González Gutiérrez, R. 2002. El relieve de los valles del Torío y Curueño (Montaña Cantábrica Leonesa). Universidad de León. León.
González-Trueba, J.J. 2007a. El Macizo Central de los Picos de Europa: geomorfología y sus implicaciones geoecológicas en la alta montaña cantábrica. Universidad de Cantabria, Santander.
González-Trueba, J.J. 2007b. Geomorfología del Macizo Central en el Parque Nacional de Picos de Europa. OAPN, Ministerio de Medio Ambiente, Madrid.
González-Trueba, J.J., Serrano, E. 2010a. Geomorfología del Macizo Oriental del Parque Nacional de Picos de Europa. OAPN, Ministerio de Medio Ambiente, Madrid.
González-Trueba, J.J., Serrano, E. 2010b. La nieve en los Picos de Europa: implicaciones geomorfológicas y ambientales. Cuadernos de Investigación Geográfica 36 (2),61-84. https://doi.org/10.18172/cig.1238.
González-Trueba, J.J., Serrano, E., González-García, M. 2012. Geomorfología del Macizo Occidental del Parque Nacional de Picos de Europa. OAPN, Ministerio de Medio Ambiente, Madrid.
Goodrich, L.E. 1982. The influence of snow cover on the ground thermal regime. Canadian Geotechnical Journal
19, 421-432. https://doi.org/10.1139/t82-047.
Hernández Holgado, O. 2014. Una aproximación a la nivología en los Picos de Europa. Nota Técnica de AEMET
15, 39 pp.
Hernández-Pacheco, F. 1944. Fisiografía, geología y glaciarismo cuaternario de las montañas de Reinosa.
Memorias de la Real Academia de Ciencias Exactas, Físicas y Naturales de Madrid 10, 190 pp.
IGUL 1996. Légende pour le levé de cartes géomorphologiques au 1:10.000, Institut de Géographie. Université de Lausanne, 3émé edition, 13 pp.
Ishikawa, M. 2003. Thermal regimes at the snow-ground interface and their implications for permafrost investigation. Geomorphology, 52 (1-2), 105-120. https://doi.org/10.1016/S0169-555X(02)00251-9.
Kane, D.L., Soden, D., Hinzman, L.D., Gieck, R. 1998. Rainfall runoff of a nested watershed in the alaskan arctic. In Permafrost: Procedings of 7th International Conferenc., Université Laval, pp. 539-543.
Kariya, Y. 2002. Geomorphic processes at a snowpatch hollow on Gassan volcano, northern Japan. Permafrost and Periglacial Processes 13, 107-116. https://doi.org/10.1002/ppp.412.
López-Moreno, J.I., García-Ruiz, J.M. 2004. Influence of snow accumulation and snowmelt on streamflow in the central Spanish Pyrenees. Hydrological Sciences Journal 49, 787-802. https://doi.org/10.1623/hysj.49.5.787.55135.
López-Moreno, J.I., Zabalza, J., Vicente-Serrano, S.M., Revuelto, J., Gilaberte, M., Azorin, C., Morán, E. et al.
2014. Impact of climate and land use change on water availability and reservoir management: Scenarios in the Upper Aragón River, Spanish Pyrenees. Science of The Total Environment 493, 1222-1231. https://doi.org/10.1016/j.scitotenv.3013.09.031.
de Marcos, J., Tanarro, L.M., Palacios, D., Andrés, N. 2017. Procesos periglaciares actuales en la sierra de Guadarrama: las terracillas de solifluxión. In: J. Ruiz-Fernández, C. García-Hernández, M. Oliva, C. Rodríguez-Pérez, D. Gallinar (Eds.), Ambientes periglaciares: avances en su estudio, valoración patrimonial y riesgos asociados
PAPER
, Servicio de Publicaciones de la Universidad de Oviedo, pp. 83-84ACCEPTED.
PRE-PRINT
Matsuoka, N. 2001. Solifluction rates, processes and landforms: a global review. Earth-Science Reviews 55, 107-134. https://doi.org/10.1016/S0012-8252(01)00057-5.
Morán-Tejeda, E. 2012. Impactos recientes de los cambios ambientales en los recursos hídricos superficiales de la cuenca del Duero. Pirineos 167, 107-142. https://doi.org/10.3989/Pirineos.2012.167006.
Morán-Tejeda, E., Ceballos-Barbancho, A., Llorente, J.M. 2010. Hydrological response of Mediterranean headwaters to climate oscillations and land-cover changes: The mountains of Duero River basin (Central Spain). Global and Planetary Change 72, 39-49. https://doi.org/10.1016/gloplacha.2010.03.003.
Nossin, J.J. 1959. Geomorphological aspects of the Pisuerga drainage area in the Cantabrian Mountains (Spain).
Leidse Geologische Mededelingen 24, 283-406.
Oliva, M., Gómez Ortiz, A., Salvador, F., Salvà, M., Pereira, P., Geraldes, M. 2014. Long-term soil temperature dynamics in the Sierra Nevada, Spain. Geoderma 235-236, 170-181. https://doi.org/10.1016/j.geoderma.2014.07.012.
Oliva, M., Serrano, E., Gómez-Ortiz, A., González-Amuchastegui, M.J., Nieuwendam, A., Palacios, D., Pérez-Alberti, A. et al. 2016. Spatial and temporal variability of periglaciation of the Iberian Peninsula.
Quaternary Science Reviews 137, 176-199. https://doi.org/10.1016/j.quascirev.2016.02.017.
Oliva, M., Žebre, M., Guglielmin, M., Hughes, P.D., Çiner, A., Vieira, G., Bodin, X. et al. 2018. Permafrost conditions in the Mediterranean region since the Last Glaciation. Earth-Science Reviews 185, 397-436. https://doi.org/10.1016/j.earscirev.2018.06.018.
Outcalt, S.I., Nelson, F.E., Hinkel, K.M. 1990. The zero-curtain effect: Heat and mass transfer across an isothermal region in freezing soil. Water Resources Research 26, 1509-1516. https://doi.org/10.1029/WR026i007p01509.
Palacios, D., de Andrés, N., Luengo, E. 2003. Distribution and effectiveness of nivation in Mediterranean mountains: Peñalara (Spain). Geomorphology 54, 157-178. https://doi.org/10.1016/S0169-555X(02)00340-9.
Palacios, D., García-Sánchez, M. 1997. The influence of geomorphologic heritage on present nival erosion: peñalara, spain. Geografiska Annaler: Series A, Physical Geography 79, 25-40. https://doi.org/10.1111/j.0435-3676.1997.00004.x.
Pellitero, R. 2013. Geomorfología, paleoambiente cuaternario y geodiversidad en el macizo de Fuentes Carrionas-Montaña Palentina. Universidad de Valladolid, Valladolid.
Pellitero, R. 2014. Geomorphology and geomorphological landscapes of Fuentes Carrionas. Journal of Maps 10, 313-323. https://doi.org/10.1080/17445647.2013.867822.
Pellitero, R., Serrano, E. 2008. La Montaña Palentina: el macizo de Valdecebollas y los valles de Brañosera y Redondos. In: P. Ruiz Flaño, E. Serrano, M.A. Poblete, J. Ruiz Fernández (Coords.), De Castilla al Mar: la naturaleza del paisaje en la Montaña Cantábrica, pp.37-68.
Pellitero, R., Serrano, E. 2012. La nieve como agente geomorfológico en la cara N del pico Curavacas (Cordillera Cantábrica). In: A. González Díez (Coord.), Avances de Geomorfología en España, Universidad de Cantabria, Santander, pp. 633-636.
Pellitero, R., Serrano, E., González-Trueba, J.J. 2011. Glaciares rocosos del sector central de la Montaña Cantábrica: indicadores paleoambientales. Cuadernos de Investigación Geográfica 37 (2), 119-144. https://doi.org/10.18172/cig.1259.
Pisabarro, A., Pellitero, R., Serrano, E., Gómez-Lende, M., González-Trueba, J.J. 2017. Ground temperatures, landforms and processes in an Atlantic mountain. Cantabrian Mountains (Northern Spain). Catena 149 (2), 623-636. https://doi.org/10.1016/j.catena.2016.07.051.
Pisabarro, A., Serrano, E., González Trueba, J.J. 2015. Régimen térmico de suelos del macizo central de Picos de Europa (España). Pirineos 170, e010. https://doi.org/10.3989.2015.170003.
Pisabarro, A. 2019. Cambio global y respuestas ambientales en la Cordillera Cantábrica: el Alto Pisuerga (tesis doctoral, scheduled for 2019). Universidad de Valladolid, Valladolid.
Poblete, M.Á., Beato, S., Marino, J.L. 2016. Los aludes de nieve en el Alto Aller: su incidencia en la carretera AS-253 del Puerto de San Isidro (Macizo Central Asturiano). In: J.J. Durán, M. Montes Santiago, A. Robador, A. Salazar (Eds.), Comprendiendo el relieve: del pasado al futuro. Actas de la XIV Reunión Nacional de
Geomorfología.
PAPER
Instituto Geológico y Minero de España, Madrid,pp. 751-758.ACCEPTED.
PRE-PRINT
Redondo-Vega, J.M., Gómez Villar, A., González-Gutiérrez, R.B. 2004. Localización y caracterización morfométrica de los glaciares rocosos relictos de la Sierra de Gistredo (Montaña Cantábrica, León).
Cuadernos de Investigación Geográfica 30, 35-61. https://doi.org/10.18172/cig.1134.
Reynard, E., Lambiel, C. (2015). La cartographie géomorphologique au service de la lecture du paysage. Bulletin de la Murithienne 132, 43-44.
Rodríguez-Pérez, C. 2009. Geomorfología de la Montaña Astur-Leonesa entre los puertos de Somiedo y de Ventana. Universidad de Oviedo, Oviedo.
Rodríguez-Rodríguez, L., Jiménez-Sánchez, M., Domínguez-Cuesta, M.J., Rinterknecht, V., Pallàs, R., Bourlès, D. 2016. Chronology of glaciations in the Cantabrian Mountains (NW Iberia) during the Last Glacial Cycle based on in situ-produced 10Be. JQSR Quaternary Science Reviews 138, 31-48. https://doi.org/10.1016/j.quascirev.2016.02.027.
Ruiz-Fernández, J., Poblete, M.A., García, C. 2015. Características morfoclimáticas y procesos y formas periglaciares actuales en el Macizo Occidental de los Picos de Europa (Cordillera Cantábrica). In: A. Gómez Ortiz, F. Derran Salvador Franch, M. Oliva Franganillo, M. Salvà Catarineu (Eds.), Avances, métodos y técnicas en el estudio del periglaciarismo. Universitat de Barcelona. Barcelona, pp.91-103.
Sanmiguel-Vallelado, A., Morán-Tejeda, E., Alonso-González, E., López-Moreno, J.I. 2017. Effect of snow on mountain river regimes: an example from the Pyrenees. Frontiers of Earth Science 11 (3), 515-530. https://doi.org/10.1007/s11707-016-0630-z.
Santos-González, J. 2011. Glaciarismo y periglaciarismo en el Alto Sil, provincia de León (Cordillera Cantábrica). Tesis Doctoral, Universidad de León.
Santos-González, J., González-Gutiérrez, R., Gómes-Villar, A., Redondo-Vega, J. 2009. Ground thermal regime in the vicinity of relict rock glaciers (Cantabrian Mountains, NW Spain). Finisterra 44, 35-44. https://doi.org/10.18055/Finis1375.
Serrano, E., Gómez-Lende, M., Pisabarro, A. 2016. Nieve y riesgo de aludes en la montaña cantábrica: el alud de Cardaño de Arriba, alto Carrión (Palencia). Polígonos. Revista de Geografía 28, 239-264. https://doi.org/10.18002/pol.v0i28.4295.
Serrano, E., González-Trueba, J.J. 2004a. El método AAR para la determinación de paleo-ELAs: Análisis metodológico y aplicación en el Macizo de Valdecebollas (Cordillera Cantábrica). Cuadernos de Investigación Geográfica 30,7-34. https://doi.org/10.18172/cig.1133.
Serrano, E., González-Trueba, J.J. 2004b. Morfodinámica periglaciar en el Grupo Peña Vieja (macizo central de los Picos de Europa -Cantabria-). Cuaternario y Geomorfología 18, 73-88.
Serrano, E., González-Trueba, J.J., Pellitero, R., González-García, M., Gómez-Lende, M. 2013. Quaternary glacial evolution in the Central Cantabrian Mountains (Northern Spain). Geomorphology 196, 65-82. https://doi.org/10.1016/j.geomorph.2012.05.001.
Serrano, E., González-Trueba, J.J., Sanjosé, J.J., Del Río, L.M. 2011. Ice patch origin, evolution and dynamics in a temperate high mountain environment: the Jou Negro, Picos de Europa (NW Spain). Geografiska Annaler: Series A, Physical Geography 93, 57-70. https://doi.org/10.1111/j.1468-0459.2011.00006.x.
Serrano, E., Gutiérrez, A. 2000. Las huellas de la última glaciación en Campoo. Cuadernos de Campoo 20, 4-14.
Serrano, E., López-Moreno, J.I., Martín-Moreno, R., Gómez-Lende, M., Pisabarro, A., González-García, M., Rico, I., Alonso-González, E. 2018. Frozen ground, periglacial processes and mountain permafrost in the Monte Perdido-Tucarroya massif (The Pyrenees). In: P. Deline, X. Bodin, L. Ravenel (Eds.), 5th European Conference on Permafrost, Book of Abstracts, Laboratoire EDYTEM, Chamonix, pp. 992-993.
Tanarro, L.M., Palacios, D., Zamorano, J.J., Gómez-Ortiz, A. 2010. Cubierta nival, permafrost y formación de flujos superficiales en un talud detrítico de alta montaña (Corral del Veleta, Sierra Nevada, España).
Cuadernos de Investigación Geográfica 36 (2),39-60. https://doi.org/10.18172/cig.1237.
Thorn, C.E., Hall, K. 2002. Nivation and cryoplanation: the case for scrutiny and integration. Progress in Physical Geography 26, 533-550. https://doi.org/10.1191/0309133302pp351ra.
Ugarte, F.M. 1992. Glacial and periglacial morphogenesis in the Basque mountains. The Late Quaternary in the Western Pyrenean Region. Universidad del País Vasco, Bilbao pp. 235-250.
Vada, J.A., Frochoso, M., Rodríguez, V., Mediavilla, A., Hernández, H., Sanz, M., González, Furdada, G. 2013. Análisis del alud del 8 de mayo de 2012 en los Llanos del Tornu. Macizo Central de los Picos de Europa.
Neu Allaus 5, 4-11.
PAPER
ACCEPTED.
PRE-PRINT
Vada, J.A., Frochoso, M., Vilaplana, J.M. 2012. Assessment and mapping of snow avalanche risk on the walking track to access to Vega de Urriellu, Picos de Europa (NW of Spain). Cuaternario y Geomorfologia 26, 29-47.
Vieira, G.T., Mora, C., Ramos, M. 2003. Ground temperature regimes and geomorphological implications in a Mediterranean mountain (Serra da Estrela, Portugal). Geomorphology 52, 57-72. https://doi.org/10.1016/S0169-555X(02)00248-9.
Washburn, A.L. 1979. Geocryology: a survey of periglacial processes and environments. Wiley, Chichester.
Woo, M. 2012. Permafrost Hydrology. Springer Science & Business Media. https://doi.org/10.1007/978-3-642-23462-0.
Wozniak, E., Marquínez, J. 2004. Evaluación de la susceptibilidad por aludes de nieve a escala regional: el caso de Asturias. In: G. Benito, A. Díaz-Herrero (Eds.), Riesgos Naturales y Antrópicos en Geomorfología,
Centro de Ciencias Medioambientales, Madrid, pp.509-518.
Yamada, S. 1999. The role of soil creep and slope failure in the landscape evolution of a head water basin: field measurements in a zero order basin of northern Japan. Geomorphology 28, 329-344. https://doi.org/10.1016/S0169-555X(98)00113-5.
Zhang, T. 2005. Influence of the seasonal snow cover on the ground thermal regime: An overview. Reviews of Geophysics 43 RG4002. https://doi.org/10.1029/2004RG000157.