Systematic Identification of MCU Modulators by Orthogonal
Interspecies Chemical Screening
Daniela M. Arduino1,2, Jennifer Wettmarshausen1,2, Horia Vais3, Paloma Navas-Navarro4, Yiming Cheng1,2, Anja Leimpek1,2, Zhongming Ma3, Alba Delrio-Lorenzo4, Andrea
Giordano1,2, Cecilia Garcia-Perez1,2, Guillaume Médard5, Bernhard Kuster5,6, Javier García-Sancho4, Dejana Mokranjac7, J. Kevin Foskett3,8, M. Teresa Alonso4, and Fabiana
Perocchi1,2,9,*
1Gene Center/Department of Biochemistry, Ludwig-Maximilians Universität München, Munich
81377, Germany
2Institute for Diabetes and Obesity, Helmholtz Zentrum München, Neuherberg 85764, Germany 3Department of Physiology, Perelman School of Medicine, University of Pennsylvania,
Philadelphia, PA 19104, USA
4Instituto de Biología y Genética Molecular (IBGM), University of Valladolid and Consejo Superior
de Investigaciones Científicas (CSIC), Valladolid 47003, Spain
5Chair for Proteomics and Bioanalytics, Technical University Munich, Freising 85354, Germany 6Center for Integrated Protein Science Munich, Freising 85354, Germany
7Biomedical Center, Department of Physiological Chemistry, Ludwig-Maximilians Universität
München, Martinsried 81377, Germany
8Department of Cell and Developmental Biology, Perelman School of Medicine, University of
Pennsylvania, Philadelphia, PA 19104, USA
SUMMARY
The mitochondrial calcium uniporter complex is essential for calcium (Ca2+) uptake into mitochondria of all mammalian tissues, where it regulates bioenergetics, cell death, and Ca2+ signal transduction. Despite its involvement in several human diseases, we currently lack
pharmacological agents for targeting uniporter activity. Here we introduce a high-throughput assay that selects for human MCU-specific small-molecule modulators in primary drug screens. Using isolated yeast mitochondria, reconstituted with human MCU, its essential regulator EMRE, and aequorin, and exploiting a D-lactate-and mannitol/sucrose-based bioenergetic shunt that greatly
*Correspondence: [email protected]. 9Lead Contact
SUPPLEMENTAL INFORMATION
Supplemental Information includes seven figures and can be found with this article online at http://dx.doi.org/10.1016/j.molcel. 2017.07.019.
AUTHOR CONTRIBUTIONS
D.M.A. and F.P. conceived the idea for this project and designed the experiments. D.M.A., J.W., H.V., P.N.-N., A.L., Z.M., A.G.,
C.G.-HHS Public Access
Author manuscript
Mol Cell
. Author manuscript; available in PMC 2018 August 17.Published in final edited form as:
Mol Cell. 2017 August 17; 67(4): 711–723.e7. doi:10.1016/j.molcel.2017.07.019.
A
uthor Man
uscr
ipt
A
uthor Man
uscr
ipt
A
uthor Man
uscr
ipt
A
uthor Man
uscr
minimizes false-positive hits, we identify mitoxantrone out of more than 600 clinically approved drugs as a direct selective inhibitor of human MCU. We validate mitoxantrone in orthogonal mammalian cell-based assays, demonstrating that our screening approach is an effective and robust tool for MCU-specific drug discovery and, more generally, for the identification of compounds that target mitochondrial functions.
In Brief
Arduino et al. develop a high-throughput drug discovery strategy to identify chemical modulators of the mitochondrial calcium uniporter. They find that mitoxantrone is a selective and direct inhibitor of the MCU channel.
INTRODUCTION
For over half a century, it has been recognized that large amounts of Ca2+ can rapidly enter the matrix of mammalian mitochondria through an electrogenic mechanism driven by the large voltage generated across the inner mitochondrial membrane (IMM) during oxidative phosphorylation (OXPHOS) (Deluca and Engstrom, 1961; Vasington and Murphy, 1962). Subsequently, direct electrophysiological recordings of IMM Ca2+ currents demonstrated that the so-called mitochondrial calcium uniporter that mediates these fluxes was a Ca2+ -selective ion channel with a remarkably high capacity (Kirichok et al., 2004). During the last few years, the molecular identity and composition of the uniporter have been unraveled, including the poreforming subunit MCU (Baughman et al., 2011; Chaudhuri et al., 2013; De Stefani et al., 2011) and several positive and negative regulators (De Stefani et al., 2016; Foskett and Philipson, 2015).
Genetic loss- and gain-of-function analyses have shown that MCU-dependent regulation of mitochondrial matrix Ca2+ concentration (mt-Ca2+) is required for numerous biological processes, including hormone secretion, neurotransmission, muscle contraction, and cell death (Marchi and Pinton, 2014). MCU dysregulation has been associated with a wide range
A
uthor Man
uscr
ipt
A
uthor Man
uscr
ipt
A
uthor Man
uscr
ipt
A
uthor Man
uscr
of human diseases, from cancer to metabolic syndrome, myopathies, and neurological diseases, whereas its ablation protects brain and heart from ischemic injury induced by mt-Ca2+ overload (Mammucari et al., 2016). Strategies to modulate MCU activity are of great biomedical interest and could have broad therapeutic applications (Giorgi et al., 2012). Nevertheless, pharmacological agents that directly target MCU are not yet available. Chemical inhibitors of MCU are limited to ruthenium red (RuR) and its derivatives (Moore, 1971; Nathan et al., 2017; Ying et al., 1991), which lack specificity and are generally membrane impermeable. Thus, there is a need to identify lead compounds that directly target MCU.
Drug discovery depends on the availability of robust, affordable, and highly selective assays for high-throughput screening (HTS) (Walters and Namchuk, 2003). At present, none of the methods commonly employed to quantify MCU-mediated Ca2+ dynamics, for example, Ca2+ imaging in cell-based assays and patch-clamp electrophysiology of mitoplasts, have been optimized for HTS. The biophysical properties of uniporter-mediated Ca2+ uptake pose a major challenge: the entry of Ca2+ in mitochondria is driven by the same steep membrane potential (mt-Δψ) used to produce ATP (Gunter and Gunter, 1994). Moreover, MCU is an intracellular target, and its activity depends on increases of cytoplasmic Ca2+ concentrations by signaling events upstream of mitochondria. Accordingly, there is the potential in cell-based assays for false-positive hits that only apparently modulate MCU-mediated Ca2+ uptake, including those that affect the electron transport chain (ETC), tricarboxylic acid (TCA) cycle, mt-Δψ, mitochondrial membrane integrity, or other components of
intracellular Ca2+-signaling networks. An effective assay to be used in a primary HTS at the early stage of drug discovery must be designed to report on specific modulation of MCU activity while minimizing false-positive hits.
Here we introduce a robust HTS assay that effectively minimizes false discovery rate, greatly facilitating the discovery of specific MCU modulators. We employ mitochondria from the yeast S. cerevisiae, which lacks MCU (Carafoli and Lehninger, 1971), providing a null background. Human MCU and its essential regulator EMRE (Kovács-Bogdán et al., 2014) are reconstituted into the yeast IMM, and MCU-mediated Ca2+ uptake is
quantitatively measured by the Ca2+-sensitive photoprotein aequorin (Bonora et al., 2013) stably expressed in the mitochondrial matrix (mt-AEQ). Key to our approach is the exploitation of a D-lactate- and mannitol/sucrose-based bionenergetic shunt unique to mitochondria from S. cerevisiae that enables mt-Δψ to be maintained in the absence of much of the ETC and in the presence of mitochondrial uncouplers. This feature greatly eliminates many false-positive hits. In a primary screen of ~700 small molecules, we identify mitoxantrone as a selective and specific inhibitor of MCU. Our orthogonal, interspecies drug-screening strategy lays the foundation for accelerating the discovery of small-molecule pharmacological agents directed against MCU.
RESULTS
A Yeast-Based Bioenergetic Shunt as a Tool to Identify Specific MCU Inhibitors
A primary challenge in developing MCU-specific drug-screening approaches consists in minimizing the false discovery rate due to compounds that compromise the driving force for
A
uthor Man
uscr
ipt
A
uthor Man
uscr
ipt
A
uthor Man
uscr
ipt
A
uthor Man
uscr
Ca2+ uptake, for example, inhibitors of mitochondrial bioenergetics and agents that dissipate mt-Δψ. Yeast mitochondria contain a D-lactate dehydrogenase (DLD) that transfers
electrons directly to cytochrome c upon oxidation of D-lactate into pyruvate (Figure 1A) (Pajot and Claisse, 1974). When D-lactate is used as the respiratory substrate, it provides a bioenergetic shunt, bypassing the TCA cycle and the ETC upstream of complex IV while still generating sufficient electron transfer to develop a considerable mt-Δψ. Furthermore, the yeast IMM is only slightly affected by uncoupling agents, for example, the protonophore carbonyl cyanide m-chlorophenylhydrazone (CCCP), when the organelle is assayed in isosmotic respiratory media (e.g., mannitol/sucrose [MAS]), enabling mt-Δψ to be relatively insensitive to non-specific uncoupling.
We reconstituted and quantified human uniporter activity in the IMM of yeast mitochondria by heterologous co-expression of full-length human MCU, its essential regulator EMRE, and mt-AEQ (Figure 1B). The addition of a Ca2+ bolus triggered a luminescence signal that was inhibited by Ru360, confirming the functional reconstitution of uniporter-mediated Ca2+ uptake (Figure 1C). Ru360-dependent inhibition could be rescued by the concomitant addition of an electrogenic Ca2+ ionophore (ETH129), indicating that the mt-Δψ of reconstituted yeast mitochondria was intact and provided a sufficient driving force for Ca2+ uptake. As expected, mitochondria fueled with D-lactate were able to take up Ca2+, even in the presence of specific ETC inhibitors, for example, malonate and antimycin A (Figures 1D and 1E). In contrast, mt-Ca2+ uptake was dramatically reduced in the presence of the same ETC inhibitors with succinate as the substrate. Likewise, mt-Ca2+ uptake was not affected by the addition of CCCP in a MAS buffer, whereas it was abolished in a KCl-based,
intracellular-like medium (Figures 1D and 1E). Together, these results establish reconstituted yeast mitochondria energized with D-lactate in an isosmotic media as a drug-screening assay with the potential ability to discriminate against false-positive MCU modulators in early stages of drug discovery.
Drug Screening in MCU-Reconstituted Yeast Mitochondria
We optimized the yeast mitochondria-based assay for small-molecule HTS (Figure 2A). To achieve a high signal-to-noise ratio, we selected an exogenous-free [Ca2+], coelenterazine analog and mitochondria density that provided a robust MCU-dependent mt-AEQ response. mt-AEQ was functionally reconstituted with native coelenterazine directly added to the purified mitochondrial pellet, which was then frozen for assaying at a later stage. For screening, reconstituted yeast mitochondria were first energized in MAS buffer supplemented with D-lactate and then transferred into a 96-well compound plate. To systematically quantify the effect of each drug on mt-Ca2+ uptake kinetics, the maximum amplitude of the luminescence signal (peak) and the rising phase of the bell-shaped kinetic trace (uptake rate) were extracted after automated fitting of raw light signals. Each drug was scored based on its inhibitory effect (Idrug) on either peak amplitude or uptake rate when compared to positive (Ru360) and negative (DMSO) controls. Compounds that exerted >50% inhibition (Idrug > 0.5) on mt-Ca2+ uptake kinetics were selected as hits.
As a proof of concept, we screened the NIH Clinical Collection (NCC) library in biological duplicates, which includes ~700 compounds that are not represented in other small molecule
A
uthor Man
uscr
ipt
A
uthor Man
uscr
ipt
A
uthor Man
uscr
ipt
A
uthor Man
uscr
collections and have a history of use in human clinical trials (Figure 2B). As shown in Figures 2C and 2D, the assay was highly reproducible based on a positive correlation between biological duplicates (Rpeak(R1 versus R2)2 = 0.81), as well as between both kinetic parameters (R(rate versus peak)2 = 0.99). For statistical validation of the HTS assay, we calculated the Z′-factor, defined as the degree of separation between positive and negative controls (Zhang et al., 1999). The screen resulted in a Z′-factor of 0.69 and 0.65 for peak and uptake rate, respectively, indicating that the assay is robust and suitable for HTS applications (Figure 2E). For most drugs, Idrug scores were close to zero, indicating a lack of effect on MCU-mediated Ca2+ uptake (Figure 2F). Only two compounds scored as hits, amiodarone and mitoxantrone, which showed a strong and reproducible inhibition of mt-Ca2+ uptake kinetics. These lead compounds might represent specific inhibitors of the human MCU channel.
Orthogonal Yeast-Human Chemical Screening Validates Mitoxantrone as a Specific Inhibitor of MCU-Mediated Ca2+ Uptake
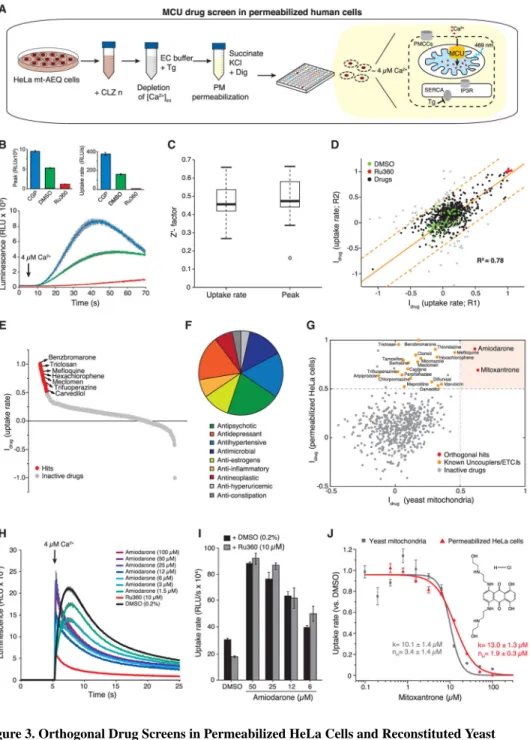
To validate the yeast assay system for identification of specific human MCU inhibitors, we compared positive hit rates in yeast and mammalian mitochondria-based drug screens (Figure 3). To this end, we re-screened the NCC library in human epitheloid cervix carcinoma (HeLa) cells (Figure 3A). The mt-Ca2+ uptake was measured in permeabilized HeLa cells that stably expressed mt-AEQ (Figures S1A–S1C) (Alonso et al., 2017). First, the endoplasmic reticulum (ER) was depleted of Ca2+ by pre-treatment with the sarco/ER Ca2+-ATPase (SERCA) inhibitor thapsigargin, and the plasma membrane was selectively permeabilized with digitonin, enabling the direct delivery of an exogenous Ca2+ bolus to mitochondria. The mitochondria of permeabilized cells were energized in a KCl-based medium with succinate and pyruvate as respiratory substrates, resulting in the full activation of the TCA cycle and the ETC. The addition of Ca2+ caused a rapid enhancement of mt-AEQ luminescence that was completely abrogated by the inhibition of MCU with Ru360 (Figure 3B), as well as by uncoupling of mt-Δψ with CCCP (Figures S1D and S1E). Conversely, CGP37157, an inhibitor of mt-Ca2+ efflux by the Na+/Ca2+ exchanger (Palty et al., 2010), enhanced the luminescence signal (Figure 3B). These results confirm that mt-AEQ luminescence faithfully reflects changes in the level of mt-Ca2+ in permeabilized HeLa cells.
Drug screening in permeabilized HeLa cells was less robust than in yeast mitochondria, with a Z′-factor of 0.47 and 0.46 for peak and uptake rate, respectively, suggesting that
mammalian cell-based assays for MCU drug screening are less amenable for HTS. However, the screen was reproducible (Ruptake rate(R1 versus R2)2 = 0.78) (Figures 3C and 3D). In total, we identified 29 hits with an Idrug score > 0.5, indicating that these compounds likely inhibited mt-Ca2+ uptake (Figure 3E). Hits belonged to three main pharmacological classes (Figure 3F), anti-psychotics, antidepressants, and antihypertensives, all of which are consistently represented in small molecule libraries (Attene-Ramos et al., 2015; Gohil et al., 2010; Stavrovskaya et al., 2004). The majority of hits have been shown to uncouple mt-Δψ (e.g., carvedilol, triclosan, sertraline, and hexachlorophene) (Cammer and Moore, 1972; Oliveira et al., 2000; Weatherly et al., 2016), to induce mitochondrial swelling (e.g., meclomen and benzbromarone) (Tatematsu et al., 2016), and to impair ETC and OXPHOS
A
uthor Man
uscr
ipt
A
uthor Man
uscr
ipt
A
uthor Man
uscr
ipt
A
uthor Man
uscr
(e.g., miconazol, tamoxifen, trifluoperazine, and mefloquine) (Cheah and Waring, 1983; Dickinson, 1977; Gohil et al., 2010; Tuquet et al., 2000). The remaining compounds included a monoamine transporter inhibitor (indatraline), two plasma membrane voltage-gated Ca2+ channel blockers (amlodipine and nicardipine), and one 5-HT receptor agonist (tegaserod). Strikingly, when comparing the Idrug scores of each compound in the two orthogonal chemical screens (Figure 3G), we observed that all hits in the HeLa cell-based screen, except amiodarone and mitoxantrone (Figure S2), were ineffective in the yeast mitochondria-based assay. These results suggest that, whereas almost all hits from the permeabilized cell-based screen are false positives, the inhibitory activity of amiodarone and mitoxantrone on mt-Ca2+ uptake is not a mere consequence of a bioenergetic crisis.
Amiodarone is frequently used as a first-line therapy for arrhythmias, although its molecular mechanism remains poorly understood (Schleifer et al., 2015). Unexpectedly, amiodarone-mediated inhibition of Ca2+ uptake in yeast mitochondria was not concentration dependent (Figure 3H). Up to 3 μM, amiodarone inhibited both peak and uptake rate, whereas at higher concentrations it induced a dramatic increase in mt-Ca2+ uptake rate, which could not be prevented by pre-treatment of mitochondria with Ru360 (Figure 3I). These results suggest that amiodarone has Ca2+ ionophoretic properties, which is consistent with previous observations of opposite concentration-dependent effects of amiodarone on several mitochondrial functions (Varbiro et al., 2003). Accordingly, we excluded amiodarone from follow-up studies. In contrast, mitoxantrone exerted a concentration-dependent inhibition of mt-Ca2+ uptake in both permeabilized HeLa cells and yeast mitochondria, with half-maximal inhibition at ~10 μM (Figure 3J). Mitoxantrone has been used as an antineoplastic agent against non-Hodgkin’s lymphomas and acute myeloid leukemia (Evison et al., 2016; Zee-Cheng and Cheng, 1978). It contains aromatic amines, conferring to it intrinsic optical properties (Bell, 1988; Le et al., 2006) (Figures S3A–S3C). To exclude possible interference with the mt-AEQ-based assay, we examined the effects of different concentrations of mitoxantrone on the total light signal from lysed yeast mitochondria in the presence of high [Ca2+] (Figure S3D). The effects of drug and DMSO treatments were indistinguishable, indicating that mitoxantrone-dependent inhibition of mt-Ca2+ uptake kinetics was not an optical artifact.
Altogether, these results indicate that the DLD-based bioenergetic shunt in yeast enables the selective filtering of non-specific MCU inhibitors in drug screening.
Mitoxantrone Inhibits MCU Ca2+ Currents without Affecting Oxidative Phosphorylation
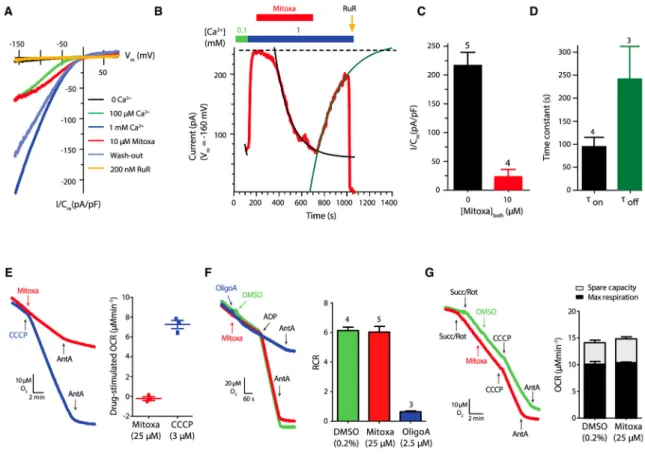
To confirm whether the inhibitory effects of mitoxantrone on mt-Ca2+ uptake were due to specific inhibition of the MCU channel, we directly recorded Ca2+ currents by patch-clamp electrophysiology of mitoplasts from wild-type HEK293 cells (Fieni et al., 2012; Vais et al., 2016). Typical RuR-sensitive, inwardly rectifying, Ca2+ concentration-dependent currents were observed in control mitoplasts (Figure 4A). Notably, 10 μM mitoxantrone reversibly and strongly reduced MCU Ca2+ currents by ~85% (Figures 4A–4D), with slow kinetics compared with block by RuR. In contrast, substrate-dependent oxygen consumption and response to CCCP in isolated mouse liver mitochondria were not affected by mitoxantrone (Figure 4E). Likewise, mitoxantrone was without effect on the respiratory control ratio,
A
uthor Man
uscr
ipt
A
uthor Man
uscr
ipt
A
uthor Man
uscr
ipt
A
uthor Man
uscr
which reflects the coupling between respiration and OXPHOS, in contrast to the effects of oligomycin A, a specific blocker of the mitochondrial ATP synthase (Figure 4F).
Furthermore, treatment of permeabilized HeLa cells with mitoxantrone was without effect on maximal respiration rate and spare respiratory capacity (Figure 4G). These results suggest that mitoxantrone inhibits MCU-mediated Ca2+ uptake by specifically targeting MCU activity.
Mitoxantrone Selectively Antagonizes the MCU Channel in Intact Cells
To determine the effect of mitoxantrone on MCU-mediated Ca2+ uptake in intact cells, we monitored mt-Ca2+ kinetics during agonist-evoked intracellular Ca2+ signaling in HeLa cells stimulated with histamine. As shown in Figures 5A–5C, half-maximal inhibition of both mt-Ca2+ peak and uptake rate was reached with ~10 μM mitoxantrone and manifested after ~2 hr of drug exposure, consistent with the permeability and known intracellular
pharmacokinetics of mitoxantrone (Sundman-Engberg et al., 1993). Although mitoxantrone has antineoplastic activity, effects on cell viability could not account for its inhibition of mt-Ca2+ uptake (Figure S4).
Next, we examined the effect of mitoxantrone on other components of the Ca2+-signaling system upstream of mitochondria, including plasma membrane and intracellular ion channels. Mitoxantrone reduced mt-Ca2+ (Figure 5D) without altering either resting [Ca2+] in the ER or amplitude of histamine-induced Ca2+ release in intact cells (Figure 5E) and IP3R-mediated release of Ca2+ from the ER of permeabilized cells (Figure 5F). In addition, mitoxantrone was without effects on voltage-activated Ca2+ currents recorded in non-differentiated SH-SY5Y neuroblastoma cells (Figure 5G), store-operated Ca2+ channels (Figures 5H and 5I), or Ca2+-activated Cl− currents (Figures 5J and 5K) in Xenopus oocytes. Likewise, mitoxantrone did not affect Na+ and K+ currents through voltage-gated channels in mouse type II taste cells (Figures 5L–5N). Collectively, the results in per-meabilized and intact cells, isolated mitochondria, and mitoplasts demonstrate that mitoxantrone selectively inhibits the MCU channel.
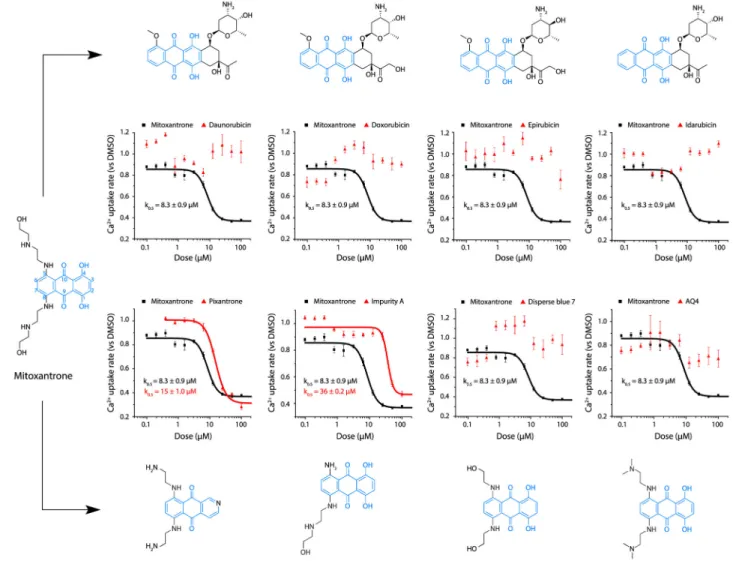
The Charged Side Arms of Mitoxantrone Are Necessary for MCU Inhibition
Having established a functional link between mitoxantrone and MCU, we next sought to elucidate its pharmacophore. To establish a preliminary structure-activity relationship, we selected four anthracyclines, all chemotherapeutic drugs (daunorubicin, doxorubicin, epirubicin, and idarubicin), that share with mitoxantrone the 1,4-dihydroxyanthraquinone ring (quinizarin) (Evison et al., 2016) (Figure 6). These compounds were initially tested in duplicates at 10 μM in both yeast mitochondria and permeabilized HeLa cell-based primary screens. However, none of them had significant inhibitory effects on mt-Ca2+ uptake, even at high concentrations (50–100 μM) (Figure 6, top). These results indicate that the quinizarin ring is not sufficient to confer MCU inhibition by mitoxantrone and that positively charged side chains (the arms) at positions 5 and 8 may play a role. We identified four commercially available analogs (pixantrone, impurity A, disperse blue 7, and AQ4) that differ from mitoxantrone by the symmetry, length, and terminal group of their arms, and we tested them in dose-response assays (Figure 6, bottom). Compared with mitoxantrone (k0.5 = 8.3 ± 0.9 μM), only pixantrone (k0.5 = 15 ± 1.0 μM) (Figure S5) and impurity A (k0.5 = 36 ± 0.2 μM)
A
uthor Man
uscr
ipt
A
uthor Man
uscr
ipt
A
uthor Man
uscr
ipt
A
uthor Man
uscr
retained inhibitory activity on Ca2+ uptake in yeast mitochondria. Strikingly, despite sharing the same scaffold with three planar rings and a very similar substitution pattern, disperse blue 7 and AQ4 failed to inhibit MCU activity (Figure S5). These findings suggest that the side arms of mitoxantrone, hosting both a protonated secondary amine and an extended hydroxyl-ethyl moiety, are necessary to confer its inhibitory activity on MCU. The shorter hydroxyl-ethyl arms of disperse blue 7 and the bulkier tertiary amino groups of AQ4 may weaken the affinity for MCU. Moreover, the ~4-fold decrease in the inhibitory effect of impurity A, which lacks one of the two arms, suggests that both side chains of mitoxantrone contribute to MCU inhibition.
The antitumor activities of both anthracyclines and anthracenedione-derived drugs, such as mitoxantrone and pixantrone, have been ascribed to the intercalation of the extended planar ring system into the DNA and its inhibition of topoisomerase II (Evison et al., 2016). Based on our finding that the quinizarin moiety is dispensable for MCU inhibition, we reasoned that the anti-neoplastic and anti-MCU properties of mitoxantrone should be independent. We examined the effects of the two most active inhibitors of MCU, mitoxantrone and
pixantrone, as well as the inactive analog AQ4 on the viability of three cancer cell lines expressing different levels of MCU protein (Figure S6). All three anti-cancer agents were cytotoxic after 48 hr of treatment, without any change in their antiproliferative activity on control (pLKO) and MCU knockdown or overexpressing tumor cells.
Altogether, these results indicate that the MCU channel represents a previously unknown intracellular target of mitoxantrone and that the pharmacophore lies within the charged side arms.
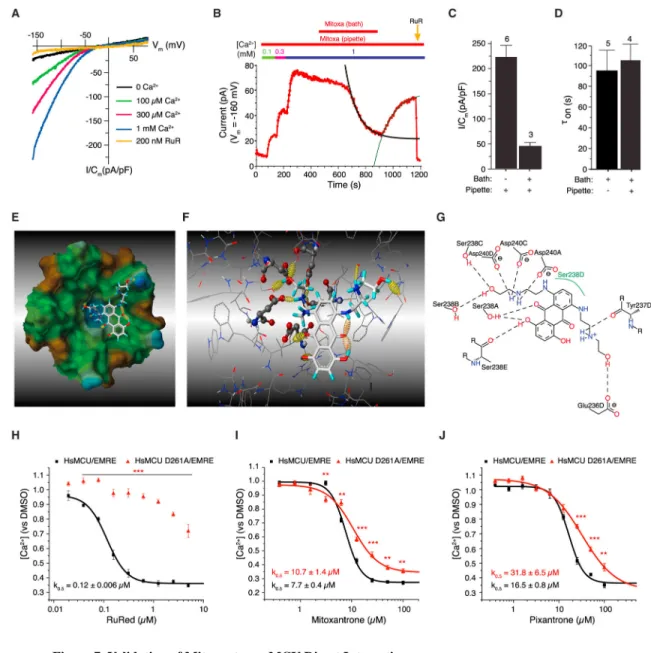
Acidic Residues in the Selectivity Filter Mediate Mitoxantrone-Dependent Inhibition of MCU
To further characterize the mechanism of mitoxantrone-dependent MCU inhibition, we first examined its effect on MCU current densities recorded in the whole-mitoplast configuration, with either 10 μM in the pipette (matrix side) or in the bath (cytosolic side) solution. Strikingly, when mitoxantrone was present in the matrix, it was without effect on RuR-sensitive Ca2+ currents (Figures 7A–7D). Furthermore, matrix mitoxantrone did not prevent its inhibitory effect when added to the bath solution, on either the extent (Figure 7C) or kinetics (Figure 7D) of Ca2+ current inhibition. Thus, mitoxantrone likely interacts with its target on the cytosolic side of the IMM.
Because mitoxantrone inhibits mt-Ca2+ uptake in yeast mitochondria, which express only MCU and EMRE, its most likely target is the minimal channel complex. MCU contains two trans-membrane helices, with amino and carboxyl termini facing into the matrix, with a short hydrophilic stretch of amino acids (YSWDI) linking them at the mouth of the channel facing the mitochondrial intermembrane space (Baughman et al., 2011; De Stefani et al., 2011). This region of the channel has highly conserved acidic residues, including an aspartate in position 261 that is involved in Ca2+ permeation and selectivity (Cao et al., 2017; Chaudhuri and Clapham, 2014; Oxenoid et al., 2016). To predict a drug-target interaction and to identify key residues, we performed molecular docking using the YSWDI motif in the pentameric C. elegans MCU pore structure (Oxenoid et al., 2016) (Figure 7E). Mitoxantrone was flexibly docked into this region and a key interaction was found between
A
uthor Man
uscr
ipt
A
uthor Man
uscr
ipt
A
uthor Man
uscr
ipt
A
uthor Man
uscr
one of the positively charged secondary amines in its 2-hydroxyethylamino side chains and three of the five aspartates in the selectivity filter (Figures 7F and 7G). The electrostatic interaction enforced by these hydrogen bonds was further enhanced by two hydrogen bonds with the hydroxyl groups of two serine residues in the YSWDI motif, which have been previously shown to mediate the interaction of Ru360 and RuR with MCU (Baughman et al., 2011; Chaudhuri and Clapham, 2014).
To validate the hypothesis of a specific mitoxantrone-MCU interaction, we examined the effects of replacing the Asp261 with an alanine (D261A) on the inhibitory efficacy of mitoxantrone. We created a yeast strain expressing the human MCU D261A mutant together with human EMRE and mt-AEQ (Figure S7A). Compared with the wild-type channel, yeast mitochondria expressing the D261A mutant exhibited a ~4-fold decrease in mt-Ca2+ uptake (Figure S7B). Notably, this single point mutation was sufficient to confer nearly complete resistance to inhibition by RuR (Figure 7H), highlighting a previously unknown role of this highly conserved residue in mediating ruthenium-dependent MCU inhibition. As predicted by the molecular docking, mt-Ca2+ uptake in the D261A mutant strain was less sensitive to inhibition by both mitoxantrone (k0.5 (D261A) = 10.7 ± 1.4 μM versus k0.5 (WT) = 7.7 ± 0.4 μM; p < 0.001) and pixantrone (k0.5 (D261A) = 31.8 ± 6.5 μM versus k0.5 (WT) = 16.5 ± 0.8 μM; p < 0.001) (Figures 7I and 7J). These results provide compelling biochemical and functional evidence that mitoxantrone is a direct inhibitor of MCU.
DISCUSSION
Since the breakthrough discovery of the molecular identity of MCU (Baughman et al., 2011; De Stefani et al., 2011; Perocchi et al., 2010), numerous studies have suggested that this channel is a potential target of broad pharmacological interest (De Stefani et al., 2016). Nevertheless, the lack of specific reagents that directly regulate MCU function has greatly impeded progress in this area. Specific chemical modulators of MCU activity would be invaluable for assessing the roles of the uniporter in mitochondrial biology and cell
physiological processes, and they could also provide lead compounds for the development of therapeutic candidate drugs for many human diseases.
The tight interconnection among intracellular Ca2 signaling, energy production, mitochondrial membrane potential, and MCU-mediated Ca2+ uptake poses a major challenge in the design of robust and effective HTS assays for the discovery of specific modulators of this channel. Compounds that directly or indirectly affect the ETC, uncouple OXPHOS, dissipate mt-Δψ, and/or disrupt membrane integrity can significantly increase the false discovery rate in primary screens. In vitro reconstitution systems (De Stefani et al., 2011) may not offer an optimal tool for MCU drug discovery, given that the expression of MCU was shown to be not sufficient to reconstitute a functional channel (Kovács-Bogdán et al., 2014). Similarly, in silico predictions of drug-MCU interactions are limited by the lack of high-resolution structural information (Lee et al., 2015, 2016; Oxenoid et al., 2016).
Here we have developed a yeast-based drug-screening assay that robustly identifies direct modulators of human MCU to facilitate systematic assessment of clinically approved compounds for targeting uniporter activity in vivo. We exploit unique evolutionary and
A
uthor Man
uscr
ipt
A
uthor Man
uscr
ipt
A
uthor Man
uscr
ipt
A
uthor Man
uscr
biophysical properties of yeast mitochondria for MCU-targeted drug discovery. First, mitochondria from S. cerevisiae lack a uniporter mechanism and are unable to take up Ca2+ (Carafoli and Lehninger, 1971), providing an in vitro system devoid of intrinsic mt-Ca2+ permeability and insensitive to interference from upstream, intracellular Ca2+-signaling events. Second, S. cerevisiae expresses a mitochondrial shunt pathway that bypasses the majority of ETC complexes and NADH-generating pathways but is sufficient for maintaining mt-Δψ. Furthermore, when yeast mitochondria are energized in isosmotic respiratory media, mt-Δψ is resistant to the concentrations of the protonophore CCCP that are sufficient to dissipate the proton gradient in mammalian cells. Importantly, human MCU-mediated Ca2+ uptake can be reconstituted in yeast mitochondria by exogenous expression of human MCU and EMRE (Kovács-Bogdán et al., 2014). Together, these properties confer to yeast mitochondria-based Ca2+ uptake assays a remarkable advantage over mammalian ones, in which direct and indirect effects of drugs on MCU-dependent Ca2+ uptake cannot be readily deconvolved. In addition, purified yeast mitochondria can be frozen and stored without losing the ability to respond to an added bolus of Ca2+ with enhanced aequorin luminescence, providing an assay platform that can be used at any stage of drug discovery. Finally, only small quantities of yeast mitochondria (1 μg/compound) are required to screen even large chemical libraries, providing a drug-screening assay that is cost- and time-effective and easily scalable.
As a proof of concept, we used thawed yeast mitochondria energized with D-lactate in a mannitol/sucrose-based medium to screen the NCC library, which covers a broad range of pharmacological classes. We identify mitoxantrone, one of the oldest chemotherapeutic drugs still on the market (Zee-Cheng and Cheng, 1978), as an inhibitor of MCU. Mitoxantrone has not been previously linked to the regulation of mt-Ca2+ homeostasis, proving the potential and efficacy of our yeast-based assay in the discovery of MCU modulators. In subsequent assays, including permeabilized and intact human cells, isolated mitochondria, and mitoplast electrophysiology, we confirmed that mitoxantrone inhibited mt-Ca2+ uptake in a dose-dependent manner that was not secondary to the impairment of mitochondrial bioenergetics or to effects on other ion channels. Mitoxantrone reversibly inhibited MCU Ca2+ currents from the inner membrane space side in mammalian cell mitochondria, suggesting that its target was likely the MCU/EMRE complex itself. Its specificity was further confirmed by the demonstration that inhibition of MCU activity was sensitive to modifications of mitoxantrone structure, specifically its positively charged side chains, and to mutations in highly conserved aspartate residues in the selectivity filter of the MCU channel. Neutralization of these negatively charged residues conferred almost complete protection against RuR inhibition, suggesting a rather unspecific binding to the uniporter, which is based on an ionic interaction between the Asp261 residues and the protonated amines of RuR. Instead, molecular docking analysis predicted for mitoxantrone a more complex binding architecture involving both the arms and the ring system, whereby a single D261A point mutation significantly compromised the inhibitory effect of
mitoxantrone on uniporter-mediated Ca2+ uptake but was not sufficient to completely abrogate its binding to MCU. Finally, our results suggest that the neoplastic and anti-MCU activities derive from different structural moieties within mitoxantrone, providing a
A
uthor Man
uscr
ipt
A
uthor Man
uscr
ipt
A
uthor Man
uscr
ipt
A
uthor Man
uscr
foundation for medicinal chemistry efforts to develop effective lead compounds for the specific modulation of MCU.
More generally, our yeast mitochondria-based drug-screening approach should have broad utility. Of note, the orthogonal screen in permeabilized human cells suggests that, at the concentrations employed here, many clinically approved drugs impinge upon mitochondrial metabolism. This result further validates the yeast system as a more robust screening assay. Furthermore, this system is versatile, and additional MCU components and regulatory mechanisms can be reconstituted, providing a broad drug discovery strategy for the selection of lead compounds against the uniporter complex.
STAR
★
METHODS
KEY RESOURCES TABLEREAGENT or RESOURCE SOURCE IDENTIFIER
Antibodies
Rabbit polyclonal anti-MCU Sigma-Aldrich Cat. No. HPA016480; Lot No.C0114358; RRID: AB_2071893
Rabbit polyclonal anti-EMRE - C22orf32 (clone C-12)
Santa Cruz Biotechnology Cat. No. sc-86337; Lot No.K0215; RRID: AB_2250685
Mouse monoclonal anti-Aequorin (clone 6E3.2)
Merck/Millipore Cat. No. MAB4405; RRID: AB_94900
Mouse monoclonal anti-β-Actin (clone AC-74)
Sigma-Aldrich Cat. No. A2228; Lot No.085M4754V; RRID: AB_476697
Mouse monoclonal anti-Phosphoglycerate Kinase (PKGA) (clone 22C5D8)
Thermo Fisher Scientific Cat. No. 459250; RRID: AB_2532235
Anti-MCU (residues 285-351) produced in rabbit
This paper N/A
Anti-Sc-Yme1 produced in rabbit Schreiner et al., 2012 N/A
Biological Samples
Human Dermal Fibroblasts, neonatal (NHDFn)
Laboratory of Holger Prokisch
N/A
Chemicals, Peptides, and Recombinant Proteins
Coelenterazine, derivative n Biotium Cat. No. 10115-1; CAS: 123437-22-9
Coelenterazine, native Abcam Cat. No. ab145165; CAS: 55779-48-1
Ru360 Calbiochem Cat. No. 557440
Ruthenium red Abcam Cat. No. ab120264; CAS: 11103-72-3
Calcium Ionophore II (ETH-129) Sigma-Aldrich Cat. No. 21193; CAS: 74267-27-9
Sodium-D-lactate Sigma-Aldrich Cat. No. 71716; CAS: 920-49-0
Sodium succinate dibasic hexahydrate Sigma-Aldrich Cat. No. S2378; CAS: 6106-21-4
Dimethyl malonate Sigma-Aldrich Cat. No. 136441; CAS: 108-59-8
Antimycin A from Streptomyces sp. Sigma-Aldrich Cat. No. A8674; CAS: 1397-94-0
Carbonyl cyanide m-chlorophenyl hydrazone (CCCP)
Sigma-Aldrich Cat. No. C2759; CAS: 555-60-2
Potassium cyanide Sigma-Aldrich Cat. No. 60178; CAS: 151-50-8
Thapsigargin Sigma-Aldrich Cat. No. 586005; CAS: 67526-95-8
REAGENT or RESOURCE SOURCE IDENTIFIER
Digitonin Sigma-Aldrich Cat. No. D141; CAS:11024-24-1
CGP-37157 Sigma-Aldrich Cat. No. C8874; CAS: 75450-34-9
Mitoxantrone Sigma-Aldrich Cat. No. M6545; CAS:70476-82-3
Amiodarone Sigma-Aldrich Cat. No. A8423; CAS: 19774-82-4
AQ4 Sigma-Aldrich Cat. No. A9236; CAS: 70476-63-0
Zymolyase 20T from Arthrobacter luteus Amsbio Cat. No. 120491-1
Adenosine 5′-diphosphate sodium salt Sigma-Aldrich Cat. No. A2754; CAS: 20398-34-9
Oligomycin A Sigma-Aldrich Cat. No. 75351; CAS: 579-13-5
Rotenone Sigma-Aldrich Cat. No. R8875; CAS: 83-79-4
Histamine dihydrochloride Sigma-Aldrich Cat. No. H7250; CAS: 56-92-8
D-myo-Inositol 1,4,5-tris-phosphate trisodium salt
Sigma-Aldrich Cat. No. I9766
2,5-ditert-butyl-benzohydroquinone (TBH) Sigma-Aldrich Cat. No. 419648 CAS: 2460-77-7
Pixantrone dimaleate (Pixuvri) CTI Life Sciences N/A
Impurity A Sigma-Aldrich Cat. No. M2305005; CAS: 89991-52-6
Disperse blue 7 Boc Sciences Cat. No. 3179-90-6; CAS: 3179-90-6
Daunorubicin hydrochloride Sigma-Aldrich Cat. No. 30450; CAS: 23541-50-6
Doxorubicin hydrochloride Sigma-Aldrich Cat. No. D1515; CAS: 25316-40-9
Epirubicin hydrochloride Sigma-Aldrich Cat. No. E9406; CAS: 56390-09-1
Idarubicin hydrochloride Sigma-Aldrich Cat. No. I1656; CAS: 57852-57-0
Lipofectamine 2000 Transfection Reagent Thermo Fisher Scientific Cat. No. 11668019
Critical Commercial Assays
Cell Titer-Glo Luminescent Cell Viability Assay
Promega Cat. No. G7571
Pierce BCA Protein Assay Kit Thermo Fisher Scientific Cat. No. 23227
Deposited Data
Unprocessed Image Data This paper http://dx.doi.org/10.17632/54jw24wvn5.1
Experimental Models: Cell Lines
HeLa cells ATCC CCL-2
HEK293T cells ATCC CRL-11268
SH-SY5Y cells Sigma-Aldrich Cat. No. 94030304
HeLa cells stably expressing mt-AEQ This paper N/A
HeLa cells stably expressing ER-AEQ Rodríguez-Prados et al., 2015
N/A
NHDF cells stably expressing mt-AEQ This paper N/A
SH-SY5Y cells stably expressing mt-AEQ This paper N/A
MCF-7 cells stably overexpressing full-length MCU
This paper N/A
MCF-7 cells stably expressing sh-MCU This paper N/A
PLB-985 cells stably overexpressing full-length MCU
This paper N/A
PLB-985 cells stably expressing sh-MCU This paper N/A
A
uthor Man
uscr
ipt
A
uthor Man
uscr
ipt
A
uthor Man
uscr
ipt
A
uthor Man
uscr
REAGENT or RESOURCE SOURCE IDENTIFIER
Toledo cells stably overexpressing full-length MCU
This paper N/A
Toledo cells stably expressing sh-MCU This paper N/A
Experimental Models: Organisms/Strains
S. cerevisiae: Strain background: YPH499 expressing HsMCUWT/EMRE or
HsMCUD261A/EMRE and mt-AEQ
This paper N/A
Mouse: Crl:NMRI(Han) Charles River N/A
Mouse: TRPM5-GFP Calhm1-KO: B6.129S - TRPM5- GFP/Calhm1−/−
Ma et al., 2017 N/A
Xenopus laevis Xenopus One N/A
Oligonucleotides
shRNA targeting sequence: MCU 5′ -GCAAGGAGTTTCTTTCTCTTT-3′
RNAi consortium, Broad Institute
TRCN0000133861
Recombinant DNA
MCU full length (pLX304) This paper N/A
p316GPD (plasmid) This paper N/A
p423GPD (plasmid) Mumberg et al., 1995 N/A
p425GPD (plasmid) Mumberg et al., 1995 N/A
Software and Algorithms
pClamp 10 Molecular Devices N/A
GraphPad Prism 5.0 GraphPad Software N/A
Igor Pro Wavemetrics N/A
MATLAB R2014b MathWorks N/A
CONTACT FOR REAGENT AND RESOURCE SHARING
Further information and requests for resources and reagents should be directed to and will be fulfilled by the Lead Contact, Fabiana Perocchi ([email protected]).
EXPERIMENTAL MODEL AND DETAILS
Cell lines—HeLa cells stably expressing a mitochondrial matrix-targeted GFP-aequorin (mt-AEQ) were generated as in Manjarrés et al. (2008). The mitochondrial-targeting sequence consisted of the first 31 residues of the subunit VIII of the human cytochome c oxidase fused in frame to GFP-aequorin. HeLa cells stably expressing an endoplasmic reticulum-(ER) targeted GFP-aequorin (ER-AEQ) were previously generated (Rodríguez-Prados et al., 2015). The low Ca2+-affinity GFP-aequorin carrying the D119A substitution in the aequorin gene and fused at its N terminus to the Igγ2b heavy chain gene was previously described (Chamero et al., 2008). HeLa cells were grown in Dulbecco’s modified Eagle’s medium (DMEM) with high-glucose (Sigma-Aldrich; D6429), 10% FBS (Sigma-Aldrich; F7524) and 100 μg/ml geneticin (Thermo Fisher Scientific; 10131027). HEK293T cells were grown in DMEM with high-glucose, 10% FBS, 100 U/ml penicillin, and 100 μg/ml
streptomycin. SH-SY5Y cells were grown in a 1:1 mixture of F-12 and MEM media supplemented with 10% FBS, 0.1 mM essential aminoacids, 1 mM Na+-pyruvate, 100 U/ml
A
uthor Man
uscr
ipt
A
uthor Man
uscr
ipt
A
uthor Man
uscr
ipt
A
uthor Man
uscr
penicillin and 100 μg/ml streptomycin. Human breast adenocarcinoma (MCF-7) cells were grown in DMEM with high-glucose supplemented with 10% FBS. Human peripheral blood acute myeloid leukemia (PLB-985) and non-Hodgkin’s B cell lymphoma (Toledo) cells were grown in 90% RPMI 1640 (Thermo Fisher Scientific, 11879020) medium
supplemented with 10% h.i. dialyzed FBS (Thermo Fisher Scientific, 26400044). Normal human dermal neonatal fibroblasts (NHDF) were grown in DMEM with high-glucose, supplemented with 10% FBS and 2 mM GlutaMAX (Thermo Fisher Scientific, 35050061). All cell lines were incubated at 37°C and 5% CO2.
MCF-7, PLB-985 and Toledo cell lines were infected with lentivirus generated from an empty vector (pLKO), a pLKO vector expressing a shRNA targeting MCU
(TRCN0000133861, 5′ GCAAGGAGTTTCTTTCTCTTT-3′) or a pLEX304 vector expressing a tagged wild-type human MCU and 48 hr post-transduction cells were selected with puromycin (2 μg/ml) or blasticidin (5 μg/ml), respectively, for 5–7 days and expanded.
Animals, housing and genotyping—Mice were housed in a pathogen-free,
temperature- and humidity-controlled vivarium on a 12:12-h light-dark cycle. Diet consisted of standard laboratory chow and double-distilled water. All animal procedures in NMRI mice were in accordance with the European Community Council Directive for the Care and Use of Laboratory Animals (86/609/ECC) and German Law for Protection of Animals and were approved by the local authorities. All experiments were performed with female NMRI mice that were at least 3 mo old.
All methods regarding the handling of TRPM5-GFP Calhm1-KO mice were approved by the University of Pennsylvania’s Animal Care and Use Committee and in accordance with the National Institutes of Health “Guidelines for the Care and Use of Experimental Animals.” Only transgenic mice expressing GFP were used in experiments. All experiments were performed with Calhm1-KO knockout littermates of both sexes that were at least 3 mo old. Mouse genotypes were determined by real-time PCR (Transnetyx, Cordova, TN).
Yeast Strains—The yeast mt-AEQ construct was made by cloning the aequorin-coding sequence into the p316GPD expression plasmid. To ensure mitochondrial localization, the aequorin-coding sequence was preceded by the sequence coding for the first 69 residues, encompassing the matrix targeting sequence, of subunit 9 of Neurospora crassa FoF1 -ATPase. DNA sequences coding for intron-less versions of human wild-type MCU or D261A mutant and EMRE were cloned into yeast expression plasmids p423GPD and p425GPD, respectively (Mumberg et al., 1995). The three plasmids were simultaneously transformed into the wild-type yeast strain YPH499 (Sikorski and Hieter, 1989). Transformants were selected on selective glucose medium lacking uracil, histidine and leucine. To test expression and subcellular localization of heterologous proteins, yeast were grown in selective lactate medium containing 8.5 g/L yeast nitrogen base, 25 g/L ammonium sulfate, 2% (v/v) lactic acid (90%) and 0.1% glucose, supplemented with adenine, lysine and tryptophan as selection markers. At an OD ~0.8 cells were harvested at 1000 g for 5 min at room temperature. The cell pellet was re-suspended in SHK buffer (0.6 M sorbitol, 20 mM HEPES/KOH pH 7.2, 80 mM KCl, and 1mM PMSF) and vortexed with glass beads 5 times for 30 s with cooling down in between. This mix was centrifuged at 1000 g for 5 min at 4°C
A
uthor Man
uscr
ipt
A
uthor Man
uscr
ipt
A
uthor Man
uscr
ipt
A
uthor Man
uscr
and the collected supernatant was further centrifuged at 20,000 g for 10 min at 4°C. The resulting supernatant (cytosolic fraction) was precipitated with trichloroacetic acid and suspended in Laemmli buffer. The pellet (mitochondrial fraction) was also directly re-suspended in Laemmli buffer. Mitochondrial and cytosolic fractions were separated under reducing conditions on 14% SDS-PAGE gels. Immunoblotting was performed according to standard procedures using affinity-purified home-made antibodies raised in rabbits against the C-terminal segment of human MCU (residues 285-351) fused to maltose binding protein, and commercially available antibodies: MCU (Sigma-Aldrich, HPA016480), EMRE (Santa Cruz Biotechnology, sc-86337) and Aequorin (clone 6E3.2, Merck/Millipore; MAB4405). Antibodies against YME1 and PKGa (Thermofisher/Novex, 459250) were used as markers for mitochondrial and cytosolic fractions, respectively.
METHOD DETAILS
Isolation of Yeast Mitochondria for Drug Screening—Yeast were grown at 30°C in selective lactate medium to an OD ~1, harvested by centrifugation at 5,000 g for 5 min at room temperature and washed twice with milliQ water. The yeast pellet was re-suspended in pre-warmed DTT buffer (10 mM DTT, 100 mM Tris) and incubated for 10 min at 30°C on an orbital shaker. The suspension was then centrifuged at 3,000 g for 5 min and the pellet was washed twice with 1.2 M sorbitol. The pellet was collected by centrifugation at 4,000 g, resuspended in zymolyase buffer (1.2 M sorbitol, 20 mM KH2PO4, 3 mg zymolyase/g yeast pellet) and shaken gently at 30°C for 45 min to obtain spheroplasts. Afterward, spheroplasts were harvested by centrifugation at 3,000 g for 5 min and re-suspended in ice-cold
homogenization buffer (10 mM Tris pH 7.4, 0.6 M sorbitol, 1 mM EDTA, 0.2% BSA, 1 mM PMSF). Homogenization was performed with 15 strokes in a glass homogenizer. The homogenate was then centrifuged twice at 4,000 g for 5 min and the supernatant was further centrifuged at 10,000 g for 10 min. The pellet was re-suspended in 30 mL of SEM-buffer (0.25 M sucrose, 1 mM EDTA, 10 mM MOPS-KOH, pH 7.2) and crude mitochondria were isolated by centrifugation at 12,000 g for 12 min. The final mitochondrial pellet was gently re-suspended in SEM-buffer and protein concentration was determined with the Pierce BCA Protein Assay Kit using BSA as a standard. The photoprotein aequorin was reconstituted with 3 μM native coelenterazine directly added to the mitochondrial pellet which was incubated on ice, in darkness for 2 hr. Aliquots of 10 μg/μL were flash-frozen in liquid nitrogen and stored at −80°C for further use.
Yeast Mitochondria-Based Drug Discovery Screen—Frozen aliquots of
reconstituted yeast mitochondria were thawed on ice and diluted into MAS buffer (70 mM sucrose, 220 mM mannitol, 10 mM KH2PO4, 5 mM MgCl2, 2 mM HEPES, 50 μM EGTA, 0.2% essentially fatty acid-free BSA, pH 7.2/KOH) supplemented with 10 mM D-lactate as respiratory substrate. Yeast mitochondria were seeded into white 96-well compound plates (PerkinElmer) at 1 μg/90 μL using a MultiDrop Combi (Thermo Fisher Scientific). The NIH Clinical Collection library, consisting of 686 compounds (10 μM, in 0.1% DMSO) was screened in biological duplicates. The first and last column of each plate contained 10 μL of 1% DMSO (negative control) and 100 μM Ru360 (positive control), respectively.
Mitochondria were incubated in the presence of compounds for 5 min at room temperature
A
uthor Man
uscr
ipt
A
uthor Man
uscr
ipt
A
uthor Man
uscr
ipt
A
uthor Man
uscr
and Ca2+-stimulated light signal was recorded at 469 nm every 0.1 s with a luminescence counter (MicroBeta2 LumiJET Microplate Counter, PerkinElmer).
Permeabilized HeLa Cell-Based Drug Discovery Screen—HeLa cells stably expressing mt-AEQ were harvested at a density of 500,000 cells/mL in growth medium supplemented with 20 mM HEPES (pH 7.4/NaOH), and the photoprotein aequorin was reconstituted by incubation with 3 μM coelenterazine derivative n for 3 hr at room
temperature. Cells were centrifuged at 300 g for 3 min and the pellet was re-suspended in an extracellular-like buffer containing 145 mM NaCl, 5 mM KCl, 1 mM MgCl2, 10 mM glucose, 10 mM HEPES and 500 μM EGTA (pH 7.4/NaOH), supplemented with 200 nM thapsigargin. After 20 min at room temperature, cells were collected by centrifugation at 300 g for 3 min and the pellet was resuspended in an intracellular-like buffer containing 140 mM KCl, 1 mM KH2PO4/K2HPO4, 1 mM MgCl2, 20 mM HEPES, 100 μM EGTA (pH 7.2/ KOH), supplemented with 1 mM Na+-pyruvate, 1 mM ATP/MgCl2 and 2 mM Na+ -succinate. Cells were permeabilized with 60 μM digitonin for 5 min, collected by centrifugation at 300 g for 3 min, resuspended in intracellular-like buffer at a density of ~800 cells/μL, and 90 μL were then dispensed in a white 96-well compound plate (PerkinElmer) using a MultiDrop Combi (Thermo Fisher Scientific). The first and last column of each plate contained 10 μL of 1% DMSO (negative control) and 100 μM Ru360 (positive control), respectively. Cells were incubated for 5 min at room temperature and Ca2+-stimulated light signal was recorded at 469 nm every 0.1 s with a luminescence counter (MicroBeta2 LumiJET Microplate Counter, PerkinElmer).
Mitoplast Patch-Clamp Recording—Mitoplast isolation and electrophysiology were performed as described (Fieni et al., 2012; Vais et al., 2016). Patch pipettes had resistances of 20 – 60 MΩ when filled with (in mM): 130 TMA-OH, 100 HEPES, 10 glutathione, 2 MgCl2, 1.5 EGTA, pH 7.0/D-gluconic acid, osmolarity 330–350 mOsm/kg. Mitoplasts were initially bathed in (in mM): 150 KCl, 10 HEPES, pH 7.2, osmolarity 300 mOsm/Kg (“KCl-DVF” solution). Voltage pulses of 350 – 500 mV amplitude and 15 – 50 ms duration, delivered by the PClamp-10 (Molecular Devices) program, were used to obtain the “whole-mitoplast” configuration. Access resistance (30 – 90 MΩ) and mitoplast capacitance Cm (0.2 – 1 pF) were determined using the membrane test protocol of the PClamp-10 software. After the whole-mitoplast configuration was obtained, the KCl-DVF bath solution was exchanged with HEPES-EGTA (150 mM HEPES, 1.5 mM EGTA, pH 7.0/Tris-base) for baseline (control) measurements, followed by HEPES (no EGTA) solutions with 0.1 and 1 mM CaCl2 (with or without 10 μM mitoxantrone), successively. Finally, a HEPES-based solution with 1 mM CaCl2 and 200 nM ruthenium red (RuR) was perfused to record the baseline (IRuR) after complete block of MCU Ca2+ currents. Osmolarities of all bath solutions were 297–305 mOsm/Kg, adjusted with sucrose. The voltage protocol, delivered by the
PClamp-10 software with a DigiData-1550 interface (Molecular Devices), consisted in stepping from Vm = 0 mV to −160 mV for 20 ms, followed by ramping to 80 mV for 860 ms, dwelling at 80 mV for 20 ms and return to 0 mV. Currents were recorded using an Axopatch 200-B amplifier (Molecular Devices). Data were acquired at room temperature with a sampling rate of 50 kHz and anti-aliasing filtered at 1 kHz. Data analysis was
A
uthor Man
uscr
ipt
A
uthor Man
uscr
ipt
A
uthor Man
uscr
ipt
A
uthor Man
uscr
performed with the PClamp-10 software. For quantitative comparisons, current densities were calculated with the formula:
ICa and IRuR being measured at Vm = −160 mV, with 1 mM Ca2+ in the bath.
Isolation of Mouse Liver Mitochondria—Mitochondria were isolated from freshly collected livers of female NMRI mice. After cardiac perfusion, livers were excised and minced with 20 mL isolation buffer containing (in mM): 220 mannitol, 80 sucrose, 10 HEPES, 1 EDTA, and 0.5% essentially fatty acid-free BSA supplemented with protease inhibitors (pH 7.4/KOH). The tissue was homogenized with two strokes at 300 rpm using a loose-fitting Teflon homogenizer followed by nitrogen cavitation at 800 psi for 10 min. The homogenate was centrifuged at 600 g for 10 min at 4°C and the supernatant was further centrifuged at 4,000 g for 10 min. The buffy-coat was removed and the pellet was re-suspended in 20 mL of ice-cold isolation buffer. The wash-and-centrifugation step was repeated twice, once in the presence of BSA and then in the absence of BSA. The final pellet was re-suspended in isolation buffer without BSA and stored on ice for further use.
Mitochondrial protein concentration was determined with the Pierce BCA Protein Assay Kit (Thermo Fisher Scientific) using BSA as standard.
Mitochondrial Bioenergetics Assays—Freshly isolated mouse liver mitochondria or HeLa cells were re-suspended in MAS buffer (in mM: 70 sucrose, 220 mannitol, 10 KH2PO4, 5 MgCl2, 2 HEPES, 0.05 EGTA, supplemented with 0.2% essentially fatty acid-free BSA, pH 7.2/KOH) to a final concentration of 0.6 mg mitochondria/mL and 2x10⁶ cells/mL, respectively. HeLa cells were permeabilized with 60 μM digitonin. Oxygen consumption rate (OCR) was measured using a Clark-type oxygen electrode (Oxytherm System, Hansatech Instruments). Substrate-dependent respiration (basal) was initiated by addition of 10 mM succinate and 2 μM rotenone; ADP-dependent respiration (ADP-coupled) was stimulated by the addition of 4 mM ADP; maximal respiration (un(ADP-coupled) was reached upon addition of 3 μM and 15 μM CCCP to isolated mitochondria and permeabilized HeLa cells, respectively. Respiratory control ratio (RCR), maximal respiration, drug-stimulated respiration and spare respiratory capacity were calculated as follows: ADP-coupled/basal OCR, uncoupled-antimycin OCR, drug-coupled/ basal OCR, uncoupled-basal OCR after accounting for non-mitochondrial respiration as previously described (Brand and Nicholls, 2011; Divakaruni et al., 2014).
Mitochondrial and ER Ca2+ Uptake Measurements—HeLa and SH-SY5Y cells stably expressing mt-AEQ were seeded in white 96-well plates at 25,000 cells/well. NHDFn cells stably expressing mt-AEQ were seeded in white 96-well plates at 12,000 cells/well. After 24 hr, aequorin was reconstituted with 2 μM native coelenterazine for 1 hr at 37°C. Cells were treated with different concentrations of mitoxantrone or DMSO (0.2%) added to the growth media and incubated for 1 or 2 hr. Under the same conditions, cell viability was measured with the Cell Titer-Glo Luminescent Viability assay kit (Promega, G7571).
Mt-A
uthor Man
uscr
ipt
A
uthor Man
uscr
ipt
A
uthor Man
uscr
ipt
A
uthor Man
uscr
AEQ-based measurements of Ca2+-dependent light kinetics were performed upon 100 μM histamine (HeLa and NHDFn cells) or 90 mM KCl (SH-SY5Y cells) stimulation. Light emission was measured in a luminescence counter (MicroBeta2 LumiJET Microplate Counter, PerkinElmer) at 469 nm every 0.1 s. Experiments were also performed in HeLa cells transiently transfected with mt-AEQ (Manjarrés et al., 2008). Briefly, cells were seeded in 4-well plates at 4x10⁴ cells/well 24 hr prior to transfection with Lipofectamine 2000 (Thermo Fisher Scientific, 11668-019). One day after transfection, cells expressing apoaequorin were incubated with 1 μM native coelenterazine and mitoxantrone (20 μM) or vehicle DMSO (0.2%) for 2 hr at 22°C in an external medium containing (in mM): 145 NaCl, 5 KCl, 1 CaCl2, 1 MgCl2, 10 glucose, 10 Na–HEPES, pH 7.4. Luminescence was recorded in a purpose-built luminometer (Cairn, UK) equipped with a perfusion system (~5 mL/min flow rate) at 22°C and mt-[Ca2+] was quantified (Montero et al., 2000). For ER-[Ca2+] measurements, cells stably-expressing ER-AEQ were reconstituted with 1 μM coelenterazine derivative n by incubation in Ca2+-free external medium with 0.5 mM EGTA and 10 μM of the SERCA inhibitor 2,5-ditert-butyl-benzohydroquinone, TBH) with either mitoxantrone (20 μM) or vehicle DMSO (0.2%) for 2 hr at 22°C. The experiment was started by washing out TBH with external medium containing 1 mM CaCl2 during 5 min. Then, cells were challenged with histamine (100 μM) during 30 s. In the experiments using permeabilized cells, these were incubated for 1 min with digitonin (50 μM) in an
intracellular-like medium containing (in mM): 140 KCl, 1 K2HPO4, 1 MgCl2, 1 Mg-ATP, 2 sodium succinate, 1 sodium pyruvate, 20 sodium-HEPES (pH 7.2), and 0.5 EGTA. The solution was then switched to an intracellular-like medium containing 100 nM free-Ca2+ (buffered with EGTA) during 5 min in order to refill the ER. Inositol trisphosphate (200 nM) was spiked in the same intracellular-like medium for 30 s. At the end of each experiment, cells were lysed by perfusion with a solution containing 0.1 mM digitonin and 10 mM CaCl2 to release all the residual aequorin counts. Light emission was calibrated using the constant values previously published (Montero et al., 2000).
Electrophysiological Measurements on Taste Cells—Whole-cell currents were measured from individual type II taste cells isolated from the circumvallate papillae of TRPM5-GFP Calhm1-KO mice. Currents were measured with an Axopatch 200-B amplifier (Molecular Devices) controlled via an ITC-16 interface (Instrutech) by Pulse software (Heka). Currents were evoked by 100 ms voltage pulses from −80 to +65 mV in 5 mV increments, from a holding potential of −70 mV. The pipette solution contained (in mM): 140 K+, 6 Na+, 1 Mg2+, 1 Ca2+, 30 Cl−, 11 EGTA, 3 ATP2−, 0.3 Tris GTP, and 10 HEPES, pH 7.3 adjusted by methanesulfonic acid, 290 mOsm. The bath solution contained (in mM): 150 Na+, 5.4 K+, 1.5 Ca2+, 1 Mg2+, 150 Cl−, 20 glucose, and 10 HEPES, pH 7.4 adjusted by methanesulfonate, 330 mOsm. I–V relations of peak inward Na+ currents were determined before and after > 5 min continuous perfusion of 10 μM mitoxantrone into the recording chamber (Perfusion Fast-Step, SF-77B, Warner Instruments) and again after drug washout. Likewise, I–V relations of outward K+ currents were obtained by measurements of steady-state currents at the end of 100-ms pulses. All currents were normalized by the whole-cell capacitance (the average capacitance of 4.5 pF; n = 3).
A
uthor Man
uscr
ipt
A
uthor Man
uscr
ipt
A
uthor Man
uscr
ipt
A
uthor Man
uscr
Electrophysiological Measurements on SH-SY5Y Cells—SH-SY5Y cells were plated onto glass coverslips and mounted in a recording chamber that was continuously perfused with either regular bath solution (in mM): 10 BaCl2, 145 TEA-Cl, 10 HEPES, 10 glucose, pH 7.4/TEA-OH, osmolarity 300 mOsm/Kg; or with bath solution supplemented with 10 μM mitoxantrone. Patch pipettes were filled with (in mM): 30 CsCl, 110 CsOH, 2 TEA-OH, 1 Ca(OH),; 11 EGTA, 10 HEPES, pH 7.3/methanesulfonic acid, osmolarity 310 mOsm/Kg. Whole-cell currents were recorded upon voltage stimulation with 500 ms depolarizing step pulses, starting at −80 mV in 10 mV increments delivered every 5 s (holding potential - 100 mV). Traces were on-line corrected for leakage with the -P/5 procedure. Currents were recorded with the same patch-clamp setup used for mitochondrial electrophysiology.
Electrophysiological Measurements on Xenopus Oocytes—Oocytes were isolated from female Xenopus laevis (Xenopus One) and defolliculated with type IV collagenase (Worthington Biochemical) in OR2 medium (in mM: 85 NaCl, 2.5 KOH, 1 MgCl2, 5 HEPES, pH 7.6). Defolliculated oocytes were injected with 15 ng of Xenopus connexin-38 antisense RNA. 48 hr after injection, oocytes were incubated in OR2 medium in the presence or absence of 2 μM thapsigargin (dissolved in DMSO; DMSO did not exceed 1% in the working solution). Recordings were done at least 3 hr after incubation in 2 μM thapsigargin. Currents were recorded using a Warner OC 725-C voltage-clamp amplifier controlled via an ITC-18 interface (Instrutech) by Pulse software (Heka). Oocytes were placed in standard bath solution containing (in mM): 100 Na+, 100 Cl−, 2 K+, 1 Mg2+ and HEPES (pH 7.2), with either 5 Ca2+/0 Mg2+ with or without 10 μM mitoxantrone. To record activities of store operated Ca2+ currents, currents were evoked by a voltage ramp protocol from −120 mV to +80 mV for 10 s, repeated every 40 s (holding potential: −60 mV). Peak inward currents at −120 mV were carried by Ca2+, since Ca2+-activated Cl− channels are closed at this voltage and the currents were eliminated by removal of extracellular Ca2+. To record Ca2+-activated Cl− currents, oocytes clamped at a holding potential of −60 mV were first depolarized by a pre-pulse to +60 mV for 5 s, to activate Ca2+-activated Cl− channels. The voltage was then stepped to a hyperpolarizing pulse of −120 mV for 300 ms to drive Ca2+ influx. After that, the transient Ca2+-activated Cl− currents were immediately recorded by a depolarizing test pulse to +60 mV for 5 s. The double pulse protocol was repeated every 40 s. The transient Ca2+-activated Cl− currents were quantified offline by measuring the peak currents at the depolarizing test pulse and subtracting the peak currents at the
depolarizing pre-pulse, and normalizing the result to the peak current at the depolarizing test pulse in 5 mM Ca2+. Current analysis was done using Igor software (Wavemetrics, USA).
QUANTIFICATION AND STATISTICAL ANALYSIS
Statistical Analysis of Primary Screens—Data analysis was performed using MATLAB software. The dynamics of mt-Ca2+ -dependent luminescence was smoothed by the cubic spline function:
A
uthor Man
uscr
ipt
A
uthor Man
uscr
ipt
A
uthor Man
uscr
ipt
A
uthor Man
uscr
where, p is a smoothing parameter, controlling the tradeoff between fidelity to the data and roughness of the function estimate, f is the estimated cubic spline function to minimize the above function, and xi and yi are the dynamical data points. Here, p is set at 0.5. For each compound, two parameters were directly extracted: the maximal amplitude of the
luminescence signal (peak) and the left slope of the bell-shaped kinetic trace (uptake rate). Based on these parameters an inhibition score, Idrug, was assigned to each compound Ci as follows:
where, ui is the fitted value of the compound Ci, and μ̄ is the trimmed average of positive and negative controls. Compounds were considered as hits when Idrug was higher than 0.5. For each plate, the Z′-factor was calculated as follows (Zhang et al., 1999):
where, μ and δ are the mean and standard deviation, respectively.
Quantification of mt-Ca2+ Concentrations—Systematic quantification of mt-Ca2+ concentrations was performed using the algorithm reported in Bonora et al. (2013) with the following formula:
where λ = 1, KR = 7.23x10⁶, KTR = 120 and n = 2.99.
Data Analysis—All data are represented as mean ± SEM and the statistical details of experiments can be found in the figure legends. Differences between two datasets were evaluated by two tailed unpaired Student’s t test. Statistical tests between multiple datasets and conditions were carried out using one-way analysis of variance (ANOVA) followed by Tukey’s post hoc test. A P-value < 0.05 was considered statistically significant. Statistical analyses were performed using GraphPad Prism version 5.0 (GraphPad Software, San Diego, CA, USA).
DATA AND SOFTWARE AVAILABILITY
The unprocessed image files used to prepare the figures in this manuscript have been deposited to Mendeley Data and are available at http://dx.doi.org/10.17632/54jw24wvn5.1.
A
uthor Man
uscr
ipt
A
uthor Man
uscr
ipt
A
uthor Man
uscr
ipt
A
uthor Man
uscr
Supplementary Material
Refer to Web version on PubMed Central for supplementary material.
Acknowledgments
We thank M. Jastroch and T. Misgeld for helpful discussions, U. Uhrig for assistance on molecular docking studies, and J. Lewis and B. Jehle for assistance on drug screening. This work was supported by the German Research Foundation (DFG) under the Emmy Noether Programme (PE 2053/1-1) to F.P., J.W., D.M.A., and A.L.; the Bavarian Ministry of Sciences, Research and the Arts in the framework of the Bavarian Molecular Biosystems Research Network (D2-F5121.2-10c/4822) to F.P., A.G., C.G.-P., and Y.C.; the Munich Center for Systems Neurology (SyNergy; EXC 1010) to F.P.; the NIH grants GM56328 to J.K.F. and R01DC012538 to J.K.F. and Z.M.; the Spanish Ministerio de Economía y Competitividad grant BFU2014-53469P and the Instituto de Saludo Carlos III grant RD16/0011/0003 to M.T.A. and J.G.-S.; and the DFG grant MO1944/1-1 to D.M.
References
Alonso MT, Navas-Navarro P, García-Sancho J. A microplate-based bioluminescence assay of mitochondrial calcium uptake. Methods Mol Biol. 2017; 1567:245–253. [PubMed: 28276023] Attene-Ramos MS, Huang R, Michael S, Witt KL, Richard A, Tice RR, Simeonov A, Austin CP, Xia
M. Profiling of the Tox21 chemical collection for mitochondrial function to identify compounds that acutely decrease mitochondrial membrane potential. Environ Health Perspect. 2015; 123:49–56. [PubMed: 25302578]
Baughman JM, Perocchi F, Girgis HS, Plovanich M, Belcher-Timme CA, Sancak Y, Bao XR, Strittmatter L, Goldberger O, Bogorad RL, et al. Integrative genomics identifies MCU as an essential component of the mitochondrial calcium uniporter. Nature. 2011; 476:341–345. [PubMed: 21685886]
Bell DH. Characterization of the fluorescence of the antitumor agent, mitoxantrone. Biochim Biophys Acta. 1988; 949:132–137. [PubMed: 3334848]
Bonora M, Giorgi C, Bononi A, Marchi S, Patergnani S, Rimessi A, Rizzuto R, Pinton P. Subcellular calcium measurements in mammalian cells using jellyfish photoprotein aequorin-based probes. Nat Protoc. 2013; 8:2105–2118. [PubMed: 24113784]
Brand MD, Nicholls DG. Assessing mitochondrial dysfunction in cells. Biochem J. 2011; 435:297– 312. [PubMed: 21726199]
Cammer W, Moore CL. The effect of hexachlorophene on the respiration of brain and liver mitochondria. Biochem Biophys Res Commun. 1972; 46:1887–1894. [PubMed: 5015232] Cao C, Wang S, Cui T, Su XC, Chou JJ. Ion and inhibitor binding of the double-ring ion selectivity
filter of the mitochondrial calcium uniporter. Proc Natl Acad Sci USA. 2017; 114:E2846–E2851. [PubMed: 28325874]
Carafoli E, Lehninger AL. A survey of the interaction of calcium ions with mitochondria from different tissues and species. Biochem J. 1971; 122:681–690. [PubMed: 5129264]
Chamero P, Manjarres IM, García-Verdugo JM, Villalobos C, Alonso MT, García-Sancho J. Nuclear calcium signaling by inositol trisphosphate in GH3 pituitary cells. Cell Calcium. 2008; 43:205– 214. [PubMed: 17583789]
Chaudhuri D, Clapham DE. Outstanding questions regarding the permeation, selectivity, and regulation of the mitochondrial calcium uniporter. Biochem Biophys Res Commun. 2014; 449:367–369. [PubMed: 24792175]
Chaudhuri D, Sancak Y, Mootha VK, Clapham DE. MCU encodes the pore conducting mitochondrial calcium currents. eLife. 2013; 2:e00704. [PubMed: 23755363]
Cheah KS, Waring JC. Effect of trifluoperazine on skeletal muscle mitochondrial respiration. Biochim Biophys Acta. 1983; 723:45–51. [PubMed: 6830768]
De Stefani D, Raffaello A, Teardo E, Szabò I, Rizzuto R. A forty-kilodalton protein of the inner membrane is the mitochondrial calcium uniporter. Nature. 2011; 476:336–340. [PubMed: 21685888]