Type 1 diabetes, also known as insulin-dependent diabetes, makes up approximately 5-10% of all cases of diabetes (American Diabetes Association, 2010), and is growing in prevalence. In Europe, it has been predicted to double in children under 5 by 2020; in America the prevalence rate continues to be one of the highest in the world (Patterson, Dahlquist, Gyürüs, Green, & Soltész, 2009; Shaw, Sicree, & Zimmet, 2010).
In diabetes imbalances, hypoglycaemia is considered a limiting factor in achieving optimum control over diabetes, as it may have serious consequences for the patient and because they tend to be chronically averse to the self-care process. This is partly due to fear that patients generally seem to develop (Gonder-Frederick, Nyer, Shepard, Vajda, & Clarke, 2011) which has a negative infl uence on the management of diabetes, in some cases manifesting itself
as the tendency to maintain hyperglycaemic values (Wild et al., 2007).
While hypoglycaemia is a reality for people with type 1 diabetes (Childs, Grothe, & Greenleaf, 2012), the glycaemic threshold for a hypoglycaemic attack and the severity and the symptomology with which it is expressed varies between individuals, and even the same individual may well experience differences in each episode at different stages of his/her life (Abdelhafi z, Bailey, Eng Loo, & Sinclair, 2013; Gonder-Frederick, Cox, Driesen, Ryan, & Clarke, 1994).
Various studies which have analysed the type of variables that may be predictors of hypoglycaemic frequency report that a history of hypoglycaemia and low blood sugar levels are predictors of severe hypoglycaemia (Cox, Gonder-Frederick, Ritterband, Clarke, & Kovatchev, 2007). Similarly, the relationship between hypoglycaemic states and overdoses of insulin, the delay or maladjustment of unsuitable foods and imbalanced physical exercise remains evident (Childs et al., 2012).
The prevention of serious hypoglycaemia is partly based on accurately anticipating its occurrence (Cox et al., 2007). Some authors note that the ability to estimate blood sugar levels is
Exploration of glycaemic states in children with type 1 diabetes
Genoveva Granados Gámez and Verónica V. Márquez Hernández
Universidad de AlmeríaAbstract
Resumen
Background: The prevention of severe hypoglycaemia is based in art on accurately anticipating its occurrence. The aim of the study was to analyse the effect of a feedback procedure on the glycaemic state of children with type 1 diabetes, aswell as the associated symptoms and estimated BGL. Method: For 7 days, 17 participants performed both scheduled capillary blood tests, and an estimate and self-analysis whenever they thought that there were changes in their BGL. Results: A total of 454 trials were analysed with a mean of 178 mg/dl (SD= 36.4). Only 5.1% of the estimates corresponded to hypoglycaemia states, 36.77% were in areas with clinically dangerous consequences and were more accurate when the BGL reached the levels of <= 56 mg/dl and less accurate when it reached >240 mg/dl. The children reported symptoms at random, made mistakes when linking them with the BGL and demanded opportunity feedback believing they were in state of hypoglycaemia, while being in hyperglycaemia. Conclusions: The BGL was highly variable, certain glycaemic profi les peaked, with a greater average of hypoglycaemia than in the children’s usual daily surroundings and did not present a profi le of reliable signs indicative of BGL. The tendency to underestimate values when glycaemia was in hyperglycaemic levels is confi rmed.
Keywords: Child, feedback, type 1 diabetes.
Exploración de estados glucémicos en pacientes infantiles con diabetes tipo 1.Antecedentes: la prevención de la hipoglucemia grave se basa en parte en anticipar con precisión su ocurrencia. El objetivo del estudio fue analizar el efecto de un procedimiento de feedback sobre el estado glucémico de pacientes infantiles con diabetes tipo 1, los síntomas asociados y las estimaciones del NGS. Método: durante 7 días, 17 participantes realizaron mediciones programadas de sangre capilar y otras cada vez que tenían sospecha de alteraciones en su NGS. Resultados: se han analizado 454 ensayos, con una media de 178mg/dl (DE= 36.4). De las estimaciones precisas, solo el 5,1% correspondían a estados de hipoglucemia, el 36,77% se situaron en zonas de consecuencias clínicamente peligrosas y fueron más precisos cuando el NGS estaba en niveles <= 56 mg / dl y menos precisos cuando era >240 mg/dl. Informaron síntomas de forma aleatoria, cometieron errores al vincularlos con el NGS y demandaron feedback de oportunidad creyéndose en estado de hipoglucemia, encontrándose en hiperglucemia. Conclusiones: los NGS mantuvieron una alta variabilidad, con mayor promedio de hipoglucemias que en su hábitat cotidiano y no presentaron un perfi l de señales fi ables indicadoras de su NGS. Se ratifi ca la tendencia a subestimar los valores cuando la glucemia se situaba en niveles hiperglucémicos.
Palabras clave: paciente infantil, retroalimentación, diabetes tipo 1.
Received: June 21, 2016 • Accepted: January 26, 2017 Corresponding author: Verónica V. Márquez Hernández Facultad de Ciencias de la Salud
complex and multifactorial, potentially infl uenced by a number of different variables (Gonder-Frederick et al., 2008). Among these may be anxiety levels (Ryan, Dulay, Suprasongsin, & Becker, 2002) and others aspects such as distraction due to environmental factors and understanding and familiarity with the symptom, with the conclusion that behavioural symptoms are the best predictors of hypoglycaemia (Graveling et al., 2014).
Experts agree that the Glycated Haemoglobin (HbA1c) is not the most comprehensive of blood glucose level markers, doubting its effi cacy and the standard variation, as they do not refl ect its variability (American Diabetes Association, 2005). It is therefore recommendable in special or non-daily situations to be more attentive to warning signs, carrying out a continuous monitoring of blood sugar levels (Cox et al., 2007), or if necessary, doing further self-analysis, through daily, frequent registering of capillary glycaemia, with the adequate amount of measurements a day being 5 to 7 among individuals at risk (Cox, Gonder-Frederick, Antoun, Cryer, & Clarke, 1993; Gil Roales-Nieto & Vílchez Joya, 1993; Martín Vaquero, Barquiel Alcalá, Puma Duque, & Lisbona Catalán, 2009).
Bio-psycho-behavioural interventions, based on precise, real-time feedback of blood glucose (BG) levels (Gonder-Frederick, Cox, & Ritterband, 2002; Gonder-Frederick et al., 2008; Kovatchev et al., 2011) and their correspondence with external signs have been found to have positive effects both in the recognition of hypoglycaemia and in the making of decisions related to the self-regulation of blood sugar levels, at the same time as patients’ education and understanding improve as a result of learning based on their own experiences (Luzoro García & Gil Roales-Nieto, 1993; Ybarra Sagarduy & Gil Roales-Nieto, 2004). However, as highlighted by Gil Roales-Nieto (2000, 2004), self-monitoring is only possible if accurate and immediate feedback regarding BGL is available. Given the numerous occasions throughout the day when this information is not available by an objective measure, diabetic patients must adapt to a functional outline called the “gluco-insulin bio behavioural feedback system”(Gil Roales-Nieto, 2000, 2004), which combines a complex process of making decisions based on objective and subjective assessments of BGL. From this perspective, the intervention program in the “discrimination of glycaemic states” clinic (Gil Roales-Nieto & Vílchez Joya, 1993), to which this study is limited, aims to improve the detection and interpretation of specifi c symptoms for each patient, through their experience and improving the process of self-control.
Based on the literature consulted, the present study aims to explore the effect of a BGL feedback procedure on the glycaemic state of children with type I diabetes, symptoms related to it and BGL estimates in camp conditions; with the purpose of controlling the episodes of hyperglycaemia, avoiding the presence of hypoglycaemia, in special situations, for non-daily life.
Method
Participants
The study included 17 children with type I diabetes, 11 girls (64.70%) and 4 boys (35.3%), with an average age of 10.7 (SD = 2.4), and with an age range of 6 to 14. Prior to going, the participants underwent a check-up and showed an average HbgA1 of 8.06 % (SD = 1.78).
The assessment took place in a summer school located in Sierra de los Filabres, Almeria (Spain). All stated that they had
received diabetes-related education in specifi c programs and none had experienced this type of vacation activity before. Consent was obtained from both the children and the parents. Table 1 shows the results of the participants’ characteristics in relation to the demographic, anthropometric and physiological variables.
Instruments
In the data collection, the following were employed:
1) The General Information Questionnaire (CHH) was used to gather information regarding socio-demographic variables as well as those related to diabetes.
2) The SI/IC-3 symptom scale (adapted, Cox, Carter, Gonder-Frederick, Clarke, & Pohl, 1988; Cox et al., 1985; Gil Roales-Nieto, 2004; Gil Roales-Nieto & Vílchez Joya, 1993) composed of 21 symptoms and 6 moods, and the items that collect the real and estimated values of BGL. Allowing us to:
a. Measure symptoms associated with glycaemic states, establishing the following categories: Correct guesses (symptoms believed to be related and actually were); Errors (symptoms not thought to be related that actually were); False alarms (symptoms believed to be related that were not) and Correct rejections (symptoms not thought to be related that truly were not).
b. Identify whether or not the subjects had a pattern of symptoms that served (on occurrence) as a predictive sign in relation to their glycaemic state.
c. The real values of BGL in mg/dl – classifi ed depending on the glycaemic intervals. The analysis was carried out with a sample of capillary blood, using Microlet ® lancing devices with an adjustable head and fi ve different penetration depths and the Ascensia Esprit 2 ® glucose meter with 10 AscensiaGlucodisc® sensors, both from Bayer Laboratories.
Table 1 Demographic and clinical data
Variable M SD Minimum Maximum
Age (years) 10.7 2.4 7 14
Duration of type 1 diabetes
diagnosis (months) 66.1 41.2 1 156
Blood glucose levels (mg/dl) 181.5 36.2 30 554
HbA1c beginning of the study 8.06 1.78
Variable n %
Male 6 35
Female 11 65
< 60 mg/dl (severe hypoglycaemia) 46 10.1
60-80 mg/dl (hypoglycaemia) 49 10.8
80-180 mg/dl (normoglycaemia) 159 34.9
180-300 mg/dl (hyperglycaemia) 126 27.7
<300 mg/dl 75 16.5
Hypoglycaemia 46 10.1
d. Estimated BGL values. In order to measure the variable BGL differentiation, the Precision Index (PI) was chosen (Cox et al., 1985, 1988; Gonder-Frederick et al., 2008), which is obtained through a system known as Error Grid Analysis (EGA). This measurement, which integrates both the accuracy of BGL estimations and their health implications, represents an approximate qualitative analysis of the estimation errors and classifi es the estimations according to: (1) Their accuracy or inaccuracy, that is to say the deviation between the absolute values and the real BGL value and (2) the clinical decisions related to self-treatment which may be made based on the estimated BGL values, grouped in the areas: A: precise estimates of benefi cial clinical consequences; B: benign errors of estimation; C: error when confusing normal with hypo or hyperglycaemia; D: failure to detect extreme levels: estimates considered imprecise and of dangerous clinical consequences and E: error in confusing hypo with hyperglycaemia. e. In the quantitative evaluation of estimation errors (EE),
to be considered an EE, the criteria of 20% positive or negative deviation of estimated values in relation to real values in each test was used. Underestimations (those which showed negative deviation) and overestimations (those which showed positive deviation) were analysed.
Procedure
Phase A (preparation, day one) implied an adaptation stage for the patients, to living together in the camp. The subjects completed a questionnaire by means of a personal interview, which collected information regarding general data and history of hypoglycaemia.
Phase B (assessment): the participants would carry out a glycaemic profi le of six tests with the following timetable: 8:30 – 12:00 – 14:00 – 17:00 – 21:00– 24:00. Were also asked to carry out a self-analysis any time that they thought they noticed changes in their BGL. Each trial comprised the following steps:
1. The participants fi rstly indicated which of the symptoms or feelings they were experiencing.
2. Before carrying out the analysis, the subjects went on to guess if their BGL at that moment was low, normal, high or very high (as precise as possible)
3. They then performed the SMBG (self-monitoring of blood glucose) and noted down the real value of the BGL measured.
From the second to the seventh day of the study, the procedure remained the same as the one described. This phase was extended for evident clinical considerations related to the self-checking needs.
Data analysis
The data was analysed using the statistics program SPSS (version 20). The characteristics of the sample were analysed using the average, typical deviation and frequency. For the real BGL value analysis, a descriptive analysis was carried out taking frequencies, percentages, average and typical deviation for the
levels measured into account. The normal distribution of the sample was previously checked. The student’s t-test was used to compare the real BGL values with the participants’ gender and a Pearson correlation was carried out between the variables of age and real BGL values.
To analyse the symptoms associated with glycaemic states, the frequency and percentage of correct and incorrect guesses what taken into account, as well as the perceived symptoms in the case of hypo and hyperglycaemia. The student’s t-test was used to compare the perceived symptoms and age, while the Chi-square test was utilized to compare gender and perceived symptoms. P<.05 was considered signifi cant in all cases. For the estimated BGL levels, the precision index (PI) was used with the formula PI= (% of estimations represented in zone A) – (% of estimations represented in zones C, D, and E) together with the Error Grid Analysis (EGA) system.
Results
Real BGL values
The 454 trials that met the inclusion criteria were analysed, with an average BGL of 181.52 (SD = 36.4) global. Two hundred and fi fty six extra non-planned checks were required, 128 of which revealed the subjects as having levels of hyperglycaemia or in the period that decreases to normoglycaemia, and on 19 occasions, they showed levels of hypoglycaemia. Statistically signifi cant differences were found between the time of the tests and the levels of hypoglycaemia and hyperglycaemia (p<.05) respectively. As such, it could be deduced that hypoglycaemia and hyperglycaemia were related with the timetable – in the case of hypoglycaemia, the majority of cases were within the determined timetable, whereas in the case of hyperglycaemia, the majority of cases were detected through extra tests.
On classifying the values obtained relating to the real blood glucose levels, the results showed that 20.9% (n= 95) of the tests carried out were in the range considered to be hypoglycaemia, and 50% of these showed levels of under 60 mg/dl of glucose, which would be severe hypoglycaemia. Hyperglycaemia comprised 44.2% (n = 201) of the tests, with more than 25% showing levels over 300 mg/dl. Levels considered within the range of normoglycaemia composed 34.9% of the tests (Table 1). The descriptive analysis of glycaemia levels showed that in 65.1% of the tests, changes to the treatment routine were required, whether related to food, exercise or insulin. Statistically signifi cant differences were found between the glycaemic ranges of BGL (p =.021) No signifi cant differences were found when comparing the participants’ gender with the real BGL values (t(15)= .48; p = .63). However, age and real values were strongly correlated (r= .61; p<.05).
Symptoms associated with glycaemic states
155) were between 80-180 mg/dl, while in relation to errors, the majority (n= 141) were in the 180-300mg/dl range.
In the case of hypoglycaemia, the most noticed symptoms were a dry mouth (15.2%), dizziness (19.6%), thirst (15.2%), shaking (17.4%) and hunger (23.9%). For hyperglycaemia, the most reported symptoms were a dry mouth (22.9%), tiredness (15.9%) and thirst (17.9%). Statistically signifi cant differences were found between age and perceived symptoms (t(15)= 8.37; p<.05), and symptoms and participant gender (p<.05).
The data regarding the symptomatic profi le indicates that only four participants related signs with their BGL in line with certain glycaemic categories. One subject reported thirst in 56.25% of their hyperglycaemic states and two participants reported a dry mouth. Another subject could have two star symptoms – sweating for hypoglycaemia states (50% of cases) and a “furry” mouth for BGL of hyperglycaemia (66.6% of cases). The rest of the subjects did not guess symptoms specifi cally related with their BGL.
Estimated BGL levels
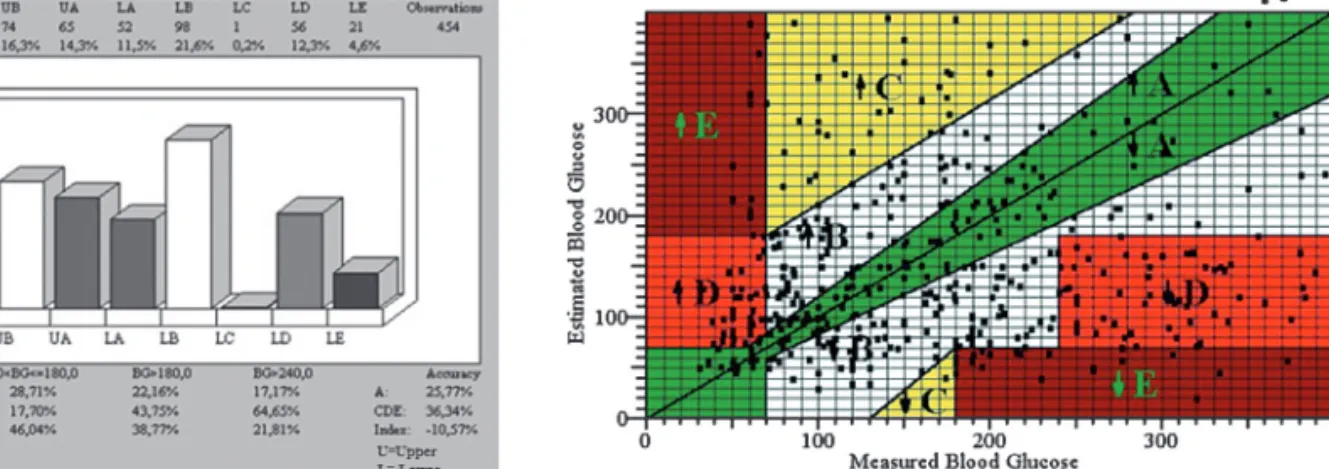
The frequencies and percentages of the PI for each grid zone (EGA) can be seen in Figure 1, with the highest percentage in high zone B (represents benign estimation errors) corresponding to 21.6% and 16.3% in the low zone. Zone A (which shows accurate guesses, with clinically benefi cial consequences) indicates that the subjects guessed more accurately when the glucose levels were <=56 mg/dl (in 33.33% of the corresponding tests in that said zone). It also shows that the subjects estimated their BG levels less accurately when they were in the range of > 240 mg/dl. Overall, the results for this subject group showed a negative difference of -10.57%, implying a slight predominance of estimations in zones C, D and E. The analysis of zones C, D and E (guesses considered
to be inaccurate and with clinically dangerous consequences) indicates that the overall values represented 36.77% of the tests, and that these errors occurred in 73.91% of cases when the range was between >56 and <=70 mg/dl., with a decrease in errors for BG <56 (66.67%) and BG< 240 (64.65%) values.
Figure 2 refl ects the distribution of marks in the grid areas, showing each pair of data points (estimated value and real value) for each test. With regard to zone E (confusing hypo and hyperglycaemia), it indicates that the subjects in this group made serious errors 4.6% of the time in the high zone (estimated BG>180 when real BG was <56) and 3.1 % in the low zone (estimated BG <56 when real BG real was >180). In zone C (confusing normal for hypo or hyperglycaemia) 7.9% of the errors were found in the low zone whereas only 0.2% were found in the high zone (estimations of BG >=180 or <=80 when real BG was <=180 and >=80). Finally, in zone D (failure to detect extreme levels), 12.3% of errors corresponded to the high zone and 8.1% to the low one (estimations between 80-180 and real levels >=180 or <80).
Considering the analysis of EE in the BGL estimations, of the total number of estimations made by the group, only 30% comprised accurate guesses, 13% of which corresponded to real normoglycaemic BG levels, 7.9% were correct guesses of hyperglycaemic values and 5.1% of accurate estimations were for hypoglycaemic values (2.9% hypoglycaemic and 2.2% severe hypoglycaemic). The proportion of overestimating errors was the same as that of accurate guesses - 30% in both cases. A large amount of the overestimations occurred when the real BGL showed hypoglycaemic values (a total of up to 14%), while the rest related to normoglycaemic BGL. The percentage of hyperglycaemic BGL, which were overestimated, proved to be insignifi cant (around 2% of the total overestimating cases) (see Table 2).
Figure 1. Distribution of Precision Index (PI) Figure 2. Distribution of real and estimated BG levels
Table 2
Types of BGL estimations for the group, divided into glycemic categories
Real values mg/dl Test Overestimated >20% Correct 0±20% Underestimated <20%
<60 46 33 24.4 13 9.6 0 0.0
≥60 <80 49 30 22.2 17 12.6 2 1.1
≥80 <180 159 60 44.4 59 43.7 39 21.1
≥180 <300 126 11 8.1 36 26.7 80 43.2
≥300 75 1 0.7 10 7.4 64 34.6
Discussion
In the situation presented, the data regarding the participants’ hypoglycaemic episodes showed that the children experienced more on average during the study period than in their day-to-day life. In both cases, the fi gure was higher than the two weekly episodes reported in Cryer’s study (2010). In turn, almost fi fty per cent of the control values indicate states of hyperglycaemia and more than twenty-fi ve per cent indicate severe hyperglycaemia. Specifi cally, in 65.1% of the controls, changes in the level of activity and as well as greater adjustments between insulin (type, doses, etc.) and diet were required, which could be contributing to the imbalances observed in the BGL (Childs et al., 2012) and in the identifi cation of signs, predictors of hypoglycaemic states (Graveling et al., 2014).
With regard to warning signs related to changes in glycaemia, the patients indicated all types of symptoms, which occurred randomly in the intervals, confi rming the idiosyncrasies in the symptom report. The most frequent errors were not identifying symptoms when in real hypoglycaemic states and the error of reporting symptoms that they linked to hypoglycaemia in normoglycaemic states, as previously described in another study (Ybarra Sagarduy & Gil Roales-Nieto, 2004). Similarly, in this group, the lack of a symptomatic profi le in camp conditions was confi rmed, as only four of the subjects showed signs of maintaining one at some points.
The results of this study depart from the positive effects in the recognizing of hypoglycaemia found in other investigations (Gonder-Frederick et al., 2002, 2008; Kovatchev et al., 2011). The theory that in this study, only feedback and internal signs were used together with distracting elements which may void the potential reinforcing power of possible knowledge gained from the BGL feedback could justify the lack of EE variation and the sustaining of the BGL variability, as other authors have found with (Gil Roales-Nieto, 2004; Luzoro García & Gil Roales-Roales-Nieto, 1993; Ybarra Sagarduy & Gil Roales-Nieto, 2004). In turn, the results of the
symptom report leads us to believe that they were not used as control mechanisms, with the exception of extreme hypoglycaemia, and the high variability of values would not guarantee their use either. Other problems added to feedback effectiveness (contingent reinforcer for glucose level estimation) may be due to the low occurrence of correct estimation patterns to reinforce, against many occurrences of erroneous estimation patterns, without the subject analysing the true occurrence of such interactions.
The slight predominance of estimations in zones considered inaccurate and with clinically dangerous consequences confi rms the need for patients with type 1 diabetes to continue carrying out self-analyses in holiday camps as a preventative measure, the most effective amount being 5 to 7 tests, in line with other studies (Cox et al., 1993; Gil Roales-Nieto &Vílchez Joya, 1993; Martín Vaquero et al., 2009).
Coinciding with other studies (Frankum & Ogden, 2005; Marlebi & Matos, 2001; Wagner & Ruggiero, 2004), the EE analysis indicates that 70% of the tests involve EE and in this group, EE occurred in equal measure for underestimations when the values were found to be normoglycaemic. The tendency of the subjects to underestimate values when their glycaemia showed hyperglycaemic levels and overestimate their BGL when it was hypoglycaemic was probably related with the avoidance of possible references which indicated health problems as they could have stopped them from taking part in holiday activities such as dancing, playing etc.
The results of this study serve as a warning for dangerous health-related situations and the focus of action to control extreme BGL. In addition to this, they identify the need to improve interventions which help to perform an exact assessment of BGL (Sparacino, Facchinetti, Zecchin, & Cobelli, 2014) not only in special circumstances but also for occasions where carrying out an analysis is not possible. The research should be interpreted with caution because of the small number of participants; also these participants were in some specifi c conditions in summer school. As a result, the fi nding presented here cannot be generalized to different situation.
References
Abdelhafi z, A.H., Bailey, C., Eng Loo, B., & Sinclair, A. (2013). Hypoglycaemic symptoms and hypoglycaemia threshold in older people with diabetes-A patient perspective. The Journal of Nutrition,
Health and Aging, 17, 899-902.
American Diabetes Association (2005). Committee Reports and Consensus Statements. Workgroup on hypoglycemia: Defi ning and reporting hypoglycemia in diabetes: A report of the American Diabetes Association Workgroup on Hypoglycemia. Diabetes Care, 28, 1245-1249.
American Diabetes Association (2010). Diagnosis and classifi cation of diabetes mellitus. Diabetes Care, 33, S62-S69.
Childs, B.P., Grothe, J.M., & Greenleaf, P.J. (2012). Strategies to limit the effect of hypoglycemia on diabetes control: Identifying and reducing the risks. Clinical Diabetes, 30, 28-33.
Cox, D.J., Carter, W.R., Gonder-Frederick, L.A., Clarke, W.L., & Pohl, S.L. (1988). Blood glucose discrimination training in insulin-dependent diabetes mellitus (IDDM) patients. Biofeedback and Self
Regulation, 13, 201-217.
Cox, D.J., Gonder-Frederick, L., Antoun, B., Cryer, P.E., & Clarke, W.L. (1993). Perceived symptoms in the recognition of hypoglycemia.
Diabetes Care, 16, 519-527.
Cox, D.J., Gonder-Frederick, L., Pohl, S., Carter, W., Clarke, W., Bennett-Johnson S., …, Moses, J. (1985). Symptoms and blood glucose levels in diabetics. The Journal of the American Medical Association, 253, 1558.
Cox, D.J., Gonder-Frederick, L., Ritterband, L., Clarke, W., & Kovatchev, B.P. (2007). Prediction of severe hypoglycemia. Diabetes Care, 30, 1370-1373.
Cryer, P.E. (2010). Hypoglycemia in Type 1 Diabetes Mellitus.
Endocrinology and Metabolism Clinics of North America, 39,
641-654.
Frankum, S., & Ogden, J. (2005). Estimation of blood glucose levels by people with diabetes: A cross-sectional study. The British Journal of
General Practice, 55, 944-948.
Gil Roales-Nieto, J. (2000). Manual de Psicología de la Salud.
Comportamiento y Salud/Enfermedad [Manual of Health Psychology.
Behavior and Health / Illness]. Granada: Némesis.
Gil Roales-Nieto, J. (2004). Psicología de la Salud. Aproximación
histórica, conceptual y aplicaciones [Psychology of Health. Historical,
conceptual and applications approach]. Madrid: Ediciones Pirámide. Gil Roales-Nieto, J., & Vílchez Joya, R. (1993). Diabetes. Intervención
Gonder-Frederick, L.A., Cox, D.J., Driesen, N.R., Ryan, C.M., & Clarke, W.L. (1994). Individual differences in neurobehavioral disruption during mild and moderate hypoglycemia in adults with IDDM.
Diabetes, 43, 1407-1412.
Gonder-Frederick, L.A., Cox, D.J., & Ritterband, L.M. (2002). Diabetes and behavioral medicine: The second decade. Journal of Consulting
and Clinical Psychology, 70, 611-625.
Gonder-Frederick, L., Nyer, M., Shepard, J.A., Vajda, K., & Clarke, W. (2011). Assessing fear of hypoglycemia in children with Type 1 diabetes and their parents. Diabetes Management, 1, 627-639. Gonder-Frederick, L., Zrebiec, J., Bauchowitz, A., Lee, J., Cox, D.,
Kovatchev, B., …, Clarke, W. (2008). Detection of hypoglycemia by children with type 1 diabetes 6 to 11 years of age and their parents: A
fi eld study. Pediatrics, 121, e489-e495.
Graveling, A.J., Noyes, K.J., Allerhand, M.H., Wright, R.J., Bath, L.E., Deary, I.J., ..., Frier, B.M. (2014). Prevalence of impaired awareness of hypoglycemia and identifi cation of predictive symptoms in children and adolescents with type 1 diabetes. Pediatic Diabetes,15, 206-213. Kovatchev, B., Mendosa, P., Anderson, S., Hawley, J., Ritterband, L., &
Gonder-Frederick, L. (2011). Effect of automated bio-behavioral feedback on the control of type 1 diabetes. Diabetes Care, 34, 302-307.
Luzoro García, J., & Gil Roales-Nieto, J. (1993). Discriminación de niveles de glucosa en sangre en diabéticos insulino-dependientes mediante señales externas y perfi les glucémicos [Discrimination of blood glucose levels in insulin-dependent diabetics using external signals and glycemic profi les]. Psicothema, 5, 45-65.
Marlebi, F.E., & Matos, M.A. (2001). Blood Glucose Discrimination Training: The role of internal and external cues. Journal of Health
Psychology, 6, 229-240.
Martín Vaquero, P., Barquiel Alcalá, B., Puma Duque, M.A., & Lisbona Catalán, A. (2009). Hipoglucemias leves y graves en la diabetes mellitus tipo 1 y 2 [Mild and severe hypoglycemia in type 1 and 2 diabetes mellitus]. Avances en Diabetología, 25, 269-279.
Patterson, C.C., Dahlquist, G.G., Gyürüs, E., Green, A., & Soltész, G. (2009). Incidence trends for childhood type 1 diabetes in Europe during 1989-2003 and predicted new cases 2005-20: A multicentre prospective registration study. The Lancet, 373, 2027-2033.
Ryan, C.M., Dulay, D., Suprasongsin, C., & Becker, D.J. (2002). Detection of symptoms by adolescents and young adults with type 1 diabetes during experimental induction of mild hypoglycemia: Role of hormonal and psychological variables. Diabetes Care, 25, 852-858. Shaw, J.E., Sicree, R.A., & Zimmet, P.Z. (2010). Global estimates of the
prevalence of diabetes for 2010 and 2030. Diabetes Research and
Clinical Practice, 87, 4-14.
Sparacino, G., Facchinetti, A., Zecchin, C., & Cobelli, C. (September, 2013). “Algorithmically Smart” Continuous Glucose Sensor Concept
for Diabetes Monitoring. Paper presented at XIII Mediterranean
Conference on Medical and Biological Engineering and Computing, Seville, Spain.
Wagner, J.A., & Ruggiero, L. (2004). Accuracy of blood glucose estimation by children with diabetes: An investigation of repeated practice with growth curve modeling. Psychological Reports , 94, 371-380. Wild, D., von Maltzahn, R., Brohan, E., Christensen, T., Clauson, P., &
Gonder-Frederick, L. (2007). A critical review of the literature on fear of hypoglycemia in diabetes: Implications for diabetes management and patient education. Patient Education Counseling, 68, 10-15. Ybarra Sagarduy, J.L., & Gil Roales-Nieto, J. (2004). Accuracy in