Leading researchers have tried to discover how to generate, promote and develop interest in learning within and outside of the educational contexts (Hofer, 2010; Renninger & Su, 2012). Krapp, Hidi and Renninger (1992) have identifi ed three different conceptualizations of interest in learning: a dispositional trait, a contextual feature and a psychological state (situational).
Regarding assessment instruments, Hidi and Renninger (2011) indicated a few drawbacks on the usage of self-report questionnaires. Nevertheless, a great number of empirical studies have explored the concept of interest in learning with this type of
assessment tool (Frenzel, Dicke, Pekrun, & Goetz, 2009; Frenzel, Goetz, Pekrun, & Watt, 2010). A large number of self-informed assessment instruments have been used in different academic subjects (Linnenbrink-García et al., 2010; Renninger, Ewen, & Lasher, 2002). Forced-choice and open-ended questions, as well as Likert scales, have also been used. Similarly, the content and the structure of the items have also changed signifi cantly from one assessment instrument to another. However, the item content must be in line with the conceptualization followed by the researchers (Hidi & Renninger, 2011), and it varies from simply asking about the participants’ interest (i.e., “How interested are you in science?”) to questions about complex components of interest in learning (i.e., “How likely is that you will solve the math problems that your teacher has assigned you?”).
The structure of self-reports differs in the number and the frequency of the items used. Ainley and Patrick (2006) argued that even a single item can be enough to identify an individual’s
ISSN 0214 - 9915 CODEN PSOTEG Copyright © 2014 Psicothema www.psicothema.com
Assessment of dispositional and contextual variables in educational
settings: IEPA and AYES scales
José A. Cecchini Estrada, Julio A. González-Pienda, Antonio Méndez-Giménez, Javier Fernández-Río,
Jorge L. Fernández-Losa and Carmen González González-Mesa
Universidad de Oviedo
Abstract
Background: Despite the fact that there are a few instruments designed to measure dispositional and contextual variables in educational contexts, the goal of this study is to elaborate and validate two questionnaires to measure learning interest, effort and progression as dispositional (IEPA)
and contextual (AYEs) variables in secondary education students. Method:
An initial version of both scales was developed. They were reviewed by
a panel of experts and tested on two pilot studies. The fi nal versions were
administered to the described sample and their psychometric properties
were tested. Factor analyses (exploratory and confi rmatory) were
conducted on three sets of data: Mathematics (n = 290), Spanish Language
and Literature (n = 283), and Physical Education (n = 289). Results: Both
fi nal scales had three dimensions with four items in each dimension. All
standardized loads and critical values of t were overwhelmingly positive,
while alpha coeffi cients ranged from .85 to .91. Both scales showed
adequate construct validity, convergent validity, discriminant validity and
concurrent validity. Conclusions: Results showed that these new scales
have adequate psychometric properties, allowing a valid and reliable assessment.
Keywords: Scale validation, learning, secondary education.
Resumen
Evaluación de variables disposicionales y contextuales en el ámbito educativo: escalas IEPA y AYES. Antecedentes: si bien existen en la literatura instrumentos diseñados para evaluar variables disposicionales y
contextuales en ámbitos educativos, la fi nalidad de este estudio es elaborar
y validar dos cuestionarios que permitan medir el interés, el esfuerzo y la progresión en el aprendizaje en el alumnado de Educación Secundaria
como variables disposicionales (IEPA) y contextuales (AYES). Método:
tras elaborar una primera versión, que fue sometida sucesivamente a un juicio de expertos y a dos estudios piloto previos, se comprobaron las
medidas psicométricas de la versión defi nitiva. Se realizaron análisis
factoriales (exploratorios y confi rmatorios) en tres conjuntos de datos:
Matemáticas (n = 290), Lengua Castellana y Literatura (n = 283) y
Educación Física (n = 289). Resultados: las escalas defi nitivas están
compuestas por tres dimensiones de cuatro ítems cada una. Todas las cargas estandarizadas y los valores críticos de t superaron ampliamente
los niveles mínimos recomendados, el coefi ciente alfa osciló entre ,85 y
,91. Ambos cuestionarios mostraron una adecuada validez de constructo, validez convergente, validez discriminante y validez concurrente.
Conclusiones: estos resultados indican que las nuevas escalas poseen adecuadas propiedades psicométricas, lo que permite una evaluación válida y fi able.
Palabras clave: validación de escalas, aprendizaje, Educación Secundaria.
Psicothema 2014, Vol. 26, No. 1, 76-83
doi: 10.7334/psicothema2013.113
Received: April 22, 2013 • Accepted: September 6, 2013 Corresponding author: José A. Cecchini Estrada Facultad de Formación del Profesorado y Educación Universidad de Oviedo
learning interest. However, to be able to understand the relationship between interest and other motivational variables, or the evolution of interest, a set of items provides more relevant information (McHale, Kim, Dotterer, Crouter, & Booth, 2009). Finally, Frenzel et al. (2009) supported the validation of instruments based on the age group due to the conceptual changes observed in their research on teenagers’ interest in mathematics.
Regarding effort, several studies have linked this concept to interest (Renninger, 2003). Effort appears in the scientifi c literature connected to various theoretical frameworks (i.e., theories of motivation, attribution theory, the theory of goal setting, the expectancy theory, the theory of cognitive load), but none of these theories have conceptualized it, which has led to the emergence of different meanings. In the educational context, effort can be seen as a non-cognitive trait that refl ects students’ attitude or enthusiasm toward participation in school work and performance (Kuo-Hsun & Chin-Chun, 2010). Therefore, it seems important to measure students’ effort as one of the factors contributing to achievement in education. However, it has been divided in mental or cognitive effort (Yeo & Neal, 2008) and physical exertion (Guan, Xiang, McBride, & Bruene, 2006).
The structure of self-reports varies depending on the type of effort (mental or physical), but also on the number of items used, the rating scales and their validity. Several studies have used a single-item instrument (Paas, Tuovinen, Tabbers, & Van Gerven, 2003; Yeo & Neal, 2008), and it has been applied, although slightly modifi ed, in educational psychology (Paas et al., 2003; Van Gog & Paas, 2008); particularly, in studies based in the cognitive load theory (Sweller, Ayres, & Kalyuga, 2011). However, these single-item scales are also criticized (Van Gog, Kirschner, Kester, & Paas, 2012). Therefore, to understand the relationship between effort and other motivational variables, it seems more appropriate to use a set of items (Dweck, 1999; Wentzel, 1996; Xiang & Lee, 2002).
Regarding progression in learning, various strategies have been used to assess this concept. Some have focused on the product, whereas others have concentrated on the process of learning (Brown, Campione, Webber, & McGilly, 1992). The most widely used assessment instruments are based on specifi c tests (mathematics, language, etc.) or general tests (values, skills, attitudes, etc.). Among the former, some studies have considered students’ fi nal grades as the sole outcome variable, whereas others included test scores, scales or specifi c tests (De la Fuente, Pichardo, Justicia, & Berbén, 2008; Trautwein & Köller, 2003). Finally, some studies addressed learning in the classroom, while others included homework (Rosário et al., 2011).
Based on the aforementioned, the purpose of this study was to develop two scales which would allow a valid and reliable assessment of contextual and dispositional variables related to learning interest, effort and progression in secondary education students. These two instruments are in line with recent studies that have proposed new models focused on the study of self-regulated learning from an interactive and interdependent perspective of the teaching process (Alonso-Tapia, 2005; Alonso-Tapia & Pardo, 2006; De la Fuente & Justicia, 2007).
Although there are instruments designed to assess dispositional and contextual variables in educational settings, we have developed two scales to overcome some of the limitations detected, and to fulfi l the goals described earlier in the construction process of these instruments. The specifi c limitations detected were: (a)
lack of instruments to measure interest, effort and progression as contextual and dispositional variables of learning; (b) different assessment instruments used in different academic subjects, which does not allow for comparison; (c) inconsistency in item content of some instruments and dimensions; (d) the mismatch, in many cases, of the age group; and (e) the restrictions derived from the number of items used. Therefore, our goals were: (a) to design two scales to measure both contextual and dispositional aspects of learning (De la Fuente & Justicia, 2007; Krapp et al., 1992), while globally analyzing students’ interest, effort and progression in learning; (b) to build useful tools to measure specifi c contexts (Hidi & Renninger, 2006), maintaining a basic structure that could be used in different curricular subjects (Math, Spanish Language and Literature, and Physical Education), (c) to generate age-appropriate questionnaires, in our case, for adolescents (Frenzel et al., 2009); and fi nally, (d) to comprise a limited, but suffi cient, number of items for the instrument to be effective and effi cient.
Method
Participants
A total of 835 secondary education students (1st, 2nd, 3rd and 4th grade of Compulsory Secondary Education [CSE]), randomly selected from 8 different high schools in Asturias, agreed to participate. Data were extracted from three different curricular subjects: Math (MT, n = 290, mean age = 13.55 ± 1.14 years, age range = 12-16), Spanish Language and Literature (LC, n = 283, mean age = 13.53 ± 1.04 years, age range = 12-16), and Physical Education (EF, n = 289, mean age = 13.71 ± 1.12 years, age range = 12-16). Table 1 shows participants’ distribution among the different course levels.
Instruments
The preliminary version of both questionnaires was developed based on the guidelines of previous research (Muñiz, 2005; Morales, Urosa, & White, 2003; Moreno, Martínez, & Muñiz, 2004, 2006; Muñiz, García-Cueto, & Lozano, 2005; Muñiz & Fonseca-Pedrero, 2008). After the review process, an initial set of items was grouped into several dimensions.
The fi rst questionnaire, called IEPA (acronym in Spanish for Interest, Effort and Progression in Learning), aims to evaluate three dispositional variables of student learning (Table 2), and includes the following dimensions: Interest in Learning (i.e., “Learning is interesting and entertaining”), Effort to Learn (i.e., “In try hard to learn”) and Learning Progression (i.e., “I see that I’m getting better”).
The second questionnaire, called AYES (acronym in Spanish for Student Aid), aims to measure three contextual variables related to students’ perceptions of the teaching process, and includes the following dimensions: (a) Raising Interest in Learning (i.e., “The tasks and lessons arouse the students’ interest “), (b) Assistance in Learning (i.e., “The teacher knows how to help us and he/she does it”), and (c) Promotion of Effort Ethics (i.e., “Students’ efforts and participation are rewarded”). Students must respond on a 5-point Likert scale ranging from 1 (strongly disagree) to 5 (strongly agree).
It consists of 21 items, and it was developed to assess people’s ego orientation (8 items), task involvement (8 items), work avoidance
orientation (3 items) and orientation towards cooperation (2 items) in the academic context. Participants are asked to think about when they are most successful in school by means of the stem: “I feel most successful in school when ....” Participants must respond on a 5-point Likert scale ranging from 1 (strongly disagree) to 5 (strongly agree).
All subscales have shown adequate internal consistency in their Spanish versions (Cronbach’s alphas between .70 and .90). In this study, it is expected that motivational orientations will explain a signifi cant amount of the variance of the subscales of both questionnaires, with Task Involvement and Cooperation Orientation explaining the highest percentage.
Procedure
Informed consent was obtained from parents and school principals. Students were told that the questionnaires would be kept anonymous and were given the option to refuse participation or withdraw at any time. All questionnaires were completed under the supervision of a researcher trained for this purpose. The completion of both questionnaires took about 15 minutes.
Data analyses
The initial version included a total of 18 items in each questionnaire: IEPA and AYES (6 items in each sub-scale). To ensure both content validity and the applicability of the instruments, the fi rst versions underwent a triple process:
In order to carry a qualitative assessment of the items (content validity), the opinions of several experts were considered (Osterlind, 1989). Ten outstanding professors from different universities analyzed the adequacy of the items to the dimension assessed in each of the sub-scales using a fi ve-point Likert scale (the fi nal version was reduced to 15 items in each questionnaire, 5 for each sub-scale).
A sample of 1,250 secondary education students participated in a pilot study in order to eliminate the items that were confusing or had errors. One item from each subscale was eliminated, and the rest were used in the following study.
An exploratory factor analysis (EFA) was conducted in a sample of 450 participants (PE, n = 150, MT, n = 150 and LC, n = 150) in a second pilot study. Maximum likelihood with varimax rotation was used as the extraction method. Kaiser-Meyer-Olkin’s measure of sampling adequacy and Bartlett’s sphericity contrast were also calculated. In order to select the fi nal number of factors, an Eigenvalue greater than one was applied, and only factor loadings greater than .40 were considered to assign items to factors.
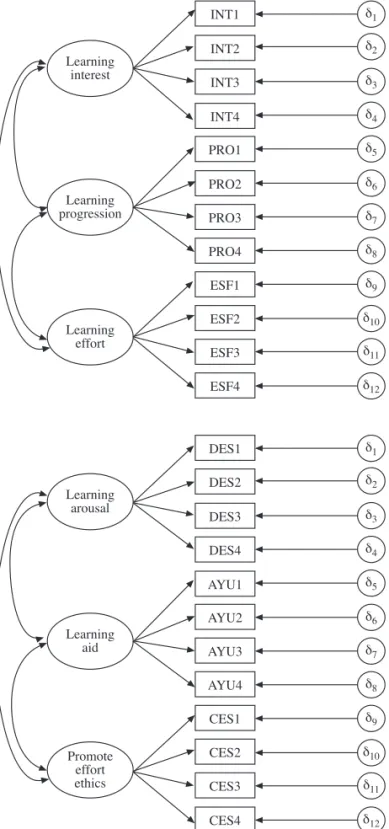
In order to compare the models proposed in the AFE, a confi rmatory factor analysis (CFA) was conducted on both theoretical models (AYES and IEPA). Each one produced three sub-scales or latent factors that, in turn, were determined by four variables or indicators refl ecting the dimensions that are associated with measurement errors (Figure 1). This model was applied separately to each group (Byrne, 2008).
Multivariate normality was also examined, and kurtosis coeffi cients indicated that the samples had a non-normal distribution (Mardia, 1974). Therefore, we used bootstrapping techniques with 1000 resampling bootstraps. The confi dence intervals of regression weights, and the standardized regression weights showed that the Table 2
IEPA and AYES Scales
Learning Interest, Effort and Progression (IEPA)
En las clases de… Matemáticas, Lengua Castellana y Literatura, Educación Física... [In the... Math, Spanish Language and Literature, Physical Education,... class...]
01. El aprendizaje es divertido [Learning is fun] (INT1)
02. Noto que mejora mi nivel [I feel that my skills are improving] (PRO1) 03. Persisto en el intento de mejorar [I keep trying to improve] (ESF1) 04. Lo paso bien aprendiendo [I have fun learning] (INT2)
05. Observo que mejoran mis habilidades en esta asignatura [I think that my skills in this subject are improving] (PRO2)
06. Me esfuerzo por aprender [I try hard to learn] (ESF2)
07. Me divierto aprendiendo habilidades y/o competencias [I have fun learning skills and competences] (INT3)
08. Veo que estoy mejorando [I see that I’m getting better] (PRO3) 09. Me exijo todo lo que puedo [I push myself as much as I can] (ESF3)
10. El aprendizaje es interesante y entretenido [Learning is interesting and entertaining] (INT4) 11. Siento que avanzo [I feel that I improve] (PRO4)
12. Intento superarme [I try to do better] (ESF4)
Student Aid (AYES)
En las clases de… Matemáticas, Lengua Castellana y Literatura, Educación Física... [In the.... Math, Spanish Language and Literature, Physical Education,... class…]
01. Las propuestas son divertidas [Tasks are fun] (DI1)
02. El profesor nos ayuda cuando tenemos problemas para aprender [The teacher helps us when we have diffi culties] (AA1)
03. Se recompensa el esfuerzo y la participación de los estudiantes [Students’ efforts and participation are rewarded] (CE1)
04. Las prácticas son agradables [Tasks are enjoyable] (DI2)
05. El profesor nos guía adecuadamente en el aprendizaje [The teacher guides our learning] (AA2)
06. Se tiene en cuenta el esfuerzo y la constancia del alumnado [Students’ efforts and perseverance are valued] (CE2)
07. Las tareas y lecciones despiertan el interés de los alumnos [The tasks and lessons arouse the student’s interest] (DI3)
08. El profesor sabe cómo ayudarnos y lo hace [The teacher knows how to help us and he/she does it] (AA3)
09. Se valora la participación y el esfuerzo de los estudiantes [Students’ efforts and particiation are valued] (CE3)
10. La oferta de actividades es interesante y sugestiva [Tasks are interesting and appealing] (DI4)
11. El profesor nos enseña a aprender [The teacher teaches us how to learn] (AA4) 12. Se reconoce el esfuerzo del alumnado [Students’ efforts are acknowledged] (CE4)
Table 1
Sample Distribution by Grade-Level and Gender
Gender
Males N (%)
Females N (%)
Grade-level
1st 106 (55.50) 85 (44.50)
2nd 112 (56) 88 (44)
3rd 134 (53.82) 115 (46.18)
4th 114 (59.07) 79 (40.93)
estimated values were signifi cantly different from zero in all scales (Byrne, 1998, Table 1). Consequently, the maximum likelihood (ML) method was used.
As recommended, several indices were used to evaluate the model fi t (Hu & Bentler, 1999): Chi-square statistic (χ2), root mean square residual (SRMR), comparative fi t index (CFI), adjusted goodness of fi t index (AGFI), root mean square error of approximation (RMSEA ) and its 90% confi dence interval. For well-specifi ed models, SRMR values should be less than .08, RMSEA less than .06, CFI values should not be lower than .95, and AGFI values not lower than .90 (Hu & Bentler, 1999).
Convergent validity was determined through the statistical signifi cance of the factor loadings of the indicators for each latent construct. Cronbach’s alpha was calculated to assess reliability of the scores. The minimum value for this coeffi cient to be considered appropriate is .70 (Nunnally, 1978).
In order to test discriminant validity, the square root of the average variance extracted (AVE) was compared with the correlations between constructs (Fornell & Larcker, 1981). This procedure was performed to ensure that the assessed constructs were more closely related to their own observable measures than to other constructs.
To examine whether the model parameters (both questionnaires) remained invariant across the three samples (different curricular subjects), a multigroup analysis (three groups) was conducted. The CFA involved three successive steps: equal factor loadings, equal covariance and equal variances (Byrne, 1998, 2008). Gender invariance was also examined.
Concurrent validity was assessed using six independent regression analyses. In each one, the sub-scales of the AYES IEPA questionnaires were the criterion variables, while the scores of the MOS were the predictor variables. According to previous research, motivational orientations should explain a signifi cant amount of the variance of the six sub-scales (Castillo et al., 2001; Cecchini, González, López-Prado, & Brustad, 2005; Cecchini, González, Méndez-Giménez, & Fernández-Río, 2011).
All analyses were performed using the SPSS 18.0 and Amos 18.0.
Results
Pilot study exploratory factor analysis
Bartlett’s sphericity test (1950) indicated that the items were dependent (p<.001), and the Kaiser-Meyer-Olkin index of sample adequacy was higher than the recommended .50 value (KMO = .92 for the IEPA and KMO = .94 for the AYES). The range of eigenvalues of the factors varied from 8.92 to 1.25 for IEPA, and from 11.97 to 1.52 for AYES, explaining 66.5% and 68.12%, respectively, of the variance.
Confi rmatory factor analysis
In both questionnaires, CFI values ranged between .98 and .99, AGFI between .95 and .96, SRMR between .03 and .05 and RMSEA between .016 and .060. These results exceeded the most demanding conditions in each and every one of the samples (Table 3).
Convergent validity and reliability of the measures
Table 4 shows that all standardized loadings (λ1) and all the critical values of t exceeded the minimum recommended levels of .50 and 1.96 (p<.05) (Hair, Black, Babin, Anderson, & Tatham, 2006), ranging between .69 and .92. All Cronbach’s alpha values were greater than .85.
Discriminant validity
Table 5 shows correlations between the four constructs, and on the diagonal, the AVE square root. These results showed
INT1
INT2
INT3
INT4
PRO1
PRO2
ESF1
DES1
AYU1
CES1 PRO3
PRO4
ESF2
ESF3
ESF4
DES2
DES3
DES4
AYU2
AYU3
AYU4
CES2
CES3
CES4
δ1
δ2
δ3
δ4
δ5
δ6
δ7
δ8
δ9
δ10
δ11
δ12
δ1
δ2
δ3
δ4
δ5
δ6
δ7
δ8
δ9
δ10
δ11
δ12
Learning interest
Learning progression
Learning effort
Learning arousal
Learning aid
Promote effort ethics
discriminant validity among constructs, although all of the constructs are closely related.
Multigroup confi rmatory factor analysis
Depending on the curricular subject (Table 6), AYES showed no signifi cant differences in χ2. Therefore, the model remained invariant. The IEPA showed signifi cant differences in χ2 when
the variances were limited. However, no signifi cant changes were observed in the other variables. As χ2 is sensitive to sample size, the criterion established by Cheung and Rensvold (2002) regarding
ΔCFI was also employed. According to these authors, ΔCFI values less than or equal to -.01 indicate that the null hypothesis of invariance cannot be rejected.
Regarding gender, results showed that the factor structure of both questionnaires also remained invariant.
Table 3
CFA fi t indices in the three samples
Questionnaires Factors Bollen-Stine
bootstrap χ
2 df CFI AGFI SRMR RMSEA
(90% CI)
IEPA Math .110 76.97* 51 .99 .96 .04 .046 [.023, .067]
Spanish Language and Literature .288 75.30* 51 .98 .96 .04 .047 [.021, .069]
Physical Education .121 85.76* 51 .98 .95 .04 .056 [.034 , .076]
AYES Math .739 54.15* 51 .99 .96 .03 .016 [.011, .046]
Spanish Language and Literature .099 95.24** 51 .98 .95 .05 .060 [.041, .080]
Physical Education .383 82.93* 51 .98 .95 .04 .054 [.031, .074]
* p<.05; ** p<.001
Table 4
Standardized loads (λ1), Non-standardized loads (λ2), Standardized Errors (S.E.), Critical Values of t and Cronbach Alphas in both Questionnaires for each Sample
IEPA Math Spanish language and Literature Physical Education
Items λ1 λ2 S.E. t α λ1 λ2 S.E. T α λ1 λ2 S.E. t α
Learning interest
INT1 .81 1.00 – – .89 .85 1.00 – – .88 .69 1.00 – – .86
INT2 .88 1.03 .068 15.133*** .84 1.00 .068 14.670*** .80 1.04 .100 10.445***
INT3 .74 .91 .075 12.078*** .71 .86 .076 11.232*** .80 1.03 .101 10.210***
INT4 .85 1.06 0.72 14.708*** .81 1.00 .074 13.538*** .81 1.09 .104 10.551***
Learning progression
PRO1 .85 1.00 – – .93 .85 1.00 – – .91 .78 1.00 – – .91
PRO2 .83 .99 .061 16.242*** .85 .99 .064 15.512*** .69 1.08 .080 13.598***
PRO3 .92 1.07 .056 19.054*** .86 1.05 .068 15.452*** .86 1.11 .080 13.934***
PRO4 .91 1.12 .060 18.511*** .84 .97 .065 15.012*** .91 1.18 .078 15.108***
Learning effort
ESF1 .74 1.00 – – .87 .74 1.00 – – .85 .74 1.00 – – .81
ESF2 .81 1.15 .096 11.966*** .85 1.07 .091 11.761*** .71 .99 .102 9.719***
ESF3 .79 1.22 .105 11.626*** .74 1.07 .106 10.140*** .72 .96 .102 9.594***
ESF4 .83 1.15 .096 11.926*** .71 .95 .096 9.829*** .73 1.16 .121 9.432***
AYES Math Spanish Language and Literature Physical Education
Learning arousal
DES1 .81 1.00 – – .86 .82 1.00 - - .87 .86 1.00 – – .86
DES2 .84 1.04 .076 13.770*** .77 .92 .077 11.958*** .73 .78 .066 11.843***
DES3 .72 .89 .078 11.467*** .79 .95 .076 12.423*** .78 .87 .065 13.272***
DES4 .78 1.01 .080 12.667*** .80 .94 .075 12.440*** .69 .80 .069 11.558***
Learning aid
AYU1 .82 1.00 – – .91 .82 1.00 – – .90 .79 1.00 - - .87
AYU2 .88 .95 .059 16.013*** .83 .93 .066 13.964*** .82 1.02 .079 12.968***
AYU3 .86 .99 .064 15.583*** .85 .98 .067 14.542*** .83 1.07 .081 13.204***
AYU4 .84 .91 .062 14.818*** .83 .98 .071 13.767*** .73 .88 .079 11.095***
Promote effort ethics
CES1 .76 1.00 – – .91 .77 1.00 – – .91 .75 1.00 – – .90
CES2 .86 1.09 .079 13.872*** .84 1.00 .077 12.977*** .85 1.01 .077 13.149***
CES3 .90 1.13 .062 14.828*** .91 1.08 .075 14.359*** .89 1.11 .080 13.897***
CES4 .85 1.05 .076 13.893*** .88 1.12 .082 13.690*** .86 1.03 .077 13.385***
Concurrent validity
Finally, motivational orientations explained a signifi cant amount of the variance of the 6 subscales, with the Task Involvement and Cooperation Orientation being those accounting for the highest percentages (Table 7).
Discussion
The purpose of this study was to develop two scales which would allow valid and reliable assessment of contextual and dispositional variables related to learning interest, effort and progression in secondary education students.
To achieve this goal, the fi rst objective was to design both scales at the same time. With this goal in mind, two initial questionnaires were designed by selecting a set of items congruent with the dimensions of the different subscales (Heidi & Renninger, 2011; Cecchini, Fernández-Losa, & Cecchini, in press). Items were
refi ned by a group of experts and underwent a pilot study. Factor analyses confi rmed three subscales in each scale (four items each). All standardized loadings greatly exceeded the minimum recommended levels of .50 (Hair et al., 2006). Cronbach’s alpha ranged between .85 and .91. Therefore, the discriminant power of both scales can be considered high. The square root of the AVE exceeds the correlation constructs in all cases (Fornell & Larcker, 1981). These results confi rm that these new scales can be considered valid tools to measure both dispositional and contextual aspects of learning (De la Fuente & Justicia, 2007; Krapp et al., 1992).
The second goal was to build useful tools to measure specifi c educational contexts (Hidi & Renninger, 2006), maintaining a general structure suitable for different curricular subjects. All values obtained were acceptable to measure the same variables in the different subjects: MT, LC and PE. The multigroup AFC exceeded the most demanding conditions. The initial hypothesis that the factor structure of both questionnaires would be invariant regarding subject and gender was also accepted (Rensvold & Cheung, 2002).
Table 5
Square root of the variance (diagonals) and correlations among constructs
Math Spanish Language and Literature Physical Education
Questionnaires Factors 1 2 3 1 2 3 1 2 3
IEPA 1. Learning interest .81 .80 .78
2. Learning progression .51 .88 .62 .85 .70 .95
3. Learning effort .54 .53 .79 .53 .64 .76 .72 .64 .73
AYES 1. Learning arousal .77 .79 .77
2. Learning aid .65 .85 .67 .83 .74 .77
3. Promote effort ethic .55 .72 .84 .66 .76 .85 .71 .81 .84
Table 6
Factorial invariance regarding curricular subject and gender
Curricular subjects
Questionnaire Model χ2 df Δχ2 Δ df AGFI CFI SRMR RMSEA (90% CI] AIC
IEPA Mshape 238.02 153 – – .96 .98 .04 .029 [.022, .036] 400.02
Mload 251.10 171 13/08/13 18 .96 .98 .04 .027 [.019, .033] 377.06
Mcovariance 253.63 177 15.61 24 .96 .98 .05 26 [.018, .032] 367.59
Mvariance 284.27 183 4625* 30 .96 .98 .06 .029 [.022, .035] 397.40
AYES Mshape 232.30 153 – – .96 .98 .04 .028 [.020, .035] 394.34
Mload 250.72 171 18.14 18 .96 .98 .04 .026 [.019, .033] 376.71
Mcovariance 254.17 177 21.87 24 .96 .98 .05 .026 [.018, .032] 368.70
Mvariance 267.11 183 34.81 30 .96 .98 .06 .026 [.019, .033] 369.13
Gender
Questionnaire Model χ2 df Δχ2 Δ df TLI CFI SRMR RMSEA (90% CI) AIC
IEPA Mshape 216.47 102 – – .95 .98 .04 .038 [.031, .045] 324.47
Mload 222.91 111 01/06/44 9 .95 .98 .04 .036 [.029, .043] 312.91
Mcovariance 223.09 114 01/06/62 12 .95 .98 .04 .035 [.028, .043] 307.04
Mvariance 227.05 117 01/10/58 15 .95 .98 .05 .035 [.028, .042] 305.05
AYES Mshape 218.15 102 – – .95 .98 .05 .040 [.033, .048] 326.15
Mload 225.51 111 01/07/36 9 .95 .98 .05 .038 [.031, .045] 315.51
Mcovariance 229.16 114 11/01/13 12 .95 .98 .05 .038 [.031, .045] 313.15
The third goal was to determine whether both scales were age-appropriate (Frenzel et al., 2009); in this case, for teenage students. As in previous works, the 5-point Likert scale responses showed scale suitability to the respondents’ age and also for further statistical validation (Castillo et al., 2001).
The fi nal goal was to obtain a suitable number of items for every scale. The fi nal version of all subscales had a small but adequate number of items. Therefore, all instruments can be considered suitable and effective (McHale et al., 2009; Renninger et al., 2008; Van Gogh et al., 2012). This last feature has overcome some limitations of previous works which used long questionnaires on interest (Ainley & Patrick, 2006) or effort (Sweller et al., 2011; Van Gog & Paas, 2008).
Motivational orientations explained a signifi cant amount of variance of the 6 sub-scales, which is consistent with previous works (Cecchini et al., 2005; Cecchini et al., 2011). Task involvement was associated with the belief that to be successful at school, you have to work, collaborate and cooperate with peers. Moreover,
task-oriented students fi nd academic activities and school more fun, more interesting and less boring (Castillo et al., 2001).
This study has also some limitations. Important variables that could act as extraneous variables and compromise the validity of the results were not assessed. For example, students’ prior performance, skills to manage the contents of each subjects, effi cacy, etc... Therefore, further research should be conducted to address these issues. It would also be interesting to use any of the approaches specifi cally designed to analyze the relationships between students and the environmental context. For example, to use the hierarchical structure of the data and incorporate it into a structural equation model or perform a structural model multilevel regression analysis.
Acknowledgements
Funds for this research project were provided by the Ministry of Economy and Competitiveness of Spain Grant Program I+D+I DEP 2012-31997.
Table 7
Bivariate correlations and regression analyses of both questionnaires with the motivational orientation scale
IEPA AYES
MATH
Interest for learning Learning progression Learning effort Interest arousal in
learning Learning aid Promote effort ethics
r β r β r Β r β r β r β
Ego .11 -.05 .16 .01 .06 -.08 .08 -.10 -.06 -.19* .01 -.05
Task .51*** .50*** .48*** .37*** .58*** .53*** .41*** .43*** .31*** .39*** .27*** .29***
Avoidance -.06 .01 -.01 -.01 -.14** -.07 .03 .09 -.07 .04 -.11 -.06
Cooperation .22*** .03 .36*** .21*** .34*** .14** .21** .05 .11 -.01 .05 -.05
R2 .25*** .25*** .35** .18*** .13*** .08**
SPANISH LANGUAGE AND LITERATURE
Ego .11 -.03 .17** -.01 .04 -.17** -.02 -.15* -.13 -.25** -.06 -.18*
Task .47*** .48*** .53*** .48*** .54*** .54*** .41*** .47*** .33*** .34*** .32*** .34***
Avoidance -.15** -.14** .09 -.09 -.11 -.07 -.11 -.06 -.15** -.07 -.08 -.01
Cooperation .15** -.06 .29*** .08 .28*** .05 .17** .01 .27*** .16* .22*** .10
R2 .23*** .28*** .29*** .21*** .20*** .14***
PHYSICAL EDUCATION
Ego .08 -.05 .07 -.08 .12 .02 -.01 -.11 -.05 -.07 -.01 -.01
Task .40*** .37*** .31*** .32*** .46*** .41*** .39*** .36*** .37*** .31*** .35*** .25***
Avoidance .01 .03 .07 .09 -.06 -.06 -.07 -.01 -.19** -.17* -.17* -.17*
Cooperation .32*** .14 .25*** .08 32*** .12 .37*** .19** .37*** .20** .36*** .22**
R2 .19*** .12*** .24*** .22*** .23*** .20***
* p<.05; ** p<.01; *** p<.001
References
Ainley, M., & Patrick, L. (2006). Measuring self-regulated learning processes through tracking patterns of student interaction with
achievement activities. Educational Psychology Review, 18, 267-286.
Alonso-Tapia, J. (2005). Motivaciones, expectativas y valores-intereses relacionados con el aprendizaje: el cuestionario MEVA [Motives,
expectancies and value-interests related to learning: The MEVA
questionnaire]. Psicothema, 17(3), 404-411.
Alonso-Tapia, J., & Pardo, A. (2006). Assessment of learning environment motivational quality from the point of view of secondary and high
Bartlett, M.S. (1950). Tests of signifi cance in factor analysis. British Journal ofPsychology, 3, 77-85.
Brown, A.L., Campione, J.C., Webber, L.S., & McGilly, K. (1992). Interactive learning environments. A new look at assessment and
instruction. In B.R. Guilford & M.C. O’Cooner (Eds.), Changing
assessment. Alternative views of aptitude, achievement and instruction
(pp. 121-212). Boston, MA: Kluwer A.P.
Byrne, B.M. (1998). Structural equation modeling with LISREL, PRELIS,
and SIMPLIS: Basic applications and programs. Mahwah, NJ: Erlbaum.
Byrne, B.M. (2008). Testing for multigroup equivalence of a measuring
instrument: A walk through the process. Psicothema, 20(4), 872-882.
Castillo, I., Balaguer, I., & Duda, J.L. (2001). Perspectivas de meta de los adolescentes en el contexto académico [Adolescents’ goal perspectives
in academic contexts]. Psicothema, 13(1), 79-86.
Cecchini, J.A., Fernández-Losa, J.L., & Cecchini, C. (in press). La cultura del esfuerzo en las clases de Educación Física [Effort ethics in Physical
Education class]. Cultura y Educación.
Cecchini, J.A., González, C., López-Prado, J., & Brustad, R.J. (2005). Relación del clima motivacional percibido con la orientación de meta, la motivación intrínseca y las opiniones y conductas de fair play [The relationship between perceived motivational climate and goal orientation, intrinsic motivation and fair-play behaviors and
viewpoints]. Revista Mexicana de Psicología, 22, 469-479.
Cecchini, J.A., González, C., Méndez-Giménez, A., & Fernández-Río, J. (2011). Achievement goals, social goals, and motivational regulations
in physical education settings. Psicothema, 23(1), 51-57.
Cheung, G.W., & Rensvold, R.B. (2002). Evaluating goodness-of-fi t
indexes for testing measurement invariance. Structural Equation
Modeling, 9(2), 233-255.
De la Fuente, J., Pichardo, M.C., Justicia, F., & Berbén, A. (2008). Enfoques de aprendizaje, autorregulación y rendimiento en tres universidades europeas [Learning approaches, self-regulation and achievement in
three European universities]. Psicothema, 20(4), 705-711.
De la Fuente, J., & Justicia, F. (2007). The DEDEPRO model of regulated teaching and learning: Recent advances [El modelo DEDEPRO de
enseñanza y aprendizaje regulados. Avances recientes]. Electronical
Journal of Research in Educational Psychology, 13, 5(3), 535-564. Duda, J.L., & Nicholls, J.G. (1992). Dimensions of achievement motivation
in school work and sport. Journal of Educational Psychology, 84,
290-299.
Dweck, C.S. (1999). Self-theories: Their role in motivation, personality,
and development. Philadelphia, PA: Psychology Press.
Fornell, C., & Larcker, D. (1981). Structural equation models with
unobservable variables and measurement error. Journal of Marketing
Research, 18(1), 39-50.
Frenzel, A.C., Dicke, A.L., Pekrun, R., & Goetz, T. (2009). Development
of mathematics interest in adolescence: Quantitative andqualitative insights. Congress of European Association on Learning and Instruction, Amsterdam, The Netherlands.
Frenzel, A., Goetz, T., Pekrun, R, & Watt, H.M.G. (2010). Development of
mathematics interest in adolescence: Infl uences of gender, family, and
school context. Journal of Research on Adolescence, 20(2), 507-537.
Guan, J., Xiang, P., Mcbride, R., & Bruene, A. (2006). Achievement goals, social goals and students’ reported persistence and effort in high
school physical education. Journal of Teaching in Physical Education,
25, 58-74.
Hair, J., Black, B., Babin, B., Anderson, R., & Tatham, R. (2006).
Multivariate data analysis. Upper Saddle River, NJ: Prentice-Hall. Hidi, S., & Renninger, K.A. (2006). The four-phase model of interest
development. Educational Psychologist, 41, 111-127.
Hofer, M. (2010). Adolescents’ development of individual interests: A
product of multiple goal regulation? Educational Psychologist, 45,
149-166.
Hu, L., & Bentler, P.M. (1999). Cutoff criteria for fi t indexes in covariance
structure analysis: Conventional criteria versus new alternatives.
Structural Equation Modeling, 6, 1-55.
Krapp, A., Hidi, S., & Renninger, K.A. (1992). Interest, learning, and
development. In K.A. Renninger, S. Hidi & A. Krapp (Eds.), The role
of interest in learning and development (pp. 3-25). Hillsdale, NJ: Erlbaum.
Kuo-Hsun, M., & Chin-Chun, Y. (2010). Student effort as a noncognitive
trait: The impact of teacher judgment on test performance and school decision. Annual Meeting of the Population Association of America, Princeton, NJ.
Linnenbrink-García, L., Durik, A.M., Conley, A.M., Barron, K.E., Tauer, J.M., Karabenick, S.A., & Harackiewicz, J.M. (2010).
Measuring situational interest in academic domains. Educational and
Psychological Measurement, 70, 647-671.
Mardia, K.V. (1974). Applications of some measures of multivariate skewness and kurtosis in testing normality and robustness studies.
Sankhya, 36, 115-128.
McHale, S.M., Kim, J.Y., Dotterer, A., Crouter, A.C., & Booth, A. (2009). The development of gendered interests and personality qualities from
middle childhood through adolescence: A bio-social analysis. Child
Development, 80, 482-495.
Morales, P., Urosa B., & Blanco, A. (2003). Construcción de escalas de
actitudes tipo Likert [Construction of Likert-type attitude scales]. Madrid: La Muralla.
Moreno, R., Martínez, R.J., & Muñiz, J. (2004). Directrices para la construcción de ítems de elección múltiple [Guidelines for the
construction of multiple choice test ítems]. Psicothema, 16(3),
490-497.
Moreno, R., Martínez, R., & Muñiz, J. (2006). New guidelines for
developing multiple-choice items. Methodology, 2, 65-72.
Muñiz, J. (2005). Utilización de los tests [Tests usage]. In J. Muñiz, A.M.
Fidalgo, E. García-Cueto, R. Martínez & R. Moreno (Eds.), Análisis
de los ítems, [Item analysis] (pp. 133-172). Madrid: La Muralla. Muñiz, J., & Fonseca-Pedrero, E. (2008). Construcción de instrumentos de
medida para la evaluación universitaria [Construction of assessment
instruments for higher education]. Revista de Investigación en
Educación, 5, 13-25.
Muñiz, J., García-Cueto, E., & Lozano, L.M. (2005). Item format and the psychometric properties of the Eysenck Personality Questionnaire.
Personality and Individual Differences, 38, 61-69.
Nunnally, J.C. (1978). Psychometric theory. New York: McGraw-Hill.
Osterlind, S.J. (1989). Constructing test items. London: Kluwer.
Paas, F., Tuovinen, J.E., Tabbers, H., & Van Gerven, P.W.M. (2003). Cognitive load measurement as a means to advance cognitive load
theory. Educational Psychologist, 38, 63-71.
Renninger, K.A. (2003). Effort and interest. In J. Gutherie (Ed.),
The encyclopedia of education (2ª ed., pp. 704-707). New York: Macmillan.
Renninger, K.A., Bachrach, J.E., & Posey, S.K.E. (2008). Learner interest and achievement motivation. In M.L. Maehr, S. Karabenick, & T.
Urdan (Eds.), Social psychological perspectives Volume 15: Advances
in motivation and achievement. (pp. 461-491). Bingley, UK: Emerald. Renninger, K.A., Ewen, E., & Lasher, A.K. (2002). Individual interest as
context in expository text and mathematical word problems. Learning
and Instruction, 12, 467-491.
Renninger, K.A. & Hidi, S. (2011). Revisiting the conceptualization,
measurement, and generation of interest. Educational Psychologist,
46(3),168-184.
Renninger, K.A., & Su, S. (2012). Interest and its development. In R.
Ryan (Ed.), Oxford handbook of motivation (pp. 167-187). New York:
Oxford University Press.
Rosário, P., Lourenço, A., Paiva, O., Rodrigues, A., Valle, A., & Tuero-Herrero, E. (2012). Predicción del rendimiento en matemáticas: efecto de variables personales, socioeducativas y del contexto escolar [Prediction of Mathematics achievement: Effect of personal,
socioeducational and contextual variables]. Psicothema, 24(2),
289-295.
Sweller, J., Ayres, P., & Kalyuga, S. (2011). Cognitive load theory. New
York: Springer.
Trautwein, U., & Köller, O. (2003). The relationship between homework
and achievement-still much of a mystery. Educational Psychology
Review, 15, 115-145.
Van Gog, T., & Paas, F. (2008). Instructional effi ciency: Revisiting the
original construct in educational research. Educational Psychologist,
43, 16-26.
Van Gog, T., Kirschner, F., Kester, L., & Paas, F. (2012). Timing and frequency of mental effort measurement: Evidence in favour of
repeated measures. Applied Cognitive Psychology, 26(6), 833-839.
Wentzel, K.R. (1996). Social and academic motivation in middle school:
Concurrent and long-term relations to academic effort. Journal of
Early Adolescence, 16, 390-406.
Xiang, P., & Lee, A. (2002). Achievement goals, perceived motivational
climate and students’ self-reported mastery behaviours. Research
Quarterly for Exercise and Sport, 73, 58-65.
Yeo, G., & Neal, A. (2008). Subjective cognitive effort: A model of states,