Building monitoring during the partial implosion stage
J. Garcés1, J.C. Botero1, D. Murià-Vila2(1) Universidad EAFIT - Colombia, (2) Instituto de Ingeniería- UNAM – México
Abstract
The partial collapse of a building in Colombia caused severe damage to its structural components. An implosion was realized to induce the collapse of 50% of the deteriorated building. To evaluate the influence of the implosion on the remaining structure, a monitoring survey was realized using triaxial accelerometers. Time signals associated with ambient, seismic and forced vibration were obtained. A study of the records in the time and the frequency domain was made. The analysis of the information allowed determining some structural properties that were useful to calibrate the analytical model of the structure.
1. Introduction
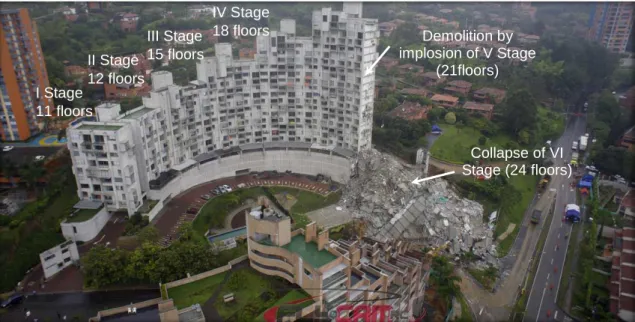
On October 12, 2013 the SPACE building located in Medellin city, Colombia, suffered a partial collapse of the VI stage that caused damages in the rest of the building (Figure 1). Those damages affected notably the stage V; therefore its demolition was necessary and was done on Thursday February 27 2014 at 13:52 UTC hours, through an implosion process. EAFIT University performed the monitoring survey of the remaining four (4) towers in order to register their behavior and to obtain the dynamic properties of the structure through a period of thirty (30) days after the implosion.
Figure 1. SPACE building after collapse of VI stage
During the monitoring survey, tests of ambient vibration were done before and after the V stage implosion process. Furthermore, the signals produced during the implosion of V stage were registered as well as a seismic event of low intensity that occurred during the monitoring of the previous implosion.
Collapse of VI Stage (24 floors) Demolition by
implosion of V Stage (21floors) I Stage
11 floors
II Stage 12 floors
III Stage 15 floors
After the analysis of the signals the results on the time domain and frequency were presented. The dominant frequencies before, during and after the implosion were also evaluated. Moreover, the structure was modeled using a commercial program system in order to find a correlation with the dynamic properties of the building. The building was demolished in its entirety on September 23, 2014 by Government order.
2. Building and instrumentation description
Building SPACE was built in a phased manner, each of the phases with a variable height (Figure 1) and was intended for residential use. Among the different phases there were not construction joints. Its structure had elevation and structural plan irregularities. The plant configuration was radial and it height varied between 11 and 24 floors (31 m and 67 m respectively). In addition, there were three (3) parking basements. The structure corresponds an structural breached system consisting of beams and columns. The slabs were vaulted with varied thickness between 6 and 30 cm. The specified resistance of the concrete for the structural elements was 21 MPa and the yield stress of the steel was 420 MPa. The foundation structure was designed using deep piles. The self-weight of the building with finishing touch and partitions was estimated at 6 kN/m2. During the monitoring survey stage, the building was not occupied, therefore the live load was null.
The building was instrumented in strategic locations of the structure in order to register the main movement amplitudes produced during the monitoring phase. Six New Zealand (CUSP) manufactured triaxial accelerometers were used located as shown in Figure 2. The accelerometers used were connected to a central recorder through conventional Ethernet cables.
The central recorder was connected to the net in order to allow the remote monitoring of the building. The accelerometers used have a 200 Hz sampling frequency with a precision of 0.0001 percent of the gravity value. These sensors have the capacity to record events with accelerations of less than four (4) times the gravity value ( ).
Figure2. Location and orientation of the accelerometers in the SPACE building
2.1. Event chronology
The continuous structural monitoring project began in February 5, 2014 and ended in March 6 of the same year. During this period a seismic event was registered and four ambient vibration tests were performed. Additionally, the implosion process of stage V and the debris controlled demolition was registered. The chronology of events is described as follows:
DATE NAME EVENT
Saturday October 12, 2013 Stage VI of the building was not instrumented building SPACE collapsed. The
Wednesday, February 5, 2014
Installation of monitoring equipment (SIX SENSORS and one registrar). The continuous monitoring accelerations process of the building began
Thursday, February 13, 2014 VA01 Ambient vibrations of this day were selected to be analyzed (11:00 UTC)
Monday, February 17, 2014 SI01
The earthquake in Tame, Arauca took place. It was an event of 5.3 magnitude with a depth of 42.6 km as reported by the Colombian Geological Service. The distance between the building and the source was 420 km, approximately (9:41 UTC)
Tuesday, February 25, 2014 VA02 Ambient vibrations of this day were selected to be analyzed (11:00 UTC)
Thursday, February 27, 2014 VF01
The implosion process of V stage was realized. Several slab fragments were hanging and attached to the IV stage (13:52 UTC)
Friday, February 28, 2014 VA03 Ambient vibrations of this day were selected to be analyzed (11:00 UTC)
Monday, March3, 2014 VF02
A controlled demolition of slabs fragments that were attached to IV stage after the implosion of V stage was performed (13:30 UTC)
Wednesday, March 5, 2014 VA04 Ambient vibrations of this day were selected to be
analyzed (11:00 UTC)
Thursday, March 6, 2014 The process of monitoring and permanent register
finished
4. Model of the structure
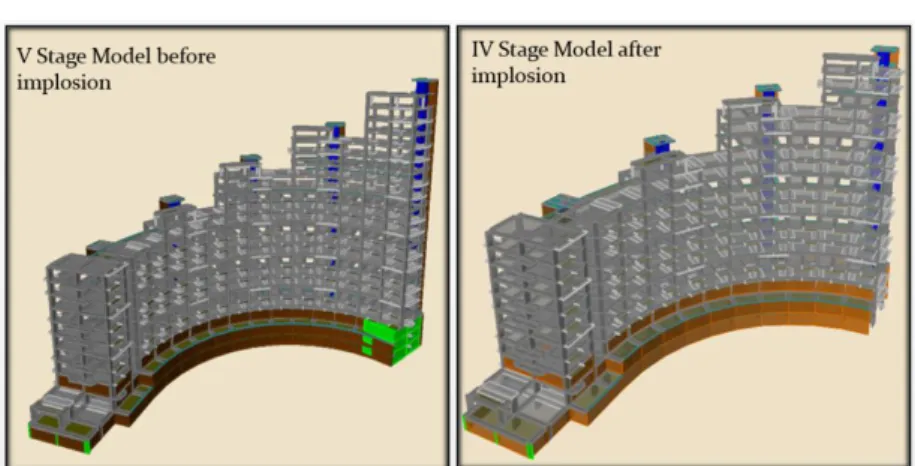
Figure3. Three-dimensional model before and after the implosion
The frequencies identified in the analytical model (Finite element software) before the implosion were 0.60, 0.73, 1.11, 1.63, 1.89 and 2.36 Hz. Frequencies corresponding to 1.11 and 2.36 Hz belong to the torsional/rotational mode.
After the implosion, the structure loses V stage and the model (Finite element software) reflects this fact. The frequencies identified in this case were 0.68, 0.81, 1.19, 1.89, 2.22 and 2.62 Hz. Frequencies corresponding to 1.19 and 2.62 Hz belong to the torsional/rotational mode.
5. Results of structural monitoring - Time domain
None of the ambient vibration events (VA01, VA02, VA03 and VA04) registered accelerations higher to 0.05 cm/s2. The seismic event registered (SI01) had a duration of 20 s and the maximum accelerations registered at the top of the building did not exceed 2 cm/s2 accelerations. In the basement the acceleration values were close to 0.2 cm/s2. The maximum accelerations registered in the event of implosion (VF01) are shown in Table 1. The duration of the event was 10 seconds, approximately.
Table 1. Maximum acceleration values registered during the implosion of the V stage building SPACE
Sensor Location Acceleration X (cm/s2)*
Acceleration Y (cm/s2)*
Acceleration Z (cm/s2)*
20507 9th Floor 85 130 115
20508 11th Floor 110 185 200
20510 14th Floor 135 420 365
20511 17th Floor 345 890 1200
20700 2nd Basement 15 15 15
20701 2nd Basement 95 35 50
Having obtained the relative accelerations the logs were numerically integrated to obtain the structure shifts. Table 2 shows the maximum values of relative displacements to the based that were obtained.
Table 2. Maximum relative displacement values obtained
Sensor Location Displacement X (cm)
Displacement Y (cm)
20507 9th Floor 1.5 1.5
20508 11th Floor 4.5 3.0
20510 14th Floor 7.0 8.5
20511 17th Floor 12.0 15.0
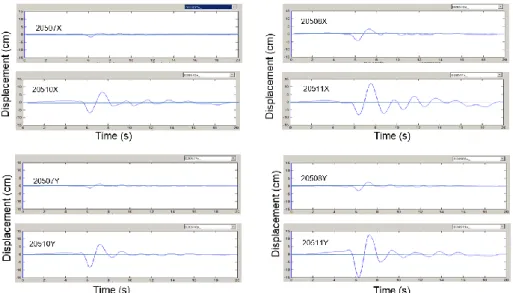
In Figure 4 the historical relative displacements to the structure base, produced by the implosion are shown. It is noteworthy that some initial displacements are seen before the implosion, which are the result of the signals numerical integration process and also suggests a possible rotation of the building at the base due to the implosion.
Figure4. Relative displacements registered obtained for the X and Y axes on the implosion event (VF01)
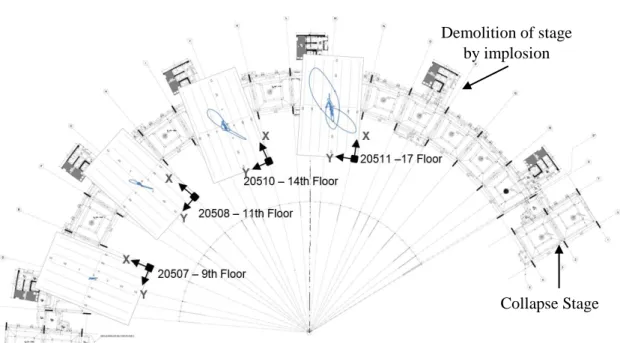
Figure5. Horizontal path journeys made by the spots where sensors were placed
After the implosion several slabs of stage V were hanging and attached to stage IV, so it was necessary to perform a process of controlled demolition (VF02). This stage records show that the amplitudes at the top of the structure varied between 600 cm/s2 (Sensor 20511) and 60 cm/s2 (Sensor 20507); in the basement (Sensor 20701) acceleration values did not exceed 20 cm/s2.
6. Results of structural monitoring - Frequency Domain
The analysis in the frequency domain was done using spectral analysis procedures (Bendat and Piersol, 2000), which helped identify the structure vibration frequencies. Figures 6 to 11 show the average Fourier spectra associated to the plant directions X and that were obtained on the building rooftops where the sensors were placed for the studied events.
Figure 6. Average Fourier spectra from the ambient vibration test VA01 Collapse Stage Demolition of stage
by implosion
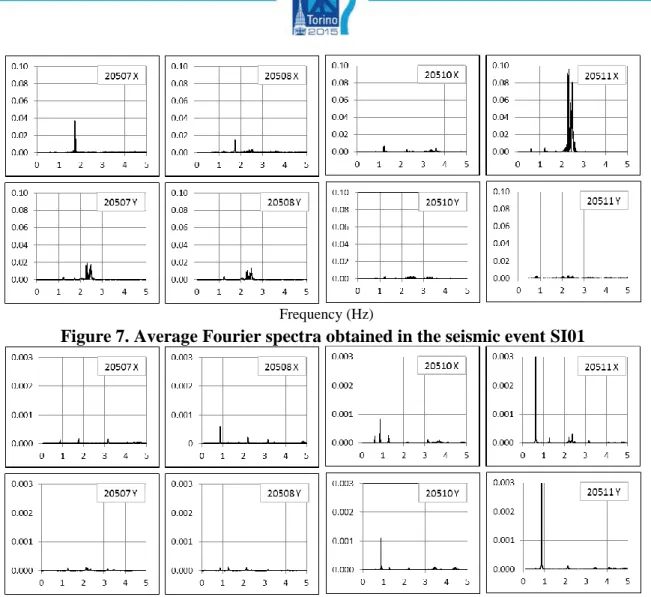
Figure 7. Average Fourier spectra obtained in the seismic event SI01
Figure 8. Average Fourier spectra from the ambient vibration test VA02
Figures 6 to 9 correspond to events prior to the implosion. It was determined that the frequencies associated with the first mode were close to 0.62 and 0.87 Hz, for the X and Y directions respectively. For the second mode values near 1.28 and 1.77 Hz for the X and Y directions respectively were obtained.
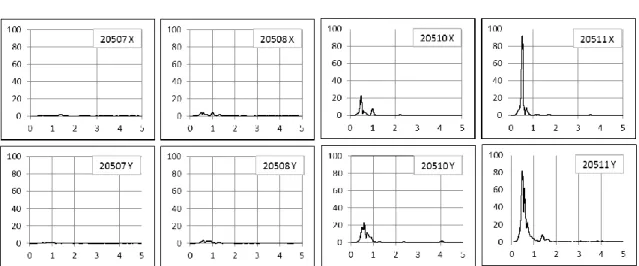
Figure 9 shows Fourier spectra associated with the implosion of stage V. In this case it was observed that the frequencies associated with the first mode were equal to 0.51 and 0.69 Hz, for the X and Y directions respectively. Values of 1.00 and 1.40 Hz for the second mode were obtained for the X and Y directions respectively. The variation of these frequencies compared to previous cases obeys to nonlinear changes occurred due to the loss of mass and stiffness at the implosion and due to the increased levels of acceleration. Similar results have been reported by (Murià-Vila, 2007).
Figure 9. Average Fourier spectra obtained from the registers during the implosion VF01
After the implosion an ambient vibration test (VA03) was performed. For this new structure frequencies associated with the first mode close to 0.74 and 0.99 Hz, for the X and Y directions respectively were obtained. For the second mode frequencies for the X and Y directions respectively were close to 1.40 and 1.79 Hz.
Figure 10. Average Fourier spectra from the ambient vibration test VA0
Forced vibration test associated to the controlled demolition of the slabs that were hanging after the implosion (VF02) shows variations in the frequency due to the explosive charges and to the collapse of stage V. For this case frequencies associated to the first mode were obtained equal to 0.63 and 0.82 Hz, for the X and Y directions respectively. For the second mode the obtained frequencies were close to 1.23 and 1.59 Hz, for X and Y directions respectively.
Figure 11. Average Fourier spectra calculated from the registers obtained during the demolition of the slabs attached in the IV Stage IV VF02
Figure 12. Average Fourier spectra from the ambient vibration test VA04
The final ambient vibration test (VA04) was performed after the controlled demolition and the same frequencies reported in the case VA03 were obtained.
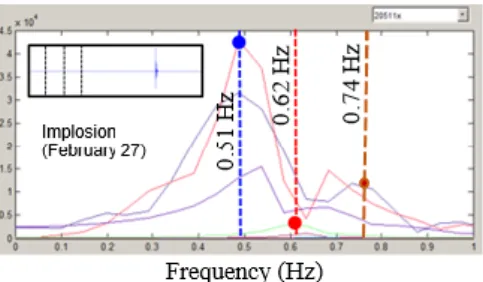
An important aspect that was observed during implosion corresponds to the variation of the fundamental frequency in the X direction. Before the implosion, the first mode frequency had a value of 0.62 Hz. During the implosion this value decreased to 0.51 Hz and after the implosion the frequency stepped to 0.74 Hz. This change is shown in Figure 13 where Fourier spectrums are illustrated in sections. A record of 30 minutes was taken and windows of 20 s, approximately were generated. This allowed seeing the frequency evolution during the implosion of stage V.
Figure 13. Average Fourier spectra by tranches during the process of implosion and demolition
7. Comparison of dynamic properties obtained from the mathematical model to the recorded in the monitoring process.
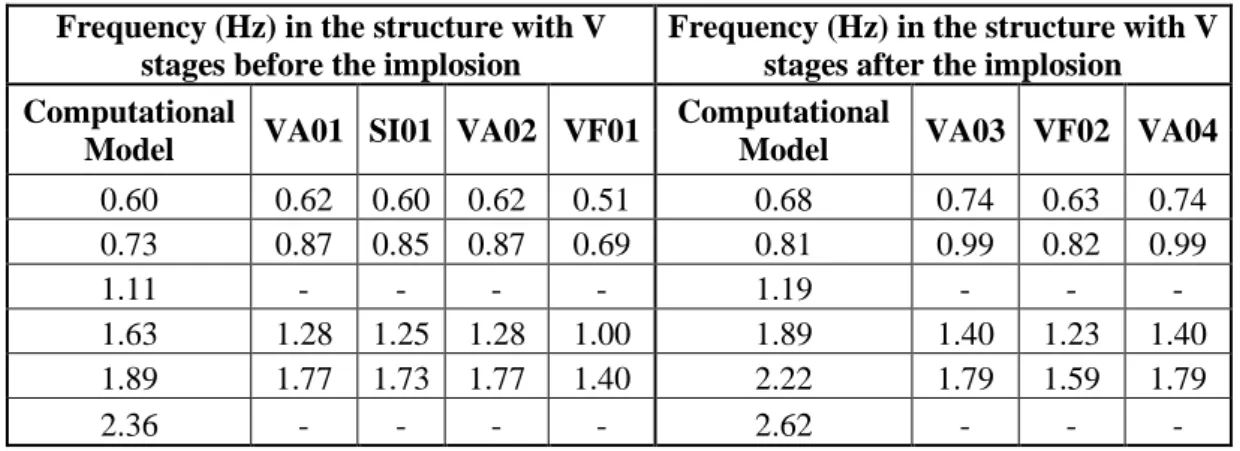
Table 3 shows the frequencies in computational model (ETABS 2013 V 13.2.2) considering the structure before and after the implosion and the ones obtained from the spectral analysis in the monitoring stage.
Table 3. Comparative value of obtained frequencies
Frequency (Hz) in the structure with V stages before the implosion
Frequency (Hz) in the structure with V stages after the implosion Computational
Model VA01 SI01 VA02 VF01
Computational
Model VA03 VF02 VA04
0.60 0.62 0.60 0.62 0.51 0.68 0.74 0.63 0.74
0.73 0.87 0.85 0.87 0.69 0.81 0.99 0.82 0.99
1.11 - - - - 1.19 - - -
1.63 1.28 1.25 1.28 1.00 1.89 1.40 1.23 1.40
1.89 1.77 1.73 1.77 1.40 2.22 1.79 1.59 1.79
2.36 - - - - 2.62 - - -
Analytical and experimental results obtained happen to be consistent and coherent.
8. Acknowledgment
The work reported herein is the result of a project developed by the Universidad EAFIT for the CDO company in Medellín, Colombia. The authors thank to CDO company, permission to publish the results and the Universidad EAFIT for the support given to the project.
9. Conclusions
The Structural monitoring of the partially collapsed building was performed. Logs of ambient vibration (VA01, VA02, VA03 and VA04), forced vibration were resulted from partial implosion of stage V and subsequent controlled demolition of attached slabs (VF01 and VF02) were obtained, and a log of a seismic event occurred during the period of monitoring was also registered. A finite element model (ETABS 2013 V 13.2.2) that represents the physical and mechanical conditions of the studied building was set and a spectral analysis of the signals obtained was performed. The Analytical and experimental results obtained happen to be similar among them for the first two modes associated with the orthogonal directions X and Y.
REFERENCES
BENDAT J.S. Y PIERSOL A.G.(2000)“RANDOM DATA.ANALYSIS AND MEASUREMENT PROCEDURES”,
JOHN WILEY &SONS,THIRD EDITION.