DOES HIGH SPEED RAIL COMPETE FAIRLY
WITH OTHER TRANSPORTATION MODES?
MADRID-BARCELONA CASE STUDY
Mariano Petrazzuolo – Department of Transportation Engineering - University of Naples Federico II
Alejandro Ortega - TRANSyT – Technical University of Madrid
Francesca Pagliara - Department of Transportation Engineering – University of Naples Federico II
José Manuel Vassallo - TRANSyT – Technical University of Madrid
ABSTRACT
Transportation modes produce many external costs such as congestion, accidents, and environmental impacts (pollution, noise and so on). From the microeconomic theory it is well known that in order to maximize social welfare, transportation modes should internalize the marginal costs they produce. Allocative efficiency is achieved when all transportation modes are priced at their social marginal cost.
The objective of this research is to evaluate to what extent different passenger transport modes internalize their social marginal costs. This analysis is important since it affects the competitiveness of the different transport modes for a given OD pair. The case study analyzed is the corridor Madrid-Barcelona in Spain and the different transport modes have been considered (cars, buses, high-speed train and air).
The research calculates the marginal social cost per user for each transportation mode, and it compares it with the average fare—allowing for the effect of discriminatory taxes—currently paid by the users. The external costs are calculated according to the guidelines established by the European Union. The gap between the marginal social cost and the price paid by users will provide the extra cost per passenger that each transport mode should have to pay for internalizing the external cost it produces.
The results of this work might be of help for European policy actions to be undertaken in the future.
Keywords: transport externalities, transport modes, fairness competition, High Speed Rail, Madrid-Barcelona corridor
1. Introduction
The present study aims to evaluate the transport costs of one of the most important European corridors: the Madrid-Barcelona corridor. Through a Benefit-Cost Analysis it will be possible to assess to what extent different transport modes internalize their external costs and the price that the marginal user would pay in terms of taxes and fees.
The issue involves the policies adopted by the European Union(EU) in the transport sector. The current situation of transport costs is inevitably the result of European legislation and the one of individual Member States. For this reason it is interesting to understand what the address of the policies implemented to date was and what effects they have generated. It should also assess whether the policies have been oriented in the direction of social welfare maximization. Within this framework the problem of the evaluation of externalities is analyzed. In fact, over the years there have been many studies and methodologies for the calculation of the external costs of transport modes. If we consider them as a whole, as done by Quinet (2004), we see that the results are highly variable and not able to allow a uniform evaluation. This is the reason that fostered the European Union (EU) to turn the University of Delft in order to develop a methodology valid for all the Member Countries.
After a general overview of the problem, we explored the theme through the case study of the Madrid-Barcelona corridor. In this paper, we focus our attention on passenger across all modes of transport available: High Speed Rail (HSR), Air, Car and Bus.
The internalization of external costs is a necessity if the objective is to maximize the social welfare in terms of economy and ensure a fair competition among different transport modes. The costs incurred by different modes of transport are influenced by the regulations in the country under study. For this reason, this work starts from an analysis of the legislation in force in Europe, from its evolution in the field of transport and the way in which Spain has transposed and implemented these regulations.
The methodology of this research is based on a similar research study conducted previously by the transport research center TRANSyT of the Technical University of Madrid (Vassallo, Solís García; Pérez-Martínez and Pérez de Villar, 2005). They developed an economic balance of external costs vs. users’ fees for different freight transport modes in Spain.
The objective of this paper is to determine, taking into account the case study of the Madrid-Barcelona corridor, to what extent passenger transport modes internalize the external costs they produce. This paper is organised as follows. In section 2 a description of the state-of-the art on the internalization of external costs is reported. In section 3 we describe the methodology adopted. In section 4 the case study of the Madrid-Barcelona corridor is presented. In section 5 conclusions and further perspectives are highlighted.
2. Internalization of external costs for transport modes in Europe
Microeconomic theories state that the internalization of the external costs produced by different transport modes is a need to maximise social welfare (Pigou, 1920). The European Union has progressively moved towards this approach, particularly regarding heavy goods vehicles.
Since 1971 the European Union has been trying to establish a policy on pricing infrastructure use. However, the strong opposition from some member states and road haulers to this policy stopped its progress for a long time (Vassallo, 2001). In 1998, the European Commission came back with the publication of the White Paper entitled “Fair payment for infrastructure use: A phased approach to a common transport infrastructure charging framework strategy in the European Union” (European Commission, 1998). This paper recommended that the member states should carry out a progressive harmonization of fee-charging principles for all the commercial transport modes by proposing an approach based on the “user-pay” principle. Even though many of the objectives of the White Paper were not fully met due to the opposition of the member states, its publication brought some changes in the legislation. The Directive 1999/62 on “The Charging of Heavy Goods Vehicles for the Use of Certain Infrastructures (known as “Eurovignette” Directive)” passed a short time later. However, this Directive did not represent a great advance. Its main contribution was the implementation of a minimum tax rate on the ownership of those vehicles that had an authorized maximum gross laden weight of over 12 tones. This Directive also established that trucks should not be subject to fees in addition to whatever tolls they had to pay on toll-roads.
Commission’s intention of proposing a Directive on charging fees for the use of road infrastructure. From 2001 onwards, the European Union has shown a much greater interest in facing the internalization of the external costs produced by transport. With this objective, the first question of the EU has been that of calculating the external costs of different transport modes. During the last few years, several studies and methodologies have been proposed for computing such costs. However, Quinet (2004) shows that the results from different studies are substantially different. Consequently, no consensus seems to exist among the scientific community regarding the quantification of such cost.
In order to have a set of guidelines to quantify the external costs of transport, the European Union asked the University of Delft to develop a computation methodology that might be applied to all the member states (Maibach et al., 2008). These guidelines focussed its attention on freight transport since the European Commission was not concerned about pricing interurban passengers transport modes.
The mid-term review of the White Paper conducted in 2006 (European Commission, 2006) paid special attention to the possibility of modifying upward fee-charges in environmentally sensitive locations and urban areas.
The next legislative advance in infrastructure fee-charging policy in the European Union was the approval of the Directive 2006/38/EC amending Directive 1999/62/EC on the charging of heavy goods vehicles for the use of certain infrastructure. The Directive established that such fee-charges were to be applied in all the EU countries to commercial vehicles over 3.5 tonnes in the Trans European Transport Network and roads to which traffic could be diverted by 2012. However, the member states could exempt trucks below 12 tons from such payment if such fees create significant adverse effects or transaction costs were higher than 30% of the revenues produced. Member states were free to impose fees for the use of the roads other than the trans-European Networks. Charges could be implemented depending on distance, location of the road, damage to the pavement, EURO classification of the vehicle, time of the day, and congestion on the road. Revenues from HGV charges should be used for the maintenance of the infrastructure concerned and for the transport sector as a whole, in order to promote sustainable development of transport networks. The Directive sat up the principles to charge fees to HGVs, but it did not establish the specific minimum charge to be applied. In this respect the Directive entrusted the European Commission with the mandate to present, no later than June 2008, a “generally applicable, transparent and comprehensible model” for the assessment of all external costs, a model which is intended to serve as the basis for future calculations of infrastructure charges. Owing to this, the Commission entrusted to a group of universities and research institutes the task of producing a guide to assess external transportation costs. At the time of writing this paper, a draft of this guide had already been completed but the final version of the document was not yet available. Regarding discriminatory fuel taxes, the Directive says that any future decision on setting up charges should take full account of the tax burden already borne by road haulage companies, including vehicle taxes and fuel excise duties.
freedom to travel. In this sense, one of the most important goals is moving towards full application of “user pays” and “polluter pays” principles and private sector engagement to eliminate distortions, including harmful subsidies, generate revenues and ensure financing for future transport investments. It is also very important to note that the Commission has a long-term goal of charging for the use of the road to all vehicles and across the network, reflecting the minimum cost of maintenance of infrastructure, congestion, air pollution and noise pollution. Besides, the internalisation of externalities, the elimination of tax distortions and unjustified subsidies and free and undistorted competition are therefore part of the effort to align market choices with sustainability needs.
Finally, the latest legislative advance is the approval of the Directive 2011/76/EC amending Directive 1999/62/EC, and it includes some news with respect to the previous one. Firstly, a new charge, called “external – cost charge” is included. The purpose of this charge is to recover the cost incurred due to traffic-based air pollution and/or traffic-based noise pollution. So the new final charge is divided into two charges: external – cost charge and the previous infrastructure charge. Secondly, the member states must vary the infrastructure charge depending on the EURO classification of the vehicle, whereas in the earlier Directive 2006/38/EC they could vary this infrastructure charge. The latest addition introduced is concerning the revenues from the HGV charges. It is recommended that the revenues are used for the maintenance of the infrastructure concerned and for the transport sector as a whole, while before it was obligatory.
Several aspects of the Directive draw our attention to the implementation of the infrastructure fee-charging policy in the European Union. First, while the initial steps towards the implementation of this policy considered all transportation modes, including private cars and coaches for the road, Directive 2011/76/EC talks only about Heavy Goods Vehicles, leaving aside other transport modes such as rail, air, and maritime transportation, as well as other vehicles such as cars and coaches. This omission seems to work against allocative efficiency and modal fairness. Second, the Directive does not say anything about the application of subsidies to other transport modes, as happens with railroads in many European Countries.
3. Methodology to assess the internalization of external costs
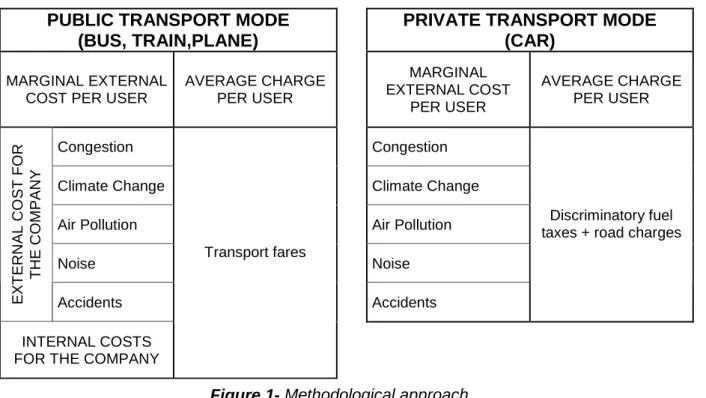
The methodology traditionally used to assess whether the external costs produced by a transport mode are internalized or not consists of comparing the external marginal cost produced with the infrastructure charges paid by each transport vehicle (car, bus, train, plane and so on). This approach assumes that each transport mode covers all their internal costs or in other words, that the transport mode is not subsidized. If a transport mode was subsidized, subsidies would have to be subtracted from the charge side of the economic balance.
personal time. Other costs, regardless they are or are not external for the transport operator, are not directly paid by the users so they are external costs for the users. However, in exchange for the service provided, the user has to pay a user fare to the public transport company. Consequently, in order to estimate whether external costs are internalized or not for public transport modes, we are going to compare the external cost attributed to the user with the fare the users pay.
Taxes are considered costs for this analysis—the costs of funding the public sector—as long as taxes are not discriminatory. For instance, income taxes or added value taxes are not discriminatory since they are equitably implemented over all transport modes. However, fuel taxes are discriminatory since, at least in Spain and in many other European countries, they are applied only to the fuel used by road vehicles, but neither to the fuel nor to any other energy source used by railways, planes or vessels. As a consequence of that, we consider that discriminatory taxes are a hidden charge applied to road vehicles (car and buses).
Unlike public transportation users, private car users pay most of the transport operation costs they produce: fuel, tolls, depreciation, repairs and so on. In this case, the user of the service covers the vehicle cost. Therefore all the investment, maintenance and management costs, including the fuel, are internal as they are paid by the user of the service itself. The only costs which can be considered external are the costs the users do not pay: pollution, noise, congestion, climate change and accidents. In the case of the CAR mode, external costs are internalised by paying taxes, specifically fuel taxes. For this reason we compare the external cost cars produce with the hidden charges that cars pay because of the existence of discriminatory fuel taxes.
PUBLIC TRANSPORT MODE
(BUS, TRAIN,PLANE)
PRIVATE TRANSPORT MODE (CAR)
MARGINAL EXTERNAL COST PER USER
AVERAGE CHARGE PER USER MARGINAL EXTERNAL COST PER USER AVERAGE CHARGE PER USER
Congestion Congestion
Climate Change Climate Change
Air Pollution Air Pollution
Noise Noise
E X T E R N A L C O S T F O R T H E C O M P A N Y
Accidents Accidents
Discriminatory fuel taxes + road charges
INTERNAL COSTS FOR THE COMPANY
Transport fares
4. The case study of the Madrid-barcelona corridor
We apply the method described above for the Madrid-Barcelona corridor case study (shown in yellow in Fig. 2). Four ways to compete within this source-destination pair: car, bus, train and plane.
Figure 2 - HSR Network in Spain. Year 2010
In Spain there are about 22 million cars for a resident population of approximately 49 million inhabitants in the year 2009 (INE, 2009). This represents the 71.25% of the total vehicles in Spanish roads.
Bearing in mind that the metropolitan areas of Madrid and Barcelona, together reach about 10 millions people, which means that there are about 5 millions private vehicles present only in the two metropolitan areas, and along the corridor there are important centers of attraction as the city of Zaragoza.
This explains why even though it is well served by other modes of transport (such as PLANE, HSR), the corridor undergoes a prevalence of CAR.
The purpose for which we analyze the AIR mode in this work is because its market share is second respect to CAR’s. It is composed mainly of people who work and need to move between Madrid and Barcelona taking advantage of the high frequency guaranteed by the transport plane Iberia (airline Spanish).
Iberia has been major carrier in this route especially because of its air shuttle service called “Puente Aéreo” (from now on PA).
The most important rail service available is the high-speed rail (HSR) showed in Figure 2, which is 625 km and was opened in 2008.
In recent years there has been competition between rail and air transport (HSR vs PA).The competition is facilitated by several factors, including the liberalization of the aviation market: the disappearance of companies "flag" and the entry into the market of other companies, including the so-called "low cost", which makes possible a more competitive and efficient market.
The ranges of competition between the two modes are not completely certain, but many authors (EC report 318) say they are between 250 and 1200 km away.
The Madrid-Barcelona corridor before entering the HSR was served by the railway line Madrid-Barcelona, a poor service quality, particularly in terms of commercial speed reached between these two cities. A conventional train Talgo technology covers a distance of 625 km in 5 hours and 30 minutes for an average ticket price of € 65 and a service frequency of 8 departures a day. Before opening the service HSR "Alta Velocidad Española” (AVE) sponsored by the rail service was approximately 800,000 passengers a year.
For this reason most of the trips between Madrid and Barcelona were carried out by air transport. In fact, the Madrid-Barcelona was the busiest air route in Europe before the inauguration of the HSR. Iberia has been the main vector in this path mainly because of its air service shuttle called PA, which moved 3,000,000 passengers before the opening of the service HSR.
This shuttle was designed as a service for commuters where passengers do not need a previous booking. Simply they have to arrive at the airport and get on the next available flight. If a flight is full another one is ready to leave shortly during peak hours. The idea was to provide a lot of flexibility and short waiting times at the airport. The PA has its own brand identity and fee structure. The PA was a kind of second home for generations of businessmen and politicians, ready to pay for all this flexibility and convenience. It has been for years the most profitable path of Iberia.
After the liberalization of European airspace, other carriers such as Spanair, Air Europa and Vueling entered the market. Although these companies are gaining market share over the years, they have never been able to beat the hegemony of Iberia in the path.
taking half of the market on the corridor Madrid-Barcelona. This forced Iberia to reduce capacity and frequencies while maintaining small planes. However, the 625 km between Madrid and Barcelona are really at the limit of what is considered a competitive distance for HSR. For this reason the analysis of competition between HSR and the PA in this corridor is particularly interesting.
Before the entry of the HSR at the end of 2008, the distribution of flights was as follows: Air traffic about 160 daily flights between Madrid and Barcelona (Iberia: 90 flights (60 flights regular + 30);Spanair: 40 flights; Air Europa: 15 flights; Vueling: 14 flights).
The strategy followed by the two methods was the opposite. While airplane mode has maintained its 30 daily flights in both directions, in spite of all the circumstances, the railways have tried to increase theirs: from 17 trains each way offered in February 2008, to 27 offered in March 2010.
Despite the drop in passengers the mode air maintains its frequency even if the high speed is gaining market share. Both modes are aware that to maintain or even increase the demand, the frequency factor is essential for the customer who needs to make the trip and return on the same day. In the strategy of both, it is also very important the travel time. In this sense, in the year 2009 the total travel time was approximately 1 hour and 50 minutes for the airplane and 3 hours for the high speed. By contrast, the total travel time by road is more than 5 hours in the case of car and more than 7 in the case of bus. This means that the characteristics of the customers are completely different.
This has led to two key steps: first, to unify the programming of the air, so that passengers on scheduled flights are integrated directly into the special service of the airlift. In addition, as demand drops, Iberia chooses to change its fleet of aircraft in favour of other smaller models, in order to reduce costs and maintain frequencies.
CAR and BUS uses the A2, N2 and B10 motorways, which has a length of 618 km. The analysis of the modal share in the corridor is reported in Table 1.
Table 1 - Number of users. Year 2009
Items CAR BUS RAIL PLANE
Number of vehicles 9,402,395 36,135 9,855 58,035
Load factor 1.4 38.3 270.9 52.9
Number of users (2009) 13,163,354 1,382,886 2,670,407 3,072,879
% 65% 7% 13% 15%
Source: Movilia 2006/2007,INE (2009),RENFE (2009),Alsa (2009), AENA (2009).
4.1 Calculation of external costs
The first step has been the computation of the external costs for the different transport modes. In this research, we consider the following external costs: congestion, accidents, noise, air pollution and climate change. We have calculated the external costs by implementing the approach of the “Handbook on the estimation of external costs in the transport sector” (Maibach et al., 2008), which was entrusted by the European Commission to the University of Delft. We have used the figures of the manual that better fit the characteristics of the transportation modes and specificities of the corridors that we analyze.
Regarding the calculation of congestion costs, the handbook mentioned previously provides a maximum and a minimum figure for interurban infrastructure. In the end, we have decided to utilize the intermediate value. The marginal external costs per user and per trip are shown in Table 3.
Table 3 – Marginal external costs per users per trip (€)
€ct CAR BUS RAIL PLANE
CONGESTION 44.14 1.61 0.46 97.46
ACCIDENTS 163.33 5.97 0.18 2.24
NOISE 4.41 0.48 5.93 4.33
CLIMATE CHANGE 197.21 23.82 47.51 5.32
AIR POLLUTION 255.70 73.88 21.22 1.71
TOTAL(€ct) 664.79 105.76 75.31 111.07
TOTAL(€) 6.65 1.06 0.75 1.11
% TOTAL 69.47 11.05 7.87 11.61
Source: analysis of the authors
It can be noted that the CAR produces much greater external costs than the public transport modes. The greenest transport mode is the RAIL. The BUS is very efficient in terms of external costs because it has a very high occupancy rate. In this corridor, buses carry on average 38.3 passengers each.
4.2 Economic balance
consider costs, such as infrastructure investments, which remain fixed in the long-run when demand increases.
Economic balance for CAR
CAR is a private mode. Users of cars are mostly owners of the vehicles they drive; therefore all the internal costs related to the CAR usage are borne by them. Consequently, to evaluate the internalization of external costs, we have to compare the marginal external costs that they do not bear with the charges applicable to them. For this reason, we calculate only external costs. To that end, we have evaluated pollutant emissions, noise, accidents and climate change. We do not consider wear and tear costs for the CAR because the damage caused by cars to the pavement is negligible compared to other vehicles (Small et al. 1989).
These costs are balanced with the charges the users pay. Car users pay direct tolls since the corridor is not free of toll. Discriminatory fuel taxes are the only charge paid by them. In Spain, there are two types of fuel taxes: “Impuesto Especial sobre Hidrocarburos (IEH)” and “Impuesto sobre Ventas de Minoristas de Determinados Hidrocarburos (IVMDH)”.
The former is an indirect tax based on the quantity of acquired fuel and it bears upon the production, the import and introduction in the Spanish market of given fuels. This tax has a direct impact on the final consumer. The latter was introduced by the law 24/2001. This tax is also an indirect tax on the quantity of purchased product and it bears upon the retailing of the product subject to the IEH. In 2009, these taxes were both subjected to a 16% of value added tax (VAT). The percentage of VAT corresponding to the fuel taxes is also a discriminatory tax.
The economic balance for the CAR mode is reported in Table 5.
Table 5 – Economic balance for the CAR mode (€ per user per trip)
EXTERNAL MARGINAL COSTS CHARGES
Congestion 0.44 IVMDH 2.15
Accident 1.63 IEH 17.89
Noise 0.04 VAT 7.54
Climate change 1.97
Air pollution 2.56
TOTAL 6.65 TOTAL 27.58
Source: analysis of the authors
Economic balance for BUS
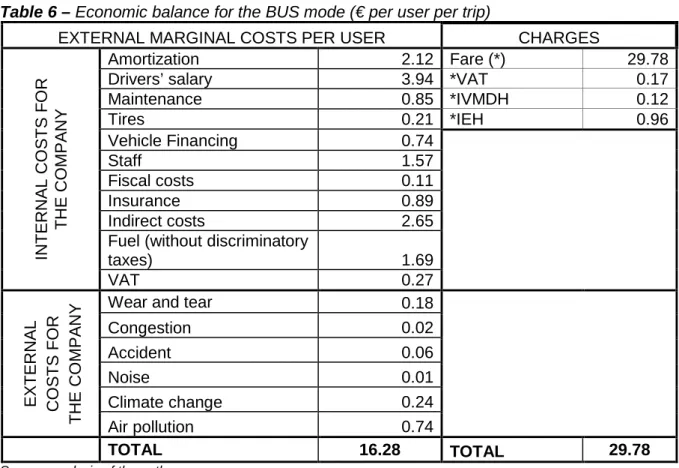
The BUS is a public transport mode whose service is provided by a private company through a franchise awarded by the government. For the analysis of this mode, we are going to focus on the users to whom all the costs, except his time, are external. The company that owns the franchise to operate the service in the Madrid-Barcelona corridor is ALSA. The average ticket cost for the link under study is €29.78 and the average occupancy of the vehicles is 38.3 out of max 52 seats, which is a medium occupancy. For the computation of the management costs, we have contrasted the results provided by ALSA with the outcome of the ACOTRAVI software (version 1.0.1)1 available at the website of the “Ministerio de Fomento” of Spain. The use of this software has enabled us to double check the results.
Unlike cars, infrastructure wear and tear costs have been introduced for the BUS, since they are not negligible (Di Ciommo F. et al., 2008). Discriminatory fuel taxes are paid by the bus company to the government. Consequently, the bus company pass this tax on the users through the fare charged to them. Fuel taxes are hence incorporated implicitly in the value of that fare (*). These taxes are not considered a cost in the balance since they are discriminatory.
Table 6 – Economic balance for the BUS mode (€ per user per trip)
EXTERNAL MARGINAL COSTS PER USER CHARGES
Amortization 2.12 Fare (*) 29.78
Drivers’ salary 3.94 *VAT 0.17
Maintenance 0.85 *IVMDH 0.12
Tires 0.21 *IEH 0.96
Vehicle Financing 0.74
Staff 1.57
Fiscal costs 0.11
Insurance 0.89
Indirect costs 2.65
Fuel (without discriminatory
taxes) 1.69 IN T E R N A L C O S T S F O R T H E C O M P A N Y VAT 0.27
Wear and tear 0.18
Congestion 0.02
Accident 0.06
Noise 0.01
Climate change 0.24
E X T E R N A L C O S T S F O R T H E C O M P A N Y
Air pollution 0.74
TOTAL 16.28 TOTAL 29.78
Source: analysis of the authors
The main result is that the BUS mode internalizes far all external costs produced by it. Also fuel taxes are higher than the external costs produced by BUS mode.
Economic balance for RAIL
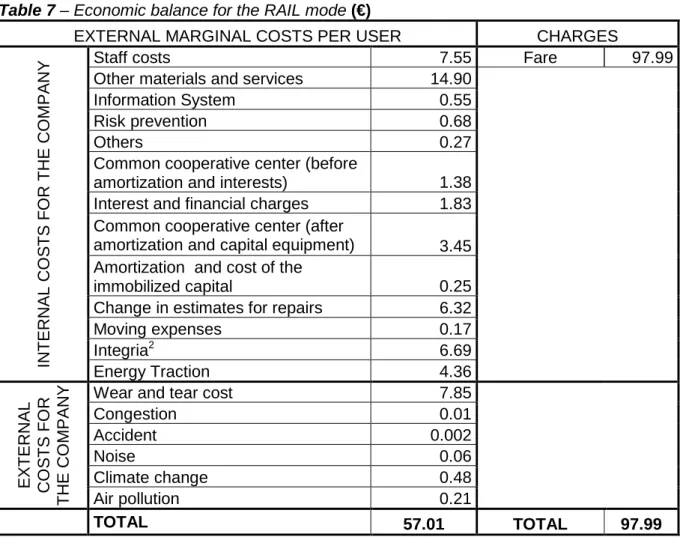
The approach used to assess the economic balance for the RAIL mode is the same as the one conducted for the BUS mode. The high speed rail service is provided by Renfe, which is the national Spanish rail company. Unlike the BUS mode, the RAIL mode is not subjected to any kind of discriminatory tax.
The external marginal costs have been computed considering the data provided by Renfe itself in its 2009 annual report. It is necessary to underline that since Renfe does not own the infrastructure for the service, it has to pay a fee to the rail infrastructure company (named ADIF). This fee is higher than the wear and tear costs produced by the trains. Approximately 30% of this charge represents the infrastructure wear and tear costs. The average ticket price in 2009 to travel from Madrid to Barcelona was 97.99 €. The RAIL economic balance is reported in Table 7.
Table 7 – Economic balance for the RAIL mode (€)
EXTERNAL MARGINAL COSTS PER USER CHARGES
Staff costs 7.55 Fare 97.99
Other materials and services 14.90
Information System 0.55
Risk prevention 0.68
Others 0.27
Common cooperative center (before
amortization and interests) 1.38
Interest and financial charges 1.83 Common cooperative center (after
amortization and capital equipment) 3.45 Amortization and cost of the
immobilized capital 0.25
Change in estimates for repairs 6.32
Moving expenses 0.17
Integria2 6.69
IN T E R N A L C O S T S F O R T H E C O M P A N Y
Energy Traction 4.36
Wear and tear cost 7.85
Congestion 0.01
Accident 0.002
Noise 0.06
Climate change 0.48
E X T E R N A L C O S T S F O R T H E C O M P A N Y
Air pollution 0.21
TOTAL 57.01 TOTAL 97.99
Source: analysis of the authors
The subsidies that Renfe receives from the State will not appear in the budget proposal as it does not affect in any way the individual user. Moreover, these subsidies only can cover services classified as public service, and obviously, the high speed is not between them. The analysis was done to explain how this mode of transport works and sustains itself economically. Looking at the problem in terms of internalization of costs it is evident that external costs are lower than what you pay to use this mode of transport.
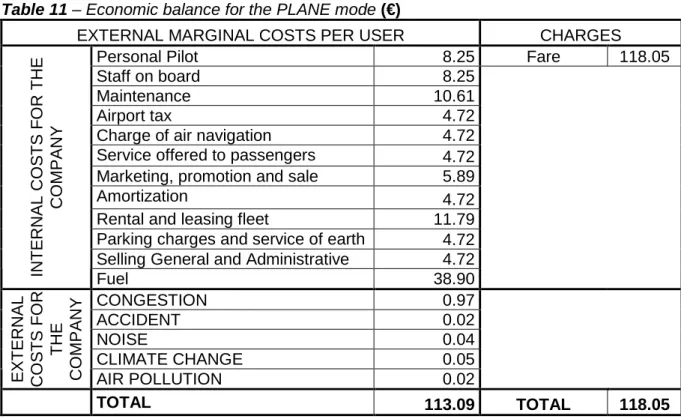
Economic balance for PLANE
It is important to note that in the ticket price are not accounted for the external costs generated by each of the different modes of transport, as this could lead to substantial differences between them. The cost of air transport that supports the passenger is represented in the ticket, which varies depending on the type of company and Class. The price of the airline ticket taxes are accounted for air transport and airport fees charged to the aircraft.
If we analyze in detail the actions of the total costs of an airline, most of the costs are for fuel, whose price is set by the oil market, which usually affects the final price of the ticket. As for the other expenses incurred by the airlines, both traditional and "low cost" they relate to the promotion costs, maintenance, personnel, administration, and the airport in general.
The cost of call includes all taxes and services that the airline has to pay, and even if there is not a single criterion for classification and counting, it is usually considered to be composed mainly of:
• Tax passenger: they are taxed according to the number of passengers carried and include fees for the use of infrastructure and security tax;
• Aircraft rates: are taxed according to the type of aircraft concerned (this group includes the landing fee, the rate of approach and other airport charges);
• Taxes: Some countries apply taxes as additional measures for the financing of airports, to fund supplementary programs of environmental average character, noise insulation programs, etc..;
• Handling (Operations): amounts paid by airlines to agents providing support services on the ground.
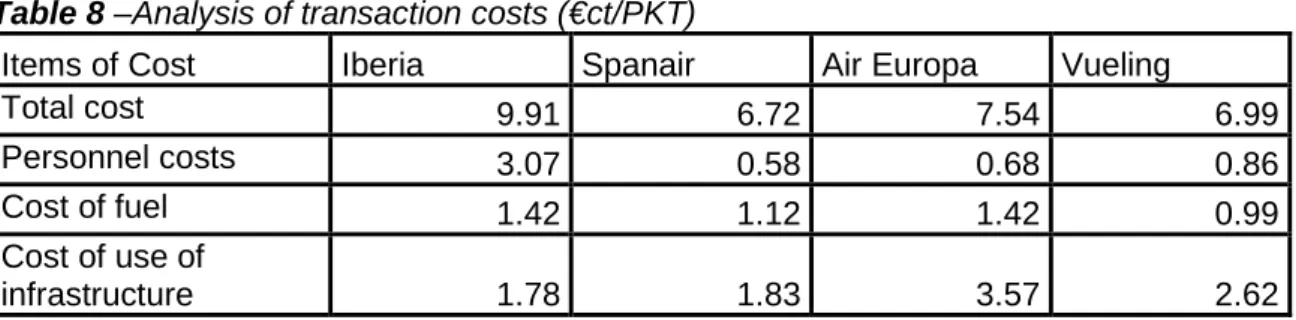
It is possible to know with any certainty the first three components of the cost of call (passenger tax, aircraft tax and taxes) because their amounts are fixed for a certain period of validity. However, it isn’t possible to obtain the same certainty for management fees, since the standard price will always be subject to wide margins of variation.
Table 8 –Analysis of transaction costs (€ct/PKT)
Items of Cost Iberia Spanair Air Europa Vueling
Total cost 9.91 6.72 7.54 6.99
Personnel costs 3.07 0.58 0.68 0.86
Cost of fuel 1.42 1.12 1.42 0.99
Cost of use of
infrastructure 1.78 1.83 3.57 2.62
Source: analysis of the authors
Using the values in the table above we are going to calculate the total cost for each airline in € / PKT, shown in Table9:
Table 9 –Analysis of transaction costs (€)
Items of Cost Iberia Spanair Air Europa Vueling
Total cost 127,052,614.92 38,290,999.99 17,185,365.47 13,940,317.18
Source: analysis of the authors
This allows us to calculate an average cost of call for the two airports of Madrid and Barcelona in Table 10 is equal to:
Table 10 –Analysis of Average cost of call (€/passenger)
Total cost 196,469,297.56 €
Passenger Corridor PA 3,072,878.88 Passenger
Average cost of call 63.94 €/ Passenger
Source: analysis of the authors
Table 11 – Economic balance for the PLANE mode (€)
EXTERNAL MARGINAL COSTS PER USER CHARGES
Personal Pilot 8.25 Fare 118.05
Staff on board 8.25
Maintenance 10.61
Airport tax 4.72
Charge of air navigation 4.72
Service offered to passengers 4.72 Marketing, promotion and sale 5.89
Amortization 4.72
Rental and leasing fleet 11.79
Parking charges and service of earth 4.72 Selling General and Administrative 4.72
IN T E R N A L C O S T S F O R T H E C O M P A N Y Fuel 38.90 CONGESTION 0.97 ACCIDENT 0.02 NOISE 0.04
CLIMATE CHANGE 0.05
E X T E R N A L C O S T S F O R T H E C O M P A N Y
AIR POLLUTION 0.02
TOTAL 113.09 TOTAL 118.05
Source: analysis of the authors
5. Conclusions and further perspectives
This work shows that the marginal external costs produced by car, bus and plane are superior to those produced by high-speed trains. We can also say that the high-speed rail is the cleanest of all surface modes. We note that every transport mode internalizes the external costs it produces. However, the case for road transport is largely paid through fuel taxes discriminatory. The reason for that lies in the fact that marginal external costs are not higher than the fixed transport costs which are charged by to the users.
In spite of this, this work shows that the competition between plane and rail in the Madrid-Barcelona corridor is distorted, so allocative efficiency is not achieved.
The plane barely internalizes the external costs it produces, this is important because the two modes high speed rail and plane are in strong competition in the hallway for their market share.
Improving allocative efficiency in favor of the internalization of external costs would justify reducing High Speed fares. This will change the market share by increasing the 'high-speed’ rail demand.
Favouring one mode of transport to other imposing taxes, without, however, a thorough analysis of the transport system creates imbalances in the market.
In order to internalize external costs properly (the strategy should be integrated into a broader concept of sustainable transport) we suggest the following possibilities:
• Implementation of a common European fuel tax, applicable to all modes of transport, to achieve the objectives of a long-term strategy of the climate in Europe. The types of environmental tax for CO2 emissions must be consistent with the proposed shadow prices (at least 20 per tonne of CO2 in relation to the Kyoto targets). It is of the utmost importance the inclusion of international aviation in the European tax system to reduce the distortion caused by the difference in tax treatment between different modes.
• A greater effort on the part of the railways to accelerate technical progress in improving their environmental performance, such as the improvement of the acoustic behaviour of trains (see Action Plan against noise UIC), the increase in energy efficiency (see Plan ' action diesel UIC), and the use of renewable energy sources.
• Internalize the external costs of accidents and environmental externalities in the areas of road and air transport, as these components are the main causes of most of the external costs.
REFERENCES
Blanch Ricart, Clara; Lòpez Pita, Andrés (2007) Influencia de los servicios de Alta Velocidad en el tráfico aéreo en España, Barcelona.
Council of the EU (2004) Council Directive 96/48/EC of 23 July 1996 on the interoperability of the trans-European high-speed rail system. Consolidated Directive 2004/50/EC According to version of 29 April 2004, Brussels.
Di Ciommo F.; Vassallo J-M; Perez P.; Monzón A. (2008). Sistema tarifario de las carreteras españolas en base a un modelo de costes sociales, VIII Congreso de Ingeniería del transporte, La Coruña.
Di Ciommo F.; Vassallo J-M; Perez P.;Monzón A. (2008).META, 2008, Modelo español de tarificación de carreteras, Informes tarea 1, 5,6 y 8. Financiado por el Centro de Estudios y Experimentación de Obras Públicas CEDEX Madrid.
Echeverri A. (2001). Apuntes sobre alta velocidad ferroviaria. ETSICCyP, Departamento Transportes, Cursos de Doctorado. Colegio de Ingenieros de Caminos, Canales y Puertos, Servicio de Publicaciones, Colección Escuelas, Madrid.
European Commission. (1998). White Paper: Fair payment for infrastructure use: A phased approach to a common transport infrastructure charging framework strategy in the European Union, Brussels.
European Commission. (2000) Cost 318. Interactions between high speed rail and air passenger transport: final report, Madrid.
European Commission. (2001).White Paper: European transport policy for 2010: time to decide, Brussels.
European Commission. (2011).White Paper: Roadmap to a Single European Transport Area – Towards a competitive and resource efficient transport system, Brussels.
Hau, T. (1992). Economic Fundamentals of Road Pricing. A Diagrammatic Analysis. World Bank. Policy Research Working Paper Series WPS 1070, The World Bank, Washington D.C., December 1992.
Liana G.; Michael S. European transport policy – A historical and forward looking
perspective. The Interdisciplinary Centre for Compariative Research in the Social Sciences (IFS-ICCR-CIR), Vienna.
Maibach M.; C. Schreyer; D. Sutter (INFRAS); H.P. van Essen; B.H. Boon; R. Smokers; A. Schroten (CE Delft); C. Doll (Fraunhofer Gesellschaft – ISI); B. Pawlowska, M. Bak (University of Gdansk) (2008). Handbook on estimation of external costs in the transport sector, Delft.
Pagliara F.; Vassallo J.M.; Román C.(2011). High speed vs. air transportation: the Madrid Barcelona case study.
Pahaut, S.; C. Sikow. (2006). History of thought and prospects for road pricing. Transport Policy, Vol. 13, 2006, pp. 173-176.
Pérez-Martínez P. J.; López-Suárez E.(2006). Performance of the High speed RAIL in Spain in the context of the new regulation framework. Evidence from the Madrid-Seville hsr Corridor. 9th Conference on COmpetition and Ownership in LAND TRANSPORT.
Pigou, A.C. (1920) The Economics of Welfare. MacMillan, London.
Quinet, E. (2004). A meta-analysis of Western European external costs estimates. Transportation Research Part D, Transport and Environment, Vol. 9.
Roman Garcìa, Concepción (2008). Competencia intermodal en el corredor
Madrid-Zaragoza-Barcelona ante la introducción del tren de alta velocidad, Las Palmas de Gran Canaria.
Small, K.; Winston, C. and Evans, C.A. (1989) Road Work: a new highway pricing and investment policy. The Brookings Institution, Washington, D.C.
Vassallo, J.M. (2009) Competencia Entre la Alta Velocidad ferroviaria y el Transporte aéreo, Madrid.
Vassallo, J.M. (2001) La participación privada en la gestión y financiación de infraestructuras de transporte. Ministerio de Fomento, Madrid, 2001.
Vassallo, J.M.; Lopez E. (2008). Charging Heavy Goods Vehicles in the European Union. Is the Current Allocation Efficient? Transportation Research Board Meeting, Washington D.C.