The Ring Compression Test: Analysis of dimensions and
canonical geometry
F. Martín
(1,*), M.J. Martín
(1), L. Sevilla
(1), M.A. Sebastián
(2)(1 ) Department of Manufacturing Engineering, University of Malaga. C/ Dr. Ortiz Ramos, s/n
E-29071 Málaga, Spain. email(*) [email protected]
(2) Department of Manufacturing Engineering, Universidad Nacional de Educación a Distancia
(UNED), c/ Juan del Rosal 12, 28040 Madrid, Spain.
ABSTRACT
The compression ring test is universally accepted as a perfectly valid method by which determine simply and reliably the adhesion friction factor in a plastic deformation process. Its methodology is based on the application of geometric changes as both the reduction in thickness as the decrease in bore inner diameter in the strained ring itself. In this paper the performance of that test is the basis for establishing the coefficient of friction on a forging process so that, given this, its application to Upper Bound Theorem (UBT) by model Triangular Rigid Zones (TRZ), enable the establishment an intercomparison with empirical force, reaching a cuasivalidation of this Theorem in a certain range.
Keywords: Ring Compression Test, Plastic Deformation, Upper Bound Theorem, Forging, Friction.
1. Introduction
Obtaining the most suitable solution in the calculation of the forces necessary to plastically deform a material requires a thorough understanding of the various factors that influence decisively in the evolution of the deformation process. Factors among which are the properties of the material under deformation, the geometry and type of material creep deformation, both with regard to its direction as its speed, and especially, friction conditions [1,2].
Methods based on Upper and Lower Limit Analysis offer solutions that delimit the range that has to be this exact solution from an analytical point of view. Between these limits, the Upper one presents the guarantee of a correct application, both for its ease of application as its theoretical foundation, the necessary deformation will be feasible by means the calculated solution.
UBT not only provides a solution with the minimum load value which ensures its deformation, but, given its analytical treatment, discriminates the parameters that come into play and allows optimizing process conditions. This possibility of discrimination, facilitate in fact, incorporate the value and type of friction.
The expression of UBT, formulated by Prager and Hodge [3] (Eq. 1), indicates that, bearing in mind the existing surfaces discontinuities between the different rigid zones considered, among all possible kinematically admissible fields, the optimun is one that minimizes the expression.
S
i i St ij
V
j
dV
v
ds
T
v
ds
i
J
2
1
3
2
*
0 (Eq. 1)Since in the present study is performed on a ring, the UBT by TRZ model [4-8] by establishing a dual section from which below will be called Neutral Radio. Under these conditions, the equation yields the dimensionless ratio p/2k (Eq. 2) to subsequently obtain the necessary load to achieve the deformation is:
h
m
b
b
h
k
p
4
)
1
(
2
(Eq. 2)In almost all applications, parts formed by plastic deformation, and specifically, forging manufacturing processes, it is essential determine the friction factor that is present along the deformation process. The correct application of analytical methods such as UBT by means TRZ model depend heavily on the influence of this effect. It is therefore of vital importance for proper use, determination of the coefficient quoted.
Ring Compression Test provides to a canonical geometrical dimensions, the possibility of finding these coefficients [9]. Compliance with the proportions established as canonical for the outer and inner diameters and height of the rings under study proposes an evolution of the deformation undergone by the similar piece to what happens in cases considered as plane strain, application model Triangular Rigid Zone in UBT since this condition is necessary to maintain in this model.
In the process of plastic deformation of metals, the frictional forces are generated at the interface between tool and workpiece. Friction as the most decisive effect on operations forming materials are considered, so it must be properly calculated to different parameters to optimize processes, such as the load required to reach the necessary deformation. The effective friction control requires accurate data of the main variables that influence the forming process, such as the type and conditions lubrication, the temperature in the process, the rate of application of the load and pressure on the material and therefore the resistant area presenting a specimen under analysis.
When trials that evaluate the performance of a theoretical model developed, the main parameters brought into play in the actual process must act consistently with those established in various tests. Thus, in the present case, these are the fundamental parameters load and speed of this application, the parameters that should be possible more analogous to those actually present in the process.
The Ring Compression Test is not established as a standard test in which they are defined exhaustively the conditions for its application, it is a simple compression operation by forging by parallel flat plates on a piece geometry ring through which be possible to calculate the friction coefficient according to the change of the inner diameter and the height or thickness of the same [10, 11].
When a ring-shaped specimen is axially deformed following a change of geometry is obtained, this change depends on the degree of compression effected in the height direction and the conditions existing at the interface friction ring-tool. If friction is invalid, i.e. under conditions of perfect lubrication, the ring will deform as would a solid disk, without bore and therefore an inner radius nonexistent. In this case each ring element radially outward flow, the outer radius increasing in proportion to the charge used. In cases where the friction is moderate and therefore the friction coefficient take low values, the outflow of the specimen occurs to a greater degree for a given compression value, this is due to increased inner radius, causing, due to the constancy of volume present in the forming processes by plastic deformation, the entire outward deformation even increased by this. This underlies different evolution for determining the friction coefficient will not reach the outer diameter of the same dimensions as in the previous case. Beyond a certain critical value, the frictional resistance of the outward flow becomes so high that a portion of the material flows into the ring. Measurements of internal diameters of the rings deformed provide an effective means for the study of the interfacial friction since the inner diameter increases with low friction and decreases if the friction is high.
The procedure for obtaining the coefficient of friction by this test is simple. For the friction factor (m), the decrease of the internal diameter of the ring will be compared with that observed in the collection of charts for different canonical relations existing on the subject [12].
under constant temperature. In these conditions, the interfacial shear stress , is given by Equation
3:
3
0
m
(Eq.3)Where
0 is the yield stress of the material it is made the ring.The description of the flow considered an imaginary cylinder of radius R = Rn, where Rn is called so Neutral Radio. Ring subjected to high friction all elements of the workpiece to be kept within a radius R > Rn tend to move outwardly increasing their radial positions, in contrast, the rest of the sample points have a geometrically R < Rn flow inwards. Points situated on the neutral radius (R = Rn) remain in the same place, so this is called neutral radius radio. In the studies reviewed in this paper the neutral radius is within the same ring, ie, the neutral radius is larger than the inner radius (Rn > Ri).
Figure 1. bulk of the specimens
The height of the rings will be geometrically defined in terms of the canonical relations 6:3:2 (Do: Di: h) (where Do and Di the outer and inner diameters of the ring respectively, h the height or thickness of the specimen) and 6:3:1, these relations, which together with the 6:3:0.5 ensure flow behavior assimilated material plane strain conditions [15]. These alluded conditions are suitable for the implementation of UBT by developing Triangular Rigid Zones. In this paper, due to technological limitations are the first two that are taken into consideration.
2. Methodology
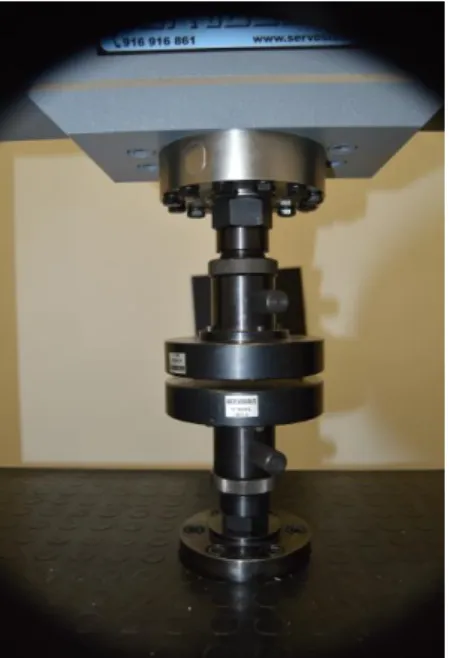
The tests were performed with a universal servo-hydraulic machine SERVOSIS model ME-405/10 with a capacity of 100 kN load (Figure 2). Preliminary tests employees for this study determined the negligible influence of temperature against throughout the process.
Testing machine, originally used for tensile tests, allows, by reversing the movement of the jaws apply appropriate compression in our case (Figure 3).
Testing machine, originally used for tensile tests, allows, by reversing the movement of the jaws apply appropriate compression in our case (Figure 3).
Figure 3. Deformation processes of the specimens
They have been made 60 trials of which 30 correspond geometrically to a canonical relation of 6:3:2 and others 30 to the ratio 6:3:1. In each of the geometric relationships are provided 12 test pieces with an outside diameter of 24 mm, 12 of 12 mm and thirdly, 6 with an outer diameter of 18 mm, in order to achieve a cloud of points intermediate to establish the friction curve.
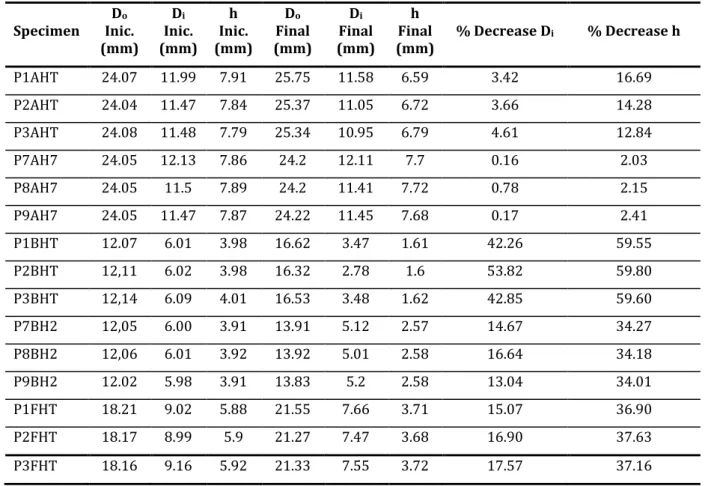
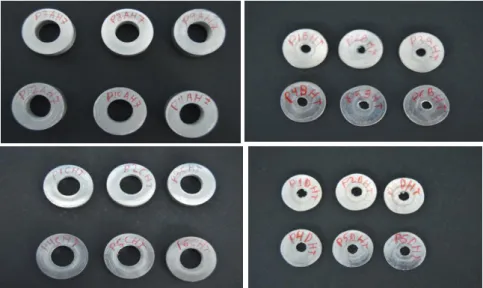
It has used a specimens identification by means a generic code: PXXHX, wherein P denotes the element, the first digit shows the number of test performed on a given outer diameter, the second digit corresponds to the free different initial heights of the rings, then a H to indicate the value of the last digit that expresses the value of the final ring height reached in the trial ("T" denote those trials have been made to the limit load, 95 kN in this set) (Figure 4). For example, shown in the following table (Table 1) the geometric characteristics of some of the tested specimens.
Table 1. Code and geometric characteristics of specimens
Specimen D
o
Inic. (mm)
Di
Inic. (mm)
h Inic. (mm)
Do
Final (mm)
Di
Final (mm)
h Final
(mm) % Decrease Di % Decrease h
P1AHT 24.07 11.99 7.91 25.75 11.58 6.59 3.42 16.69
P2AHT 24.04 11.47 7.84 25.37 11.05 6.72 3.66 14.28
P3AHT 24.08 11.48 7.79 25.34 10.95 6.79 4.61 12.84
P7AH7 24.05 12.13 7.86 24.2 12.11 7.7 0.16 2.03
P8AH7 24.05 11.5 7.89 24.2 11.41 7.72 0.78 2.15
P9AH7 24.05 11.47 7.87 24.22 11.45 7.68 0.17 2.41
P1BHT 12.07 6.01 3.98 16.62 3.47 1.61 42.26 59.55
P2BHT 12,11 6.02 3.98 16.32 2.78 1.6 53.82 59.80
P3BHT 12,14 6.09 4.01 16.53 3.48 1.62 42.85 59.60
P7BH2 12,05 6.00 3.91 13.91 5.12 2.57 14.67 34.27
P8BH2 12,06 6.01 3.92 13.92 5.01 2.58 16.64 34.18
P9BH2 12.02 5.98 3.91 13.83 5.2 2.58 13.04 34.01
P1FHT 18.21 9.02 5.88 21.55 7.66 3.71 15.07 36.90
P2FHT 18.17 8.99 5.9 21.27 7.47 3.68 16.90 37.63
Figure 4. Specimen encoded
The material used in conducting the tests give an aluminum alloy EN AW-2030 (EN 573-1), the material usually used in many industrial applications both manufacturing and aeronautical. Load limitation imposed by the machine used has forced performing heat treatment to the starting material, reaching values for hardening coefficient n = 0.26 and K = 404.66 MPa characterized once the same, Hollomon´s equation (Eq. 4).
K
n (Eq.4)Initially a calibration process and check the geometrical characteristics of the samples (columns 1 to 3 of Table 1) is performed. After placing each of the test sample, a preload of 8 kN is performed until the initial contact between the matrices of load application and the specimen to be tested. Achieved this contact, we proceed to perform the charging process at a reduced speed of 0.08 mm / s. Then proceeds to a process of measuring both the height and the inner and outer diameters of test pieces (columns 4-6 of Table 1).
3. Results and discussion
Finally, from the results obtained, estimated by comparing with graphics derived from Ring Compression Test to canonical relations 6:3:2 and 6:3:1 (Figure 5) is obtained the friction coefficient value (Equation 4).
Once designed the 60 trials, we have obtained the new inner and outer diameters, heights of each ring and the load history of each specimen. We calculated the percentage decreases in the inner diameters and heights in order to compare them with graphic treatment with the derivatives in Figure 5. As shown in Figure 6 shows the correspondence between the results obtained and the graphic above we determined values m coefficient of friction similar to each close to m = 0.7 in the geometric relationship geometries 6:3:2 and m = 0.6 to 6:3:1.
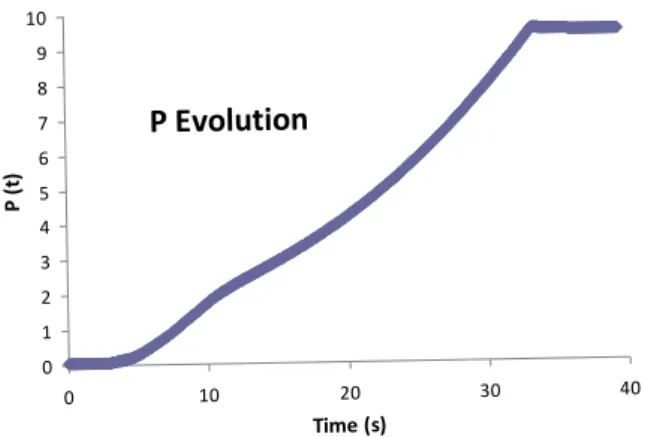
In Figure 7 we can see an example of the evolution of the load applied as a function of time, taken from the corresponding test (P1AHT).
Figure 5. Graphics friction coefficients from Ring Compression Test
Figure 6. Curves Ring Compression Test and experimental curve
Figure 7. Evolution of the load. Data from trial specimen P1AHT
70
50
60
20
30
40
0
10
-10
m=1.0
0.5
0.7
0.3
0.1
0.05
0.15
0.2
-20
0
10
20
30 40
50
60
70
Decrease (%) Do
D ec rea s e (% ) h
6:3:2
70
50
60
20
30
40
0
10
-10
m=1.0
0.5
0.7
0.3
0.1
0.05
0.15
0.2
-20
0
10
20
30 40
50
60
70
Decrease (%) Do
D ec rea s e (% ) h
70
50
60
20
30
40
0
10
-10
m=1.0
0.5
0.7
0.3
0.1
0.05
0.15
0.2
-20
0
10
20
30 40
50
60
70
70
50
60
20
30
40
0
10
-10
m=1.0
0.5
0.7
0.3
0.1
0.05
0.15
0.2
-20
0
10
20
30 40
50
60
70
0
10
10
20
20
30 40
30 40
50
50
60
60
70
70
Decrease (%) Do
D ec rea s e (% ) h
6:3:2
70
50
60
20
30
40
0
10
-10
m=1.0
0.5
0.7
0.3
0.1
0.05
0.15
0.2
-20
0
10
20
30 40
50
60
70
80
D ec rea s e (% ) hDecrease (%) Do
6:3:1
70
50
60
20
30
40
0
10
-10
m=1.0
0.5
0.7
0.3
0.1
0.05
0.15
0.2
-20
0
10
20
30 40
50
60
70
80
D ec rea s e (% ) hDecrease (%) Do
70
50
60
20
30
40
0
10
-10
m=1.0
0.5
0.7
0.3
0.1
0.05
0.15
0.2
-20
0
10
20
30 40
50
60
70
80
70
50
60
20
30
40
0
10
-10
m=1.0
0.5
0.7
0.3
0.1
0.05
0.15
0.2
-20
0
10
20
30 40
50
60
70
0
10
10
20
20
30 40
30 40
50
50
60
60
70
70
80
D ec rea s e (% ) hDecrease (%) Do
6:3:1
70
50
60
20
30
40
0
10
-10
m=1.0
0.5
0.7
0.3
0.1
0.05
0.15
0.2
-20
0
10
20
30 40
50
60
70
Decrease (%) Do
D ec rea s e (% ) h
6:3:2
70
50
60
20
30
40
0
10
-10
m=1.0
0.5
0.7
0.3
0.1
0.05
0.15
0.2
-20
0
10
20
30 40
50
60
70
0
10
10
20
20
30 40
30 40
50
50
60
60
70
70
Decrease (%) Do
D ec rea s e (% ) h
6:3:2
70
50
60
20
30
40
0
10
-10
m=1.0
0.5
0.7
0.3
0.1
0.05
0.15
0.2
-20
0
10
20
30 40
50
60
70
80
D ecr ea s e (% ) hDecrease (%) Do
6:3:1
70
50
60
20
30
40
0
10
-10
m=1.0
0.5
0.7
0.3
0.1
0.05
0.15
0.2
-20
0
10
20
30 40
50
60
70
0
10
10
20
20
30 40
30 40
50
50
60
60
70
70
80
D ecr ea s e (% ) hDecrease (%) Do
6:3:1
P Evolution
0 1 2 3 4 5 6 7 8 9 100 10 20 30 40
Time (s)
P
(
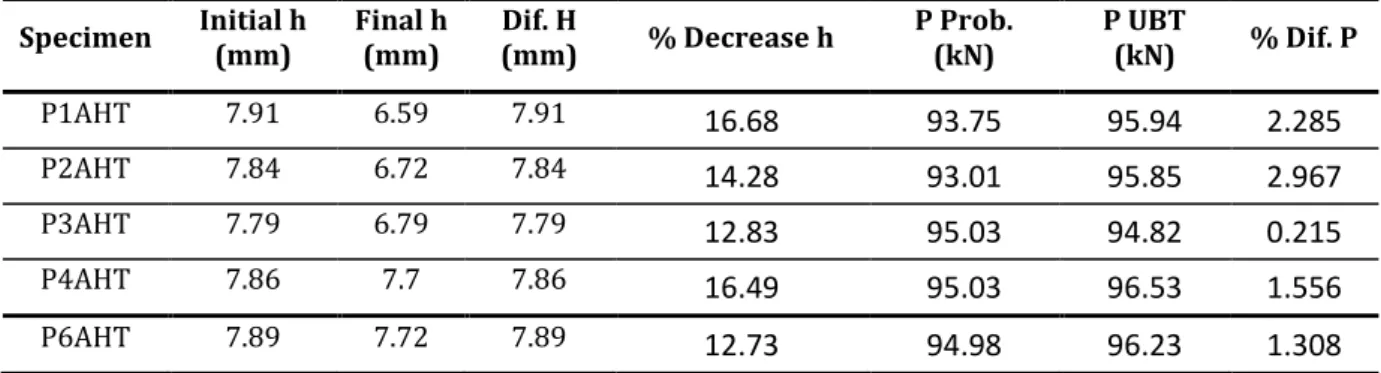
Figure 8 shows the difference in the values of the applied load from a theoretical calculation from the implementation of UBT by TRZ with those obtained from the different trials of PxAHT series.
Table 2. Values of P in the A series of test pieces
Figure 8. Values calculated using TLS load P versus P extracted from experimental results
4. Conclusions
The number of trials has shown valid enough to assay development of the process. The cloud points being obtained with a low dispersion and have identified a friction curve highly available to the Ring Compression Test.
In any case, it is desirable to extend the study configurations canonical ratio 6: 3: 0.5 and higher-dimensional geometric work-pieces.
The set correspondence between the results of the load P necessary to achieve the deformation of the pieces tested, and those obtained from the application of TLS (for the tests discussed have a deviation of about 2%), shows a evidence of the suitability of using the Ring Compression Test for determining the friction existing in the process of shaping by plastic deformation, and analogous forms of employment viability Upper Limit Theorem under their specific development model Rigid Block Triangular
5. Acknowledgements
The authors want to thank the University of Malaga – Andalucia Tech, International Campus of Excellence, and the FPU program of the Ministry of Education, Culture and Sport of Spain for its economic contribution on this paper.
Specimen Initial h (mm) Final h (mm) (mm) Dif. H % Decrease h P Prob. (kN) P UBT (kN) % Dif. P
P1AHT 7.91 6.59 7.91
16.68
93.75
95.94
2.285
P2AHT 7.84 6.72 7.84
14.28
93.01
95.85
2.967
P3AHT 7.79 6.79 7.79
12.83
95.03
94.82
0.215
P4AHT 7.86 7.7 7.86
16.49
95.03
96.53
1.556
P6AHT 7.89 7.72 7.89
12.73
94.98
96.23
1.308
P (UBT) vs P (Exp)
0 10 20 30 40 50 60 70 80 90 100
P1AHT P2AHT P3AHT P4AHT P6AHT
Specimen
P
(k
N
)
P TLS
6. References
[1] J. Chakrabarty, Theory of plasticity, Elsevier Science, Oxford (U.K.), 2006.
[2] S. Kalpakjian and S. R. Schmid, Manufacturing engineering and technology. Prentice Hall., New Jersey (USA), 2009.
[3] W. Prager and P.G. Hodge. Theory of Perfectly Plastic Solids. Chapman & Hall, Ltd., London, 1951. [4] J. Ajiboye. Upper Bound analysis of extrusion for square billets trough circular and square/rectangular dies. Journal of Mechanical Science and Technology, 23 (2009), pp. 461-474.
[5] F. Martín, L. Sevilla, M.A. Sebastián. Implementation of Technological and Geometrical Parameters in Forging Processes by Means of the Upper Bound Element Technique. American Institute of Physics Conference Proceedings, 1181 (2009), pp. 455-463.
[6] F. Martin. Development, integration and optimization at the study of forging processes by the Upper Bound Theorem trough Triangular Rigid Blocks model. PhD. Thesis. University of Malaga. Malaga. Spain, 2009.
[7] F. Martín, L. Sevilla, E. Rubio, M.A. Sebastián. Bases para la aplicación del Teorema del Límite Superior en procesos de forja sobre configuraciones geométricas modulares. Proc. of MESIC 2007: 2nd Manufacturing Engineering Society International Conference. Madrid, Spain, 2007.
[8] F. Martín, A.M. Camacho, R. Domingo, L. Sevilla. Modular Procedure to improve the application of the Upper Bound Theorem in forging. Materials and Manufacturing Processes. (DOI: 10.1080/10426914.2012.718478).
[9] T. Altan and C.H. Lee. Influence of Flow Stress and friction Upon Metal Flow in Upset Forging of Rings and Cylinders. Journal of Engineering for Industry. Transactions of the ASME. 94 (3), (1972), pp. 775-782. [10] ASTM. E 676-00. Standard test method for tensile strain-hardening exponents (n-values) of metallic sheet materials. ed. West Conshohocken: ASTM International, 2007.
[11] E.M. Rubio. Energetic analysis of tube drawing processes by the Upper Bound Method using theoretical work-hardening materials. Steel Research International, (2012), pp. 555-558.
[12] AA. VV. ASM Handbook, Forming and Forging. ASM International. 14, Metals Park, Ohio, USA, 1996. [13] B. Avitzur and C.J. Van Tyne. Ring Forming: An Upper Bound Approach. Part 1: Flow Pattern and Calculation of Power. Journal of Engineering for Industry. Transactions of the ASME. 104, pp. 231-237. [14] B. Avitzur. Metal forming: Processes and analysis. Robert E. Krieger Publishing Company, Inc. Huntington, New York, USA, 1968.