Emotional Domotics: acquisition of an equation for the correlation of emotional states and environmental variables through the facial expressions analysis of the user
351
0
0
Texto completo
(2) ©Copyright by Sergio Alberto Navarro-Tuch, 2018 All Rights reserved. ii.
(3) INSTITUTO TECNOLÓGICO Y DE ESTUDIOS SUPERIORES DE MONTERREY CAMPUS CIUDAD DE MÉXICO. THE COMMITTEE MEMBERS HEREBY RECOMMEND THE THESIS PRESENTED BY SERGIO ALBERTO NAVARRO-TUCH TO BE ACCEPTED AS A PARTIAL FULFILMENT OF THE REQUIREMENTS FOR THE DEGREE OF DOCTOR OF PHILOSOPHY IN ENGINEERING SCIENCES. COMMITTEE MEMBERS. ————————————————– DR. MARTIN ROGELIO BUSTAMANTE-BELLO THESIS ADVISOR ITESM, CAMPUS CIUDAD DE MÉXICO. ————————————————– DR. HÉCTOR MANUEL PÉREZ MEANA COMITEE MEMBER IPN ESIME SEPI, CAMPUS CULHUACAN. ————————————————– DR. RICARDO THIERRY AGUILERA COMITEE MEMBER ITESM, CAMPUS CIUDAD DE MÉXICO. ————————————————– DR. RICARDO ZAVALA YOE COMITEE MEMBER ITESM, CAMPUS CIUDAD DE MÉXICO. ————————————————– DR. ENRIQUE CRUZ GÓMEZ COMITEE MEMBER ITESM, CAMPUS CIUDAD DE MÉXICO. ————————————————– DR. MANUEL INDALECIO ZERTUCHE GUERRA GRADUATE PROGRAM ON ENGINEERING SCIENCES, DEAN ITESM, CAMPUS MONTERREY. CIUDAD DE MÉXICO, MÉXICO, NOV 2018. iii.
(4) Acknowledgements I want to thank all those who were by my side throughout the development of this research project, as well as those whose work and advice allowed me to realize this work. To my advisor, Dr. Martı́n Rogelio Bustamante Bello, who not only believed in me, but also guided me throughout the research process even in moments and ways beyond the fulfillment of duty. Thanks for their support and aid to:. • BSA. Renée Denyse Labardini Ramı́rez. • PhD. Arturo Molina Gutiérrez. • Eng. Claudio Raúl Zamora Rosales. • PhD. Ricardo Ambrosio Ramı́rez Mendoza. • Eng. Jorge Luis Bonilla Peralta. • PhD. Ricardo Zavala Yoe. • Eng. Emmanuel Nieto Casarrubias. • PhD. Ricardo Aguayo González. • Eng. Guadalupe Zeltzin Castillo Beltrán. • PhD. David Sánchez Monroy. • Eng. Habid Raúl Velázquez Corral. • MS. Silvia Isabel Covarrubias Sermeño. • Eng. Ariel Alejandro López Aguilar. • MS. Carlos Figueroa. • Eng. Luis Alberto Curiel Ramı́rez. • MS. Yadira Gutiérrez Martı́nez. • Eng. Daniel Svein Meinguer Estrada. • MS. José Luis Pablos Hach. • Eng. Hoi Tak Lueng Lan. • Prof. Martı́n Francisco Cortéz Bernal. • Eng. Israel Luna Henández. • Prof. Arturo Arteaga Rios. • Eng. Jaime Guillermo Morales Zavaleta. • Eng. Roberto Avila Vázquez. • Eng. Leopoldo Julián Lechuga López. • Eng. Javier Izquierdo Reyes. • BSA. Ernesto Limón Silva. • Eng. Javier Hernández Soto. • BSA. Leonel Altamirano Mora. • Eng. Maribel Pacheco Ramos. • Eng. Carlos Ochoa Salinas. • Eng. Adriana M. Hernández Correa. • Eng. Daniel Pedro Rubio Ortega. • BSA. Victoria Brunhuber Estrada. • Eng. Maximiliano Castellanos Andrade. Thanks to the Instituto Tecnológico y de Estudios Superiores de Monterrey Campus Ciudad de México for giving me access to the facilities and resources necessary to carry out the project. Thanks to the Centro de Investigación en Microsistemas y Biodiseño (CIMB) to provide the resources necessary for the realization of this work. Thanks to TROnik Edificios Inteligentes for their support and equipment donations for the development of the current research and the integration with the KNX standard. To the Colegio y Proyectos en Microelectrónica (CPM) for their support, technical advice and training. iv.
(5) I would like to express my deepest gratitude to all those who have been side by side with me, along the long, but also short hours, at night.. v.
(6) Dedication. To my parents Sergio Navarro Barrientos and Hildegard Tuch Alemán who with their unconditional support and support have accompanied me throughout this stage and all the previous phases. For me it is an emotional support in the moments of greatest need or of greater confusion, as well as a source of inspiration To my brother whose curiosity and enthusiasm infects and inspires me constantly, leading me to question and inquire beyond the obvious and immediate To my grandmother Hilda Yolanda Alemán who has always been willing to help me and support me when I have required and whose affection has allowed me to serve as a better person. To PhD. Martin Rogelio Bustamante Bello whose guide and support allowed me to go on even in the darkest or most deplorable moments throughout the research period To my fellow PhD students Roberto Avila Vázquez, Javier Izquierdo Reyes, Luis Alberto Curiel Ramı́rez and Ariel Alejandro López Aguilar who not only supported me when I stumbled, but were always willing to give me a hand and an ear in order to allow me to investigate and discover new methods and horizons in research. To my friends José Carlos Alcántara Beltrán, Enrique Garcı́a Cisneros, Azucena Libertad Garcı́a Cisneros, Juan Manuel Velasco Suarez and Renée Denyse Labardini Ramı́rez whose support and motivation have allowed me to overcome turbulence in my life and whose constant challenge inspires me to overcome the day to day.. Thank you for all your confidence, support, patience and unconditional encouragement. Were my main motivation to drive this work. vi.
(7) Abstract. The emotional domotics that is a concept developed by our research team seeks to integrate the subject or user of an inhabitable space as central element for the modulation and control of the environmental variables in a house automation implementation. This research proposed working with an influence on the subject emotional and physiological state, presenting an approach to state the subjects analysis when the light hue, temperature, and humidity are varied. The first experimental results led to the finding of the emotional response time dynamics. Such dynamics were important for further design and implementation of the control loops in-house automation systems for emotion modulation. Throughout this document, the details and progress of the research in emotional domotics, with the aim of developing a controlled algorithm for living space based on the user’s emotional state, will be illustrated and detailed. This project is centered on domotics (home automation) systems, which is, a set of elements installed, interconnected and controlled by a computer system. After introducing the investigation’s core, general preview, and the experimentś description conducted with light hue variation. After the first experiments that led to the emotional response time dynamics. further research was developed in order to acquire and communicate the control system and to process and recover the physiological variables. The final sections of the work present a final experiment in which together the variables of temperature, humidity, and light intensity were applied to a more complete testing methodology. Which led to the final correlation equations for each of five basic emotions selected. These equations may allow us to propose an initial plant model for a control system to be developed by future researchers.. vii.
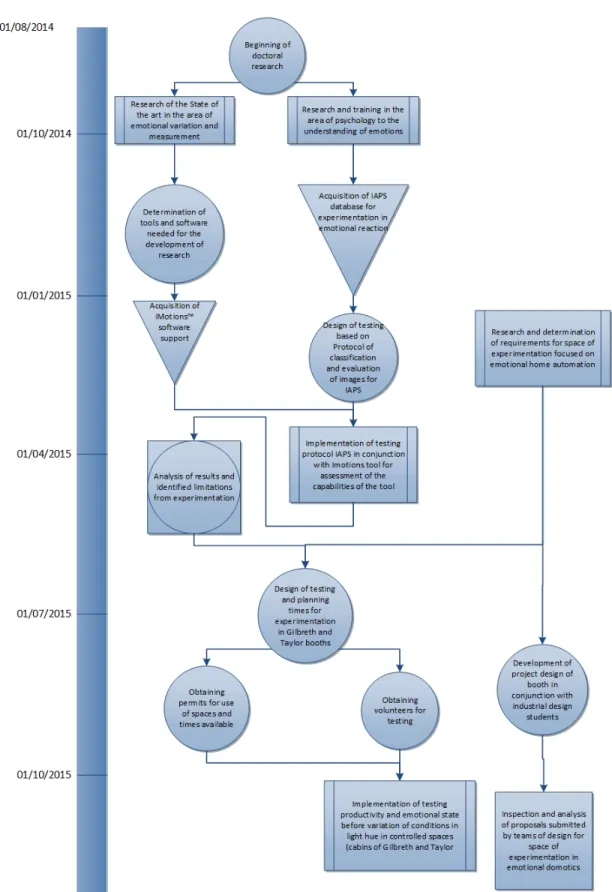
(8) Contents 1. 2. Introduction 1.1 Motivation . . . . . . . . . . . . . . . . . . . . . . 1.2 Problem description and context . . . . . . . . . . 1.3 State-of-the-art . . . . . . . . . . . . . . . . . . . 1.3.1 First Approach . . . . . . . . . . . . . . . 1.3.2 KNX and House Automation . . . . . . . . 1.3.3 House Automation and Comfort . . . . . . 1.3.4 Emotional recognition and implementations 1.4 Related work . . . . . . . . . . . . . . . . . . . . 1.4.1 Facial recognition . . . . . . . . . . . . . . 1.4.2 Emotion recognition . . . . . . . . . . . . 1.4.3 House automation (Domotics) . . . . . . . 1.5 Research Question . . . . . . . . . . . . . . . . . 1.6 Solution Overview . . . . . . . . . . . . . . . . .. . . . . . . . . . . . . .. . . . . . . . . . . . . .. . . . . . . . . . . . . .. . . . . . . . . . . . . .. . . . . . . . . . . . . .. . . . . . . . . . . . . .. . . . . . . . . . . . . .. . . . . . . . . . . . . .. . . . . . . . . . . . . .. . . . . . . . . . . . . .. . . . . . . . . . . . . .. Development 2.1 Training and first implementations of the iMotions™tool . . . . . . . . 2.1.1 Summary of activities with iMotions™ . . . . . . . . . . . . . 2.1.2 Training and learning activities . . . . . . . . . . . . . . . . . . 2.1.3 Assembly and implementation of experiments . . . . . . . . . . 2.1.4 Presentations and demonstrations . . . . . . . . . . . . . . . . 2.1.5 Learning about the technical functioning of the system . . . . . 2.1.6 Feedback of activities carried out . . . . . . . . . . . . . . . . 2.2 Progress learning of the first third of the research project . . . . . . . . 2.2.1 Diagram of activities and progress of the research start-up . . . 2.3 First proposals for modelling and control of the project . . . . . . . . . 2.3.1 Control system modelling for thermal variables . . . . . . . . . 2.3.2 First approach to the development of a humidity control system 2.4 iMotions™API with MATLAB™connection for data pre-processing . . 2.4.1 Processing code development . . . . . . . . . . . . . . . . . . 2.4.2 Communication between iMotions™and Simulink™ . . . . . . 2.4.3 Feedback Simulink™to iMotions™ . . . . . . . . . . . . . . . 2.5 Testing booth prototyping and design . . . . . . . . . . . . . . . . . . . 2.5.1 Considerations and analysis of first team proposal . . . . . . . .. viii. . . . . . . . . . . . . .. . . . . . . . . . . . . . . . . . .. . . . . . . . . . . . . .. . . . . . . . . . . . . . . . . . .. . . . . . . . . . . . . .. . . . . . . . . . . . . . . . . . .. . . . . . . . . . . . . .. . . . . . . . . . . . . . . . . . .. . . . . . . . . . . . . .. . . . . . . . . . . . . . . . . . .. . . . . . . . . . . . . .. . . . . . . . . . . . . . . . . . .. . . . . . . . . . . . . .. . . . . . . . . . . . . . . . . . .. . . . . . . . . . . . . .. . . . . . . . . . . . . . . . . . .. . . . . . . . . . . . . .. . . . . . . . . . . . . . . . . . .. . . . . . . . . . . . . .. . . . . . . . . . . . . . . . . . .. . . . . . . . . . . . . .. . . . . . . . . . . . . . . . . . .. . . . . . . . . . . . . .. . . . . . . . . . . . . . . . . . .. . . . . . . . . . . . . .. . . . . . . . . . . . . . . . . . .. . . . . . . . . . . . . .. . . . . . . . . . . . . . . . . . .. . . . . . . . . . . . . .. 1 2 3 4 4 5 6 9 10 10 11 13 15 15. . . . . . . . . . . . . . . . . . .. 17 17 17 17 18 18 19 21 21 21 24 24 33 42 43 45 52 56 58.
(9) 2.6 2.7. 2.8. 3. 4. 2.5.2 Considerations and analysis of second team proposal . . . . . . . . . . . . . . . . . . . . . Instrumentation of the testing with elements of standard KNX™ . . . . . . . . . . . . . . . . . . . 2.6.1 Programming modules in Engineering TOOL SOFTWARE 5 (ETS5™) . . . . . . . . . . . Re adaptation of iMotions™to Simulink™communication system for the acquisition, processing and selection of sensor signals . . . . . . . . . . . . . . . . . . . . . . . . . . . . . . . . . . . . . 2.7.1 Data transmission test via iMotions™API . . . . . . . . . . . . . . . . . . . . . . . . . . . 2.7.2 Processing, capturing, retention and data projection in Simulink™ . . . . . . . . . . . . . . 2.7.3 Preliminary experimental tests to verify the functioning of the data acquisition systems in a real environment . . . . . . . . . . . . . . . . . . . . . . . . . . . . . . . . . . . . . . . . 2.7.4 Experimental tests in testing booth of emotional domotics with variations of environment for generation of test database . . . . . . . . . . . . . . . . . . . . . . . . . . . . . . . . . 2.7.5 Input and neural network structure for future training and control system . . . . . . . . . . Modeling of emotional control and environmental control . . . . . . . . . . . . . . . . . . . . . . . 2.8.1 First approach to the model of interpretation and control of the emotional state . . . . . . .. Initial Experimentation and Results 3.1 Experimentation in GILBRETH and TAYLOR testing booths . . . . . . . . . . . . . . . . . . . 3.1.1 Planning and preparation of tests . . . . . . . . . . . . . . . . . . . . . . . . . . . . . . 3.1.2 Tests development . . . . . . . . . . . . . . . . . . . . . . . . . . . . . . . . . . . . . 3.1.3 Preliminary analysis of the results . . . . . . . . . . . . . . . . . . . . . . . . . . . . . 3.1.4 Experimental model . . . . . . . . . . . . . . . . . . . . . . . . . . . . . . . . . . . . 3.1.5 Statistical analysis of the results . . . . . . . . . . . . . . . . . . . . . . . . . . . . . . 3.1.6 Conclusions and future work of the experiment in the Gilbreth and Taylor testing booths Final experiment for model of relationship between emotions and environmental variables 4.1 Identification of interest groups for the final model and implementation . . . . . . . . . . 4.1.1 Interest group cards for emotional Domotics . . . . . . . . . . . . . . . . . . . . . 4.2 Experiment design . . . . . . . . . . . . . . . . . . . . . . . . . . . . . . . . . . . . . . 4.3 Final Experiment Timeline Emotional domotics . . . . . . . . . . . . . . . . . . . . . . . 4.4 Process maps . . . . . . . . . . . . . . . . . . . . . . . . . . . . . . . . . . . . . . . . . 4.4.1 Process Documentation . . . . . . . . . . . . . . . . . . . . . . . . . . . . . . . . 4.4.2 Process Time Studies . . . . . . . . . . . . . . . . . . . . . . . . . . . . . . . . . 4.5 Experimental Results . . . . . . . . . . . . . . . . . . . . . . . . . . . . . . . . . . . . . 4.5.1 Joy Results . . . . . . . . . . . . . . . . . . . . . . . . . . . . . . . . . . . . . . 4.5.2 Disgust Results . . . . . . . . . . . . . . . . . . . . . . . . . . . . . . . . . . . . 4.5.3 Anger Results . . . . . . . . . . . . . . . . . . . . . . . . . . . . . . . . . . . . . 4.5.4 Fear Results . . . . . . . . . . . . . . . . . . . . . . . . . . . . . . . . . . . . . . 4.5.5 Sadness Results . . . . . . . . . . . . . . . . . . . . . . . . . . . . . . . . . . . . 4.6 Results’ interpretation method . . . . . . . . . . . . . . . . . . . . . . . . . . . . . . . . 4.6.1 Analysis of Variance (ANOVA) interpretation . . . . . . . . . . . . . . . . . . . . 4.6.2 Model Summary Interpretation . . . . . . . . . . . . . . . . . . . . . . . . . . . . 4.6.3 Encoded coefficients and regression equation in unencrypted coefficients . . . . . 4.6.4 Adjustment and diagnosis for unusual observations . . . . . . . . . . . . . . . . . 4.6.5 Graphs . . . . . . . . . . . . . . . . . . . . . . . . . . . . . . . . . . . . . . . . ix. . . . . . . . . . . . . . . . . . . .. . . . . . . . . . . . . . . . . . . .. . . . . . . . . . . . . . . . . . . .. . . . . . . .. . . . . . . . . . . . . . . . . . . .. 60 61 62 66 67 68 75 77 79 80 80. . . . . . . .. 88 88 88 89 91 92 93 96. . . . . . . . . . . . . . . . . . . .. 97 97 98 100 101 102 106 110 116 118 132 146 160 173 187 187 191 192 193 194.
(10) 5. Discussion of the results 197 5.1 General Model . . . . . . . . . . . . . . . . . . . . . . . . . . . . . . . . . . . . . . . . . . . . . 198 5.2 Collection of key results . . . . . . . . . . . . . . . . . . . . . . . . . . . . . . . . . . . . . . . . 201 5.3 Conclusion . . . . . . . . . . . . . . . . . . . . . . . . . . . . . . . . . . . . . . . . . . . . . . . 205. A List of Equations. 217. B Important Contributors and project Logos. 219. C Temperature conversion table to thermal sensation by effect of humidity. 220. D General research diagram of emotional domotic D.0.1 Research Diagram facial recognition . . . . . . . . . . . . . . . . . . . . . . . . D.0.2 Research Diagram facial recognition. Database and implementation requirements D.0.3 Emotional recognition Research diagram . . . . . . . . . . . . . . . . . . . . . D.0.4 Domotics Research Diagram . . . . . . . . . . . . . . . . . . . . . . . . . . . .. 222 224 226 227 230. . . . .. . . . .. . . . .. . . . .. . . . .. . . . .. E Experimentation on Gilbreth and Taylor testing booths informed consent. 231. F Testing booth Proposals Diagrams and slides 238 F.1 Slides and diagrams team 1 proposal . . . . . . . . . . . . . . . . . . . . . . . . . . . . . . . . . . 239 F.2 Slides and diagrams team 2 proposal . . . . . . . . . . . . . . . . . . . . . . . . . . . . . . . . . . 241 G Key terms references list. 242. H Action Units (AU) table for FACET Module. 243. I. . . . . . . .. 244 244 246 251 256 261 266 266. . . . .. 268 268 272 274 275. J. Programs for recovery and processing of iMotions™signals I.1 Code Block “Concatenate and identification of marks” . . . . . . I.2 UTF-8 conversion and main signals recovery Emotient FACET . . I.3 UTF-8 conversion and main signals recovery Emotiv EEG . . . . I.4 UTF-8 conversion and main signals recovery Shimmer GSR . . . I.5 UTF-8 conversion and main signals recovery Emotiv AFFECTIVA I.6 Hold function . . . . . . . . . . . . . . . . . . . . . . . . . . . . I.7 Data export to an excel file . . . . . . . . . . . . . . . . . . . . . Final Experiment documentation J.1 Informed Consent letter int it’s original language . . . . . J.2 Test table for Final Experiment based on BOX-BEHNKEN J.3 Final Experiments record table . . . . . . . . . . . . . . . J.4 Test table for Final Experiment Registry complete . . . . .. K Final experiment static stimuli. . . . .. . . . .. . . . .. . . . .. . . . . . . .. . . . .. . . . . . . .. . . . .. . . . . . . .. . . . .. . . . . . . .. . . . .. . . . . . . .. . . . .. . . . . . . .. . . . .. . . . . . . .. . . . .. . . . . . . .. . . . .. . . . . . . .. . . . .. . . . . . . .. . . . .. . . . . . . .. . . . .. . . . . . . .. . . . .. . . . . . . .. . . . .. . . . . . . .. . . . .. . . . . . . .. . . . .. . . . . . . .. . . . .. . . . . . . .. . . . .. 278. L Final experiment results for peak evidence 280 L.1 Experimental results for Joy emotion . . . . . . . . . . . . . . . . . . . . . . . . . . . . . . . . . . 280 L.2 Experimental results for Disgust emotion . . . . . . . . . . . . . . . . . . . . . . . . . . . . . . . 287 x.
(11) L.3 Experimental results for Anger emotion . . . . . . . . . . . . . . . . . . . . . . . . . . . . . . . . 294 L.4 Experimental results for Fear emotion . . . . . . . . . . . . . . . . . . . . . . . . . . . . . . . . . 301 L.5 Experimental results for Sadness emotion . . . . . . . . . . . . . . . . . . . . . . . . . . . . . . . 308 M Self Assessment Manikin. 315. N Publications 317 N.1 Main Author . . . . . . . . . . . . . . . . . . . . . . . . . . . . . . . . . . . . . . . . . . . . . . . 317 N.1.1 Croatia ACEX 2016 Poster . . . . . . . . . . . . . . . . . . . . . . . . . . . . . . . . . . . 318 N.1.2 Conference proceedings Intelligent Systems SAI (INTELLISYS) 2016 . . . . . . . . . . . 319 N.1.3 Technical paper International Journal of Interactive Design and Manufacturing (IJIDEM) 2017320 N.1.4 Book chapter Studies in Computational Intelligence 2018 . . . . . . . . . . . . . . . . . . . 321 N.1.5 Accepted for conference International Conference on Mechatronics, Electronics and Automotive Engineering (ICMEAE) 2018 Paper 1 . . . . . . . . . . . . . . . . . . . . . . . . . 322 N.2 Co-Author . . . . . . . . . . . . . . . . . . . . . . . . . . . . . . . . . . . . . . . . . . . . . . . . 323 N.2.1 Croatia ACEX 2016 Poster . . . . . . . . . . . . . . . . . . . . . . . . . . . . . . . . . . . 324 N.2.2 Paper International Journal of Interactive Design and Manufacturing (IJIDEM) 2016 . . . . 325 N.2.3 Conference proceedings International Conference on Current and Future Trends of Information and Communication Technologies in Healthcare (ICTH 2016) . . . . . . . . . . . . 326 N.2.4 Conference proceedings on 6th International Conference on Transportation and Traffic Engineering ICTTE 2017 . . . . . . . . . . . . . . . . . . . . . . . . . . . . . . . . . . . . . 327 N.2.5 Accepted for conference International Conference on Mechatronics, Electronics and Automotive Engineering (ICMEAE) 2018 Paper 2 . . . . . . . . . . . . . . . . . . . . . . . . . 328 N.2.6 Accepted for conference International Conference on Mechatronics, Electronics and Automotive Engineering (ICMEAE) 2018 Paper 3 . . . . . . . . . . . . . . . . . . . . . . . . . 329 N.2.7 Accepted for conference International Conference on Mechatronics, Electronics and Automotive Engineering (ICMEAE) 2018 Paper 4 . . . . . . . . . . . . . . . . . . . . . . . . . 330. xi.
(12) List of Tables 2.1 2.2 2.3 2.4 2.5 2.6 2.7. Variables in heating system . . . . . . . . . . . . . . . . . . . . Variables in cooling system . . . . . . . . . . . . . . . . . . . . Air conditioner choosable operating modes . . . . . . . . . . . Threads characteristics of iMotions™API and sensors sampling Chart of thread start and end identification marks . . . . . . . . List of variables recovered by sensors in UTF-8 conversion block Sensor-to-sensor valid frame sizes . . . . . . . . . . . . . . . .. 4.1 4.2 4.3 4.4 4.6 4.5 4.7 4.8 4.9 4.10 4.11. Abstract of experimental design based on BOX-BEHNKEN methodology . . . . . . . . . . . . . . 100 List and description of audiovisual stimuli for Final Experiment test . . . . . . . . . . . . . . . . . 101 Division of work in tasks . . . . . . . . . . . . . . . . . . . . . . . . . . . . . . . . . . . . . . . . 111 My caption . . . . . . . . . . . . . . . . . . . . . . . . . . . . . . . . . . . . . . . . . . . . . . . 111 Determination of timing cycles . . . . . . . . . . . . . . . . . . . . . . . . . . . . . . . . . . . . . 112 Summations determination . . . . . . . . . . . . . . . . . . . . . . . . . . . . . . . . . . . . . . . 112 Observed times registry . . . . . . . . . . . . . . . . . . . . . . . . . . . . . . . . . . . . . . . . . 113 Measured and averaged times . . . . . . . . . . . . . . . . . . . . . . . . . . . . . . . . . . . . . . 113 Normal times (TN) . . . . . . . . . . . . . . . . . . . . . . . . . . . . . . . . . . . . . . . . . . . 115 Standardization of times based on the International Labour Office (ILO) . . . . . . . . . . . . . . . 116 Nomenclature of input variables in the equations of relationship between emotions and environmental variables . . . . . . . . . . . . . . . . . . . . . . . . . . . . . . . . . . . . . . . . . . . . . . . 117 Nomenclature of output variables in the equations of relationship between emotions and environmental variables . . . . . . . . . . . . . . . . . . . . . . . . . . . . . . . . . . . . . . . . . . . . . 117 Table of Analysis of Variance (ANOVA) for the regression model of Joy through back propagation . 119 Model statistics summary For the back propagation acquisition . . . . . . . . . . . . . . . . . . . . 120 Table of coded coefficients for the Joy model by back propagation . . . . . . . . . . . . . . . . . . 121 Table of adjust and diagnose for unusual observations . . . . . . . . . . . . . . . . . . . . . . . . . 122 Table of Analysis of Variance (ANOVA) for the regression model of JOY through term inclusion . . 126 Model statistics summary for the term inclusion acquisition . . . . . . . . . . . . . . . . . . . . . . 127 Table of coded coefficients for the Joy model by term inclusion . . . . . . . . . . . . . . . . . . . . 128 Table of adjust and diagnose for unusual observations . . . . . . . . . . . . . . . . . . . . . . . . . 129 Table of Analysis of Variance (ANOVA) for the regression model of Disgust through back propagation133 Model statistics summary for the back propagation acquisition . . . . . . . . . . . . . . . . . . . . 134 Table of coded coefficients for the Disgust model by back propagation . . . . . . . . . . . . . . . . 135 Table of adjust and diagnose for unusual observations . . . . . . . . . . . . . . . . . . . . . . . . . 136 Table of Analysis of Variance (ANOVA) for the regression model of Joy through term inclusion . . 140. 4.12 4.13 4.14 4.15 4.16 4.17 4.18 4.19 4.20 4.21 4.22 4.23 4.24 4.25. xii. . . . . . . .. . . . . . . .. . . . . . . .. . . . . . . .. . . . . . . .. . . . . . . .. . . . . . . .. . . . . . . .. . . . . . . .. . . . . . . .. . . . . . . .. . . . . . . .. . . . . . . .. . . . . . . .. . . . . . . .. . . . . . . .. . . . . . . .. . . . . . . .. . . . . . . .. 29 30 65 67 70 72 72.
(13) 4.26 4.27 4.28 4.29 4.30 4.31 4.32 4.33 4.34 4.35 4.36 4.37 4.38 4.39 4.40 4.41 4.42 4.43 4.44 4.45 4.46 4.47 4.48 4.49 4.50 4.51 4.52 4.53 4.54 4.55. Model statistics summary for the term inclusion acquisition . . . . . . . . . . . . . . . . . . . . . . 141 Table of coded coefficients for the Disgust model by term inclusion . . . . . . . . . . . . . . . . . . 142 Table of adjust and diagnose for unusual observations . . . . . . . . . . . . . . . . . . . . . . . . . 143 Table of Analysis of Variance (ANOVA) for the regression model of Anger through back propagation 147 Model statistics summary for the back propagation acquisition . . . . . . . . . . . . . . . . . . . . 148 Table of coded coefficients for the Anger model by back propagation . . . . . . . . . . . . . . . . . 148 Table of adjust and diagnose for unusual observations . . . . . . . . . . . . . . . . . . . . . . . . . 149 Table of Analysis of Variance (ANOVA) for the regression model of Anger through term inclusion . 154 Model statistics summary for the term inclusion acquisition . . . . . . . . . . . . . . . . . . . . . . 155 Table of coded coefficients for the Anger model by term inclusion . . . . . . . . . . . . . . . . . . 155 Table of adjust and diagnose for unusual observations . . . . . . . . . . . . . . . . . . . . . . . . . 156 Table of Analysis of Variance (ANOVA) for the regression model of Fear through back propagation 161 Model statistics summary for the back propagation acquisition . . . . . . . . . . . . . . . . . . . . 162 Table of coded coefficients for the Disgust model by back propagation . . . . . . . . . . . . . . . . 162 Table of adjust and diagnose for unusual observations . . . . . . . . . . . . . . . . . . . . . . . . . 163 Table of Analysis of Variance (ANOVA) for the regression model of Fear through term inclusion . . 167 Model statistics summary for the term inclusion acquisition . . . . . . . . . . . . . . . . . . . . . . 168 Table of coded coefficients for the Disgust model by term inclusion . . . . . . . . . . . . . . . . . . 168 Table of adjust and diagnose for unusual observations . . . . . . . . . . . . . . . . . . . . . . . . . 169 Table of Analysis of Variance (ANOVA) for the regression model of Sadness through back propagation174 Model statistics summary for the back propagation acquisition . . . . . . . . . . . . . . . . . . . . 175 Table of coded coefficients for the Disgust model by back propagation . . . . . . . . . . . . . . . . 176 Table of adjust and diagnose for unusual observations . . . . . . . . . . . . . . . . . . . . . . . . . 177 Table of Analysis of Variance (ANOVA) for the regression model of Sadness through term inclusion 181 Model statistics summary for the term inclusion acquisition . . . . . . . . . . . . . . . . . . . . . . 182 Table of coded coefficients for the Sadness model by term inclusion . . . . . . . . . . . . . . . . . 183 Table of adjust and diagnose for unusual observations . . . . . . . . . . . . . . . . . . . . . . . . . 184 Notation of terms for calculating freedom degrees (DF) in ANOVA table . . . . . . . . . . . . . . . 188 Notation of terms for calculation of average square error for implementation in obtaining of Fvalue . 190 Variance Inflation factor Interpretation table . . . . . . . . . . . . . . . . . . . . . . . . . . . . . . 193. 5.1 5.2 5.3. General Model Coefficients and terms description . . . . . . . . . . . . . . . . . . . . . . . . . . . 200 Compilation of key statistical data from acquired models . . . . . . . . . . . . . . . . . . . . . . . 204 Collection of residue analysis data and unusual observations for the ten models obtained . . . . . . 205. C.1 Temperature conversion table to thermal sensation by effect of humidity . . . . . . . . . . . . . . . 221 H.1 Table of Action Units (AU) used to define the expressions analyzed by the FACET module in iMotions™ . . . . . . . . . . . . . . . . . . . . . . . . . . . . . . . . . . . . . . . . . . . . . . . . . . 243 J.2. Final Experiment record table . . . . . . . . . . . . . . . . . . . . . . . . . . . . . . . . . . . . . 277. L.1 Joy extraction of peak values from final experiment . . . . . . . . . . . . . . . . . . . . . . . . . . 287 L.2 Disgust extraction of peak values from final experiment . . . . . . . . . . . . . . . . . . . . . . . . 294. xiii.
(14) L.3 Anger extraction of peak values from final experiment . . . . . . . . . . . . . . . . . . . . . . . . . 301 L.4 Fear extraction of peak values from final experiment . . . . . . . . . . . . . . . . . . . . . . . . . 307 L.5 Sadness extraction of peak values from final experiment . . . . . . . . . . . . . . . . . . . . . . . . 314. xiv.
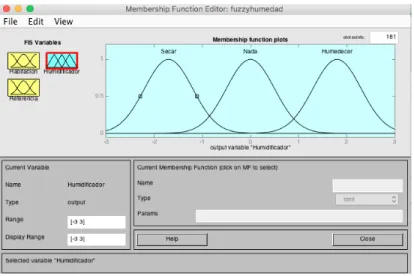
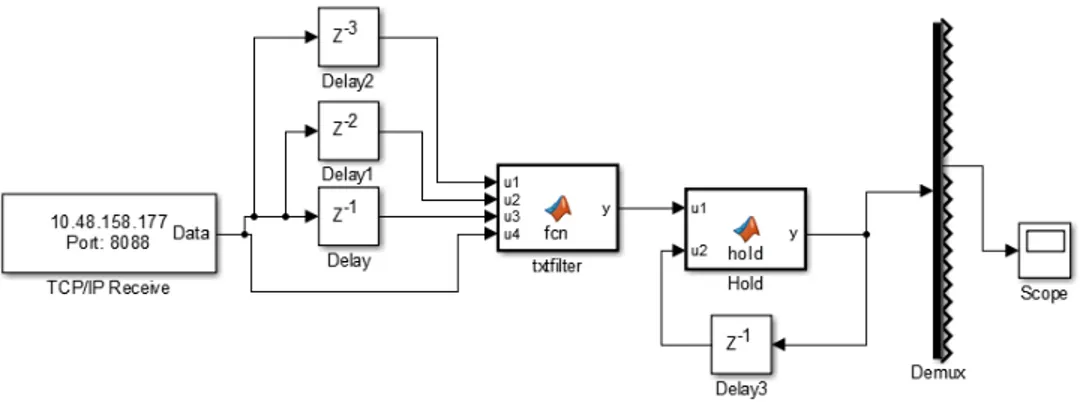
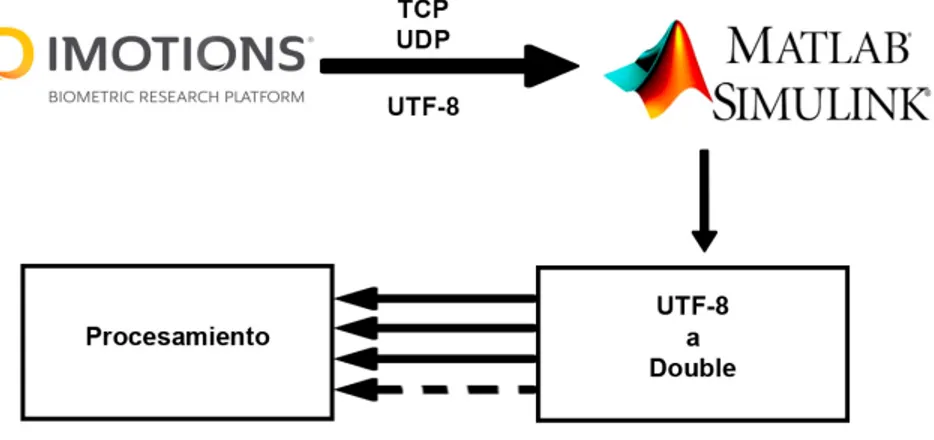
(15) List of Figures 1.1 1.2. Operation diagram of an object recognition algorithm . . . . . . . . . . . . . . . . . . . . . . . . . General structure of the solution and Environment proposed . . . . . . . . . . . . . . . . . . . . .. 12 16. 2.1 2.2 2.3 2.4 2.5 2.6 2.7 2.8 2.9 2.10 2.11 2.12 2.13 2.14 2.15 2.16 2.17 2.18 2.19 2.20 2.21 2.22 2.23 2.24 2.25 2.26 2.27 2.28 2.29 2.30 2.31 2.32. Progress of the first third of the project diagram . . . . . . . . . . . Theoretical Temperature control system through heater . . . . . . . Thermostat subsystem composition . . . . . . . . . . . . . . . . . . Heater subsystem composition . . . . . . . . . . . . . . . . . . . . Booth subsystem composition . . . . . . . . . . . . . . . . . . . . Theoretical temperature control system; cooler . . . . . . . . . . . Composition of the cooling subsystem . . . . . . . . . . . . . . . . Full Temperature Control Simulation system . . . . . . . . . . . . . Modified thermostat block for integration . . . . . . . . . . . . . . Integrated Booth Block . . . . . . . . . . . . . . . . . . . . . . . . Model Explorer for integrated environmental control modeling . . . Psychometric diagram . . . . . . . . . . . . . . . . . . . . . . . . Integrated humidity control system . . . . . . . . . . . . . . . . . . Humidity control system generator block . . . . . . . . . . . . . . . Reference humidity simulator block . . . . . . . . . . . . . . . . . Room control block composition . . . . . . . . . . . . . . . . . . . humidifier humidity converter . . . . . . . . . . . . . . . . . . . . Internal humidity converter . . . . . . . . . . . . . . . . . . . . . . Humidifier actuator block . . . . . . . . . . . . . . . . . . . . . . . Fuzzy control design screen . . . . . . . . . . . . . . . . . . . . . . Membership functions editor . . . . . . . . . . . . . . . . . . . . . Membership function for room humidity entry . . . . . . . . . . . . Membership function for reference humidity input . . . . . . . . . . Function of memberships for the output of the humidifier . . . . . . Control rules . . . . . . . . . . . . . . . . . . . . . . . . . . . . . Results storage variables . . . . . . . . . . . . . . . . . . . . . . . valid pre-processed data capture . . . . . . . . . . . . . . . . . . . Extraction of interest time periods . . . . . . . . . . . . . . . . . . Extraction values for processing in periods to be analyzed . . . . . . TCP/IP Data receiver in Symulink for data collection . . . . . . . . Data capture diagram using the iMotions™API module to Matlab™ Global settings window for iMotions API . . . . . . . . . . . . . .. 23 25 27 27 28 29 30 31 31 32 33 34 35 36 36 37 37 38 38 39 39 40 41 41 42 43 44 44 45 45 46 47. xv. . . . . . . . . . . . . . . . . . . . . . . . . . . . . . . . .. . . . . . . . . . . . . . . . . . . . . . . . . . . . . . . . .. . . . . . . . . . . . . . . . . . . . . . . . . . . . . . . . .. . . . . . . . . . . . . . . . . . . . . . . . . . . . . . . . .. . . . . . . . . . . . . . . . . . . . . . . . . . . . . . . . .. . . . . . . . . . . . . . . . . . . . . . . . . . . . . . . . .. . . . . . . . . . . . . . . . . . . . . . . . . . . . . . . . .. . . . . . . . . . . . . . . . . . . . . . . . . . . . . . . . .. . . . . . . . . . . . . . . . . . . . . . . . . . . . . . . . .. . . . . . . . . . . . . . . . . . . . . . . . . . . . . . . . .. . . . . . . . . . . . . . . . . . . . . . . . . . . . . . . . .. . . . . . . . . . . . . . . . . . . . . . . . . . . . . . . . .. . . . . . . . . . . . . . . . . . . . . . . . . . . . . . . . .. . . . . . . . . . . . . . . . . . . . . . . . . . . . . . . . .. . . . . . . . . . . . . . . . . . . . . . . . . . . . . . . . .. . . . . . . . . . . . . . . . . . . . . . . . . . . . . . . . .. . . . . . . . . . . . . . . . . . . . . . . . . . . . . . . . ..
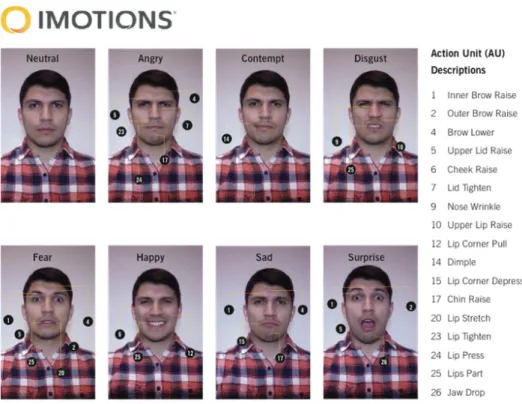
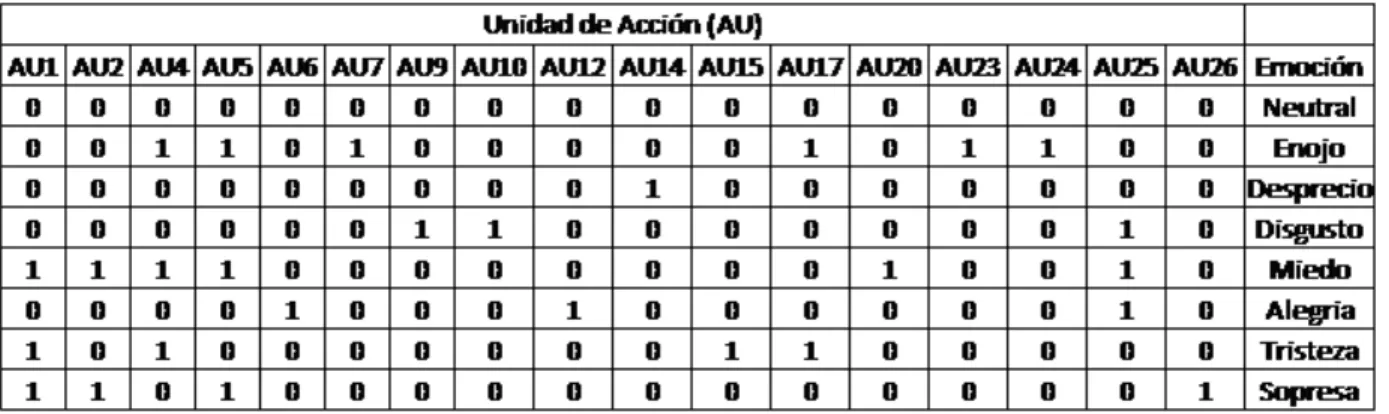
(16) 2.33 2.34 2.35 2.36 2.37 2.38 2.39 2.40 2.41 2.42 2.43 2.44 2.45 2.46 2.47 2.48 2.49 2.50 2.51 2.52 2.53 2.54 2.55 2.56 2.57 2.58 2.59 2.60 2.61 2.62 2.63 2.64 2.65 2.66 2.67 2.68 2.69 2.70 2.71 2.72 2.73 2.74. TCP/IP block configuration window . . . . . . . . . . . . . . . . . . . . . . . . . . . . . . . . . . Receiving model data iMotions™API to Matlab™ . . . . . . . . . . . . . . . . . . . . . . . . . . Vector statement and start mark tracking . . . . . . . . . . . . . . . . . . . . . . . . . . . . . . . . Trace separation of marks and end of vectors . . . . . . . . . . . . . . . . . . . . . . . . . . . . . TEXT2NUM function part one . . . . . . . . . . . . . . . . . . . . . . . . . . . . . . . . . . . . . TEXT2NUM function part two . . . . . . . . . . . . . . . . . . . . . . . . . . . . . . . . . . . . . Retainer for invalid values . . . . . . . . . . . . . . . . . . . . . . . . . . . . . . . . . . . . . . . Retainer block . . . . . . . . . . . . . . . . . . . . . . . . . . . . . . . . . . . . . . . . . . . . . . Matlab™to iMotions™feedback diagram . . . . . . . . . . . . . . . . . . . . . . . . . . . . . . . XML code for iMotions™feedback . . . . . . . . . . . . . . . . . . . . . . . . . . . . . . . . . . Output blocks from Matlab™to iMotions™ . . . . . . . . . . . . . . . . . . . . . . . . . . . . . . Number to UTF-8 conversor first part . . . . . . . . . . . . . . . . . . . . . . . . . . . . . . . . . Number to UTF-8 conversor second part . . . . . . . . . . . . . . . . . . . . . . . . . . . . . . . . Obtaining division and Surplus vector K . . . . . . . . . . . . . . . . . . . . . . . . . . . . . . . . XML selection for input of events . . . . . . . . . . . . . . . . . . . . . . . . . . . . . . . . . . . Correct operation IMOTIONS™API input . . . . . . . . . . . . . . . . . . . . . . . . . . . . . . . Data capture test for external events . . . . . . . . . . . . . . . . . . . . . . . . . . . . . . . . . . Location of luminaries and loudspeakers team 1 (left) distribution and type of sensors proposed team 2 (right) . . . . . . . . . . . . . . . . . . . . . . . . . . . . . . . . . . . . . . . . . . . . . . . . . First preliminary proposal sketch of Team one . . . . . . . . . . . . . . . . . . . . . . . . . . . . . Second preliminary sketch proposal of Team one . . . . . . . . . . . . . . . . . . . . . . . . . . . Final proposal of Team one . . . . . . . . . . . . . . . . . . . . . . . . . . . . . . . . . . . . . . . Import KNXPROD Libraries . . . . . . . . . . . . . . . . . . . . . . . . . . . . . . . . . . . . . . Middle Group action areas for programming . . . . . . . . . . . . . . . . . . . . . . . . . . . . . . Middle Group address of white lights group . . . . . . . . . . . . . . . . . . . . . . . . . . . . . . Object function for luminosity . . . . . . . . . . . . . . . . . . . . . . . . . . . . . . . . . . . . . RGB Group addresses . . . . . . . . . . . . . . . . . . . . . . . . . . . . . . . . . . . . . . . . . . IRSC Controller parameterization . . . . . . . . . . . . . . . . . . . . . . . . . . . . . . . . . . . Air Conditioning Group addresses . . . . . . . . . . . . . . . . . . . . . . . . . . . . . . . . . . . IRSC Module Status Parameters window . . . . . . . . . . . . . . . . . . . . . . . . . . . . . . . . Group addresses Multi-sensor JUNG . . . . . . . . . . . . . . . . . . . . . . . . . . . . . . . . . . Multi-sensor Object functions . . . . . . . . . . . . . . . . . . . . . . . . . . . . . . . . . . . . . Light intensity sensor Group direction . . . . . . . . . . . . . . . . . . . . . . . . . . . . . . . . . Presence and luminosity sensor object function . . . . . . . . . . . . . . . . . . . . . . . . . . . . Caption . . . . . . . . . . . . . . . . . . . . . . . . . . . . . . . . . . . . . . . . . . . . . . . . . Caption . . . . . . . . . . . . . . . . . . . . . . . . . . . . . . . . . . . . . . . . . . . . . . . . . Caption . . . . . . . . . . . . . . . . . . . . . . . . . . . . . . . . . . . . . . . . . . . . . . . . . Caption . . . . . . . . . . . . . . . . . . . . . . . . . . . . . . . . . . . . . . . . . . . . . . . . . Caption . . . . . . . . . . . . . . . . . . . . . . . . . . . . . . . . . . . . . . . . . . . . . . . . . Caption . . . . . . . . . . . . . . . . . . . . . . . . . . . . . . . . . . . . . . . . . . . . . . . . . Caption . . . . . . . . . . . . . . . . . . . . . . . . . . . . . . . . . . . . . . . . . . . . . . . . . Caption . . . . . . . . . . . . . . . . . . . . . . . . . . . . . . . . . . . . . . . . . . . . . . . . . Neural Network tested model for open loop control . . . . . . . . . . . . . . . . . . . . . . . . . . xvi. 48 48 49 50 51 51 52 52 53 53 53 54 54 54 55 55 56 57 58 59 60 62 63 63 63 64 64 64 65 65 66 66 66 68 69 70 70 71 74 74 75 80.
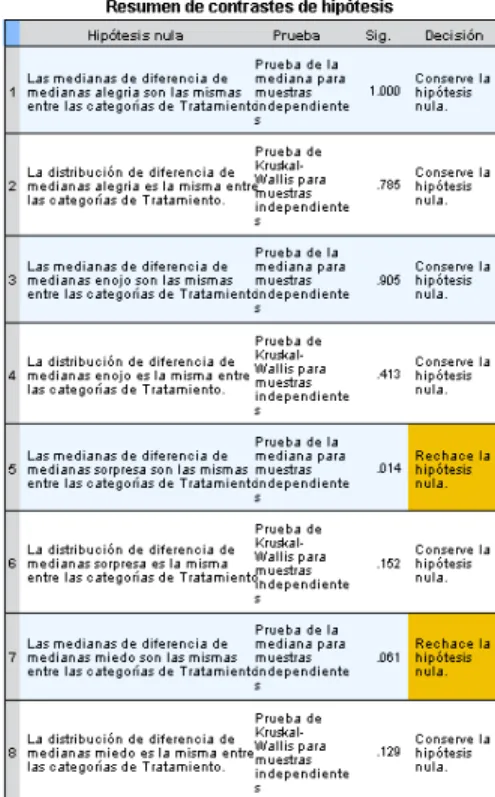
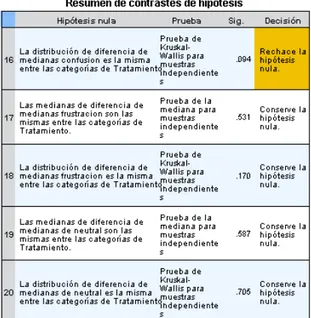
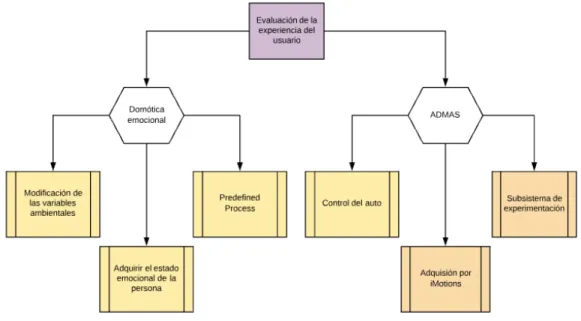
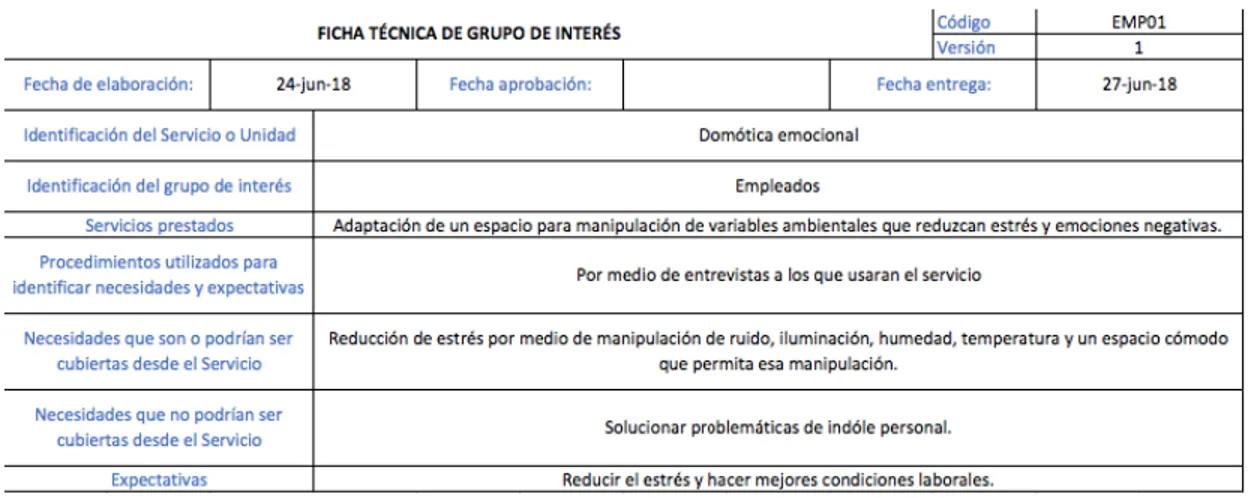
(17) 2.75 2.76 2.77 2.78 2.79 2.80 2.81 2.82 2.83. Relationship between action units and emotions courtesy of the iMotions™manual First proposed control diagram . . . . . . . . . . . . . . . . . . . . . . . . . . . . Membership function for each Action Unit . . . . . . . . . . . . . . . . . . . . . . Membership function for each emotion . . . . . . . . . . . . . . . . . . . . . . . . Table of Action unit relationships evaluated in the FACET with resulting emotions . Emotions membership functions . . . . . . . . . . . . . . . . . . . . . . . . . . . Control diagram second alternative . . . . . . . . . . . . . . . . . . . . . . . . . . Caption . . . . . . . . . . . . . . . . . . . . . . . . . . . . . . . . . . . . . . . . Caption . . . . . . . . . . . . . . . . . . . . . . . . . . . . . . . . . . . . . . . .. 3.1. Kruskal Wallis test Results table and medium testing for independent samples of Gilbreth and Taylor cabins experiments Part 1/3 . . . . . . . . . . . . . . . . . . . . . . . . . . . . . . . . . . . . . . . Kruskal Wallis test Results table and medium testing for independent samples of Gilbreth and Taylor cabins experiments Part 2/3 . . . . . . . . . . . . . . . . . . . . . . . . . . . . . . . . . . . . . . . Kruskal Wallis test Results table and medium testing for independent samples of Gilbreth and Taylor cabins experiments Part 3/3 . . . . . . . . . . . . . . . . . . . . . . . . . . . . . . . . . . . . . . . Graphic behavior of the emotion disgust in initial and final periods of basal state. both periods were of one minute . . . . . . . . . . . . . . . . . . . . . . . . . . . . . . . . . . . . . . . . . . . . . . Significative results of altered emotions in Gilbreth and Taylor cabins experiment . . . . . . . . . .. 3.2 3.3 3.4 3.5 4.1 4.2 4.3 4.4 4.5 4.6 4.7 4.8 4.9 4.10 4.11 4.12 4.13 4.14 4.15. . . . . . . . . .. . . . . . . . . .. . . . . . . . . .. . . . . . . . . .. . . . . . . . . .. . . . . . . . . .. . . . . . . . . .. . . . . . . . . .. . . . . . . . . .. Breakdown of mission and vision of Center of Microsystems and Biodesign of the two main projects of the CIMB (ADMAS and Emotional Domotics) . . . . . . . . . . . . . . . . . . . . . . . . . . . Technical information of the group of interest of employees (and students) for Emotional Domotics Technical data of the owner’s interest group for Emotional Domotics . . . . . . . . . . . . . . . . . Technical data of the interest group of the public sector for Emotional Domotics . . . . . . . . . . . Tentative Gantt Diagram of activities for final experiment . . . . . . . . . . . . . . . . . . . . . . . A diagram of processes involved in the research that evaluates the user experience. The main processes evaluated are the Emotional Domotics and ADMAS. . . . . . . . . . . . . . . . . . . . . . . Diagram of the operating system that relates the inputs and outputs of the major process, with the intermittent sub-processes that allow this output with the corresponding input. . . . . . . . . . . . . Operation system diagram that relates the inputs to the exit of the human conditioning thread; Inside the box are the processes that allow this output . . . . . . . . . . . . . . . . . . . . . . . . . . . . . Diagram of the operating system that relates the inputs to the exit of the booth conditioning subprocess; Inside the box are the processes that allow this output . . . . . . . . . . . . . . . . . . . . . . File of the domotics process, where the current conditions of the process are specified. . . . . . . . File of the human conditioning sub-process, part of the domotics process; The current conditions of the thread are specified . . . . . . . . . . . . . . . . . . . . . . . . . . . . . . . . . . . . . . . . . File of the booth conditioning sub-process, part of the domotics process; The current conditions of the thread are specified. . . . . . . . . . . . . . . . . . . . . . . . . . . . . . . . . . . . . . . . . . Function process diagram of the Emotional Domotics project . . . . . . . . . . . . . . . . . . . . . Westinghouse System Source: Industrial Engineering: Methods, standards and work design . . . . . Normal plot of standardized effects, the values with red marker represent those that have a significant contribution to the model . . . . . . . . . . . . . . . . . . . . . . . . . . . . . . . . . . . . . . . .. xvii. 81 82 82 83 83 85 85 86 87. 93 93 94 95 95. 98 99 99 99 102 103 104 105 105 107 108 108 110 114 122.
(18) 4.16 Pareto Chart of standardized effects, those values exceeding the red line, represent the elements that have a significant contribution to the model . . . . . . . . . . . . . . . . . . . . . . . . . . . . . . 4.17 Array of graphs for visual representation of the residuals related to normal distributions (top left), the residual values versus their fitted value (top right), The histogram to represent the frequency of apparition in each range (bottom left) and the graph of the residuals obtained vs the order of observation (bottom right) . . . . . . . . . . . . . . . . . . . . . . . . . . . . . . . . . . . . . . . 4.18 Summary report for visual report of the residues. The histogram is related to the graph of histograms and represent the normal distribution that best adapts for the data case . . . . . . . . . . . . . . . . 4.19 Normal plot of standardized effects, the values with red marker represent those that have a significant contribution to the model . . . . . . . . . . . . . . . . . . . . . . . . . . . . . . . . . . . . . . . . 4.20 Pareto Chart of standardized effects, those values exceeding the red line, represent the elements that have a significant contribution to the model . . . . . . . . . . . . . . . . . . . . . . . . . . . . . . 4.21 Array of graphs for visual representation of the residuals related to normal distributions (top left), the residual values versus their fitted value (top right), The histogram to represent the frequency of apparition in each range (bottom left) and the graph of the residuals obtained vs the order of observation (bottom right) . . . . . . . . . . . . . . . . . . . . . . . . . . . . . . . . . . . . . . . 4.22 Summary report for visual report of the residues. The histogram is related to the graph of histograms and represent the normal distribution that best adapts for the data case . . . . . . . . . . . . . . . . 4.23 Normal plot of standardized effects, the values with red marker represent those that have a significant contribution to the model . . . . . . . . . . . . . . . . . . . . . . . . . . . . . . . . . . . . . . . . 4.24 Pareto Chart of standardized effects, those values exceeding the red line, represent the elements that have a significant contribution to the model . . . . . . . . . . . . . . . . . . . . . . . . . . . . . . 4.25 Array of graphs for visual representation of the residuals related to normal distributions (top left), the residual values versus their fitted value (top right), The histogram to represent the frequency of apparition in each range (bottom left) and the graph of the residuals obtained vs the order of observation (bottom right) . . . . . . . . . . . . . . . . . . . . . . . . . . . . . . . . . . . . . . . 4.26 Summary report for visual report of the residues. The histogram is related to the graph of histograms and represent the normal distribution that best adapts for the data case . . . . . . . . . . . . . . . . 4.27 Normal plot of standardized effects, the values with red marker represent those that have a significant contribution to the model . . . . . . . . . . . . . . . . . . . . . . . . . . . . . . . . . . . . . . . . 4.28 Pareto Chart of standardized effects, those values exceeding the red line, represent the elements that have a significant contribution to the model . . . . . . . . . . . . . . . . . . . . . . . . . . . . . . 4.29 Array of graphs for visual representation of the residuals related to normal distributions (top left), the residual values versus their fitted value (top right), The histogram to represent the frequency of apparition in each range (bottom left) and the graph of the residuals obtained vs the order of observation (bottom right) . . . . . . . . . . . . . . . . . . . . . . . . . . . . . . . . . . . . . . . 4.30 Summary report for visual report of the residues. The histogram is related to the graph of histograms and represent the normal distribution that best adapts for the data case . . . . . . . . . . . . . . . . 4.31 Normal plot of standardized effects, the values with red marker represent those that have a significant contribution to the model . . . . . . . . . . . . . . . . . . . . . . . . . . . . . . . . . . . . . . . . 4.32 Pareto Chart of standardized effects, those values exceeding the red line, represent the elements that have a significant contribution to the model . . . . . . . . . . . . . . . . . . . . . . . . . . . . . .. xviii. 123. 124 125 129 130. 131 132 137 137. 138 139 144 144. 145 146 150 151.
(19) 4.33 Array of graphs for visual representation of the residuals related to normal distributions (top left), the residual values versus their fitted value (top right), The histogram to represent the frequency of apparition in each range (bottom left) and the graph of the residuals obtained vs the order of observation (bottom right) . . . . . . . . . . . . . . . . . . . . . . . . . . . . . . . . . . . . . . . 4.34 Summary report for visual report of the residues. The histogram is related to the graph of histograms and represent the normal distribution that best adapts for the data case . . . . . . . . . . . . . . . . 4.35 Normal plot of standardized effects, the values with red marker represent those that have a significant contribution to the model . . . . . . . . . . . . . . . . . . . . . . . . . . . . . . . . . . . . . . . . 4.36 Pareto Chart of standardized effects, those values exceeding the red line, represent the elements that have a significant contribution to the model . . . . . . . . . . . . . . . . . . . . . . . . . . . . . . 4.37 Array of graphs for visual representation of the residuals related to normal distributions (top left), the residual values versus their fitted value (top right), The histogram to represent the frequency of apparition in each range (bottom left) and the graph of the residuals obtained vs the order of observation (bottom right) . . . . . . . . . . . . . . . . . . . . . . . . . . . . . . . . . . . . . . . 4.38 Summary report for visual report of the residues. The histogram is related to the graph of histograms and represent the normal distribution that best adapts for the data case . . . . . . . . . . . . . . . . 4.39 Normal plot of standardized effects, the values with red marker represent those that have a significant contribution to the model . . . . . . . . . . . . . . . . . . . . . . . . . . . . . . . . . . . . . . . . 4.40 Pareto Chart of standardized effects, those values exceeding the red line, represent the elements that have a significant contribution to the model . . . . . . . . . . . . . . . . . . . . . . . . . . . . . . 4.41 Array of graphs for visual representation of the residuals related to normal distributions (top left), the residual values versus their fitted value (top right), The histogram to represent the frequency of apparition in each range (bottom left) and the graph of the residuals obtained vs the order of observation (bottom right) . . . . . . . . . . . . . . . . . . . . . . . . . . . . . . . . . . . . . . . 4.42 Summary report for visual report of the residues. The histogram is related to the graph of histograms and represent the normal distribution that best adapts for the data case . . . . . . . . . . . . . . . . 4.43 Normal plot of standardized effects, the values with red marker represent those that have a significant contribution to the model . . . . . . . . . . . . . . . . . . . . . . . . . . . . . . . . . . . . . . . . 4.44 Pareto Chart of standardized effects, those values exceeding the red line, represent the elements that have a significant contribution to the model . . . . . . . . . . . . . . . . . . . . . . . . . . . . . . 4.45 Array of graphs for visual representation of the residuals related to normal distributions (top left), the residual values versus their fitted value (top right), The histogram to represent the frequency of apparition in each range (bottom left) and the graph of the residuals obtained vs the order of observation (bottom right) . . . . . . . . . . . . . . . . . . . . . . . . . . . . . . . . . . . . . . . 4.46 Summary report for visual report of the residues. The histogram is related to the graph of histograms and represent the normal distribution that best adapts for the data case . . . . . . . . . . . . . . . . 4.47 Normal plot of standardized effects, the values with red marker represent those that have a significant contribution to the model . . . . . . . . . . . . . . . . . . . . . . . . . . . . . . . . . . . . . . . . 4.48 Pareto Chart of standardized effects, those values exceeding the red line, represent the elements that have a significant contribution to the model . . . . . . . . . . . . . . . . . . . . . . . . . . . . . .. xix. 152 153 157 158. 159 160 164 164. 165 166 170 171. 172 173 177 178.
(20) 4.49 Array of graphs for visual representation of the residuals related to normal distributions (top left), the residual values versus their fitted value (top right), The histogram to represent the frequency of apparition in each range (bottom left) and the graph of the residuals obtained vs the order of observation (bottom right) . . . . . . . . . . . . . . . . . . . . . . . . . . . . . . . . . . . . . . . 4.50 Summary report for visual report of the residues. The histogram is related to the graph of histograms and represent the normal distribution that best adapts for the data case . . . . . . . . . . . . . . . . 4.51 Normal plot of standardized effects, the values with red marker represent those that have a significant contribution to the model . . . . . . . . . . . . . . . . . . . . . . . . . . . . . . . . . . . . . . . . 4.52 Pareto Chart of standardized effects, those values exceeding the red line, represent the elements that have a significant contribution to the model . . . . . . . . . . . . . . . . . . . . . . . . . . . . . . 4.53 Array of graphs for visual representation of the residuals related to normal distributions (top left), the residual values versus their fitted value (top right), The histogram to represent the frequency of apparition in each range (bottom left) and the graph of the residuals obtained vs the order of observation (bottom right) . . . . . . . . . . . . . . . . . . . . . . . . . . . . . . . . . . . . . . . 4.54 Summary report for visual report of the residues. The histogram is related to the graph of histograms and represent the normal distribution that best adapts for the data case . . . . . . . . . . . . . . . .. 179 180 185 185. 186 187. D.1 D.2 D.3 D.4 D.5 D.6 D.7 D.8 D.9 D.10 D.11. Research general structure diagram . . . . . . . . . . . . . . . . . . . . . . . Facial recognition area general research diagram . . . . . . . . . . . . . . . Facial recognition implemented implementation algorithms and Boosters . . Training Databases most commonly used in the research area . . . . . . . . . Facial recognition system development requirements . . . . . . . . . . . . . Emotion recognition research state of the Art and basic research components Facial expression time dynamics . . . . . . . . . . . . . . . . . . . . . . . . Universal facial expressions according to research of Dr. Paul Ekman . . . . Facial expression recognition systems components and structure . . . . . . . Expression recognition system training and testing databases . . . . . . . . . House automation (domotics) research and important implementation areas .. . . . . . . . . . . .. . . . . . . . . . . .. . . . . . . . . . . .. . . . . . . . . . . .. . . . . . . . . . . .. . . . . . . . . . . .. . . . . . . . . . . .. . . . . . . . . . . .. . . . . . . . . . . .. . . . . . . . . . . .. . . . . . . . . . . .. . . . . . . . . . . .. 223 224 225 226 226 227 228 228 229 229 230. F.1 F.2 F.3 F.4. General diagram of booth first proposal Prototype proposal team 1 . . . . . . . Final slide proposal team 1 . . . . . . . Evidence proposal team 2 . . . . . . . .. . . . .. . . . .. . . . .. . . . .. . . . .. . . . .. . . . .. . . . .. . . . .. . . . .. . . . .. . . . .. 239 239 240 241. J.1. Register of Environmental variables in final experiments and combinations design for the tests . . . 274. . . . .. . . . .. . . . .. . . . .. . . . .. . . . .. . . . .. . . . .. . . . .. . . . .. . . . .. . . . .. . . . .. . . . .. . . . .. . . . .. . . . .. . . . .. . . . .. . . . .. K.1 Final Experiment Neutral Static Stimuli Collection . . . . . . . . . . . . . . . . . . . . . . . . . . 278 K.2 Final Experiment Active Static Stimuli Collection . . . . . . . . . . . . . . . . . . . . . . . . . . . 279 M.1 Self Assessment Manikin for emotional response assessment through a pictorial correlation . . . . . 316. xx.
(21) Chapter 1. Introduction Domotics is understood as a set of elements installed, interconnected and controlled by an either centralized or decentralized system. These systems provide energy management, intercommunication, wellness and security services. Domotics seeks the integration of sensing and control systems in the least intrusive way possible [Coral Lozada, 2014]. With this in mind, this research raises the idea of working with an influence on the mood of subjects. The evaluation of mood of an individual can be made from various strategies, some are of intrusive order, as the monitoring of physiological variables in the subject from sensors carried by it. Other methods are non-intrusive among this the most notorious are the voice analysis [Lutfi et al., 2009] and facial analysis [Ekman and Rosenberg, 1997]. From the point of view of automation, Domotics is an interdisciplinary concept that refers to the integration of the different technologies in the home through the simultaneous use of telecommunications, electronics, informatics and electricity. In addition, its purpose is to improve the quality of life of human beings [Herrera Quintero, 2005]. As we can see the domotics provides us with the necessary tools to allow the flexibility of the use of the different technologies for the control of a space and thus the alteration of the state of the subjects in the controlled space. However, it is due to its interdisciplinary nature that the implementation of this requires the management and knowledge of various areas for optimal implementation. To meet the implementation objectives, the research was previously divided into the three central pillars of this proposal based on emotional analysis from the facial analysis. The three core research areas are worked out further in the following sections. Based on the experiences acquired, it was defined the technical and variable requirements to be manipulated for the experimentation and implementation of the algorithm of control of spaces based on emotions. Once defined as the variables to be controlled desired, the temperature, the relative humidity [Abascal Carranza, 2002b], the luminous intensity [Lozano Alarcon, 2008a], as well as its tonality [Aguayo González, 1999], seeking a thermal and acoustic insulation of the medium (section 2.1.5 and 2.1.6). Two design teams, the challenge of designing a space to carry out the experimental tests, were raised. This space to be designed would have to be a space focused on experimentation which would have an adequate reflection and diffusion of the light inside, the space would allow the isolation of the conditions of illumination and external temperature, i.e.,seek to minimize or eliminate heat exchange as far as possible between the medium and the interior. The space should be optimized for the distribution inside of auditory stimuli. The control of the physical variables inside the cockpit is considered to be controlled from the outside of the cockpit. As additional challenges to the design team were raised the task of designing that the space could be removable, and should have inside with the necessary furniture to allow the test subjects to perform tasks and tests both written and Interaction, either through a screen or a computer. Although the furniture should be ergonomically suitable for the type of tasks, it should be emotionally neutral (i.e.,avoid inducing relaxation or other 1.
(22) 2 alterations in the basal state). A non-intrusive facial analysis system requires the use of computer image recognition and identification, which is one of the most urgent and difficult tasks in this field. This process usually consists of two phases for its implementation. In the first phase the characteristics of the objects are acquired and stored, while in the second one the unknown objects are compared with those stored for their classification [Bui et al., 2012]. The advances made during the first semester included both the analysis of the evaluation tests of the IMotions ™and the corresponding tests with the database of IAPS test stimuli (International Affective Picture System). This period was dedicated on the one hand to the evaluation of the software that conforms the state of the art in terms of emotional analysis, on the other hand, to develop, to the alliances necessary for the implementation of future evaluation strategies. In the report, the findings are detailed, as are the future progress and evaluation strategies. This includes the determination of the evaluation parameters and the design of a test cockpit, this phase, as detailed below implies the inclusion to the project team of the areas of architecture, design and industrial engineering, as well as their Tools for evaluating human productivity in the project.. 1.1. Motivation. Throughout the twentieth century, stress has become a relevant and socially recognized phenomenon, often linked to work and labor activity. As a brief example of such situation, we can find that in 1990, the World Health Organization called stress as ”a global epidemic” (San Jose State University, S.D.) and since then the situation has not improved. The American Association of Psychology reports that in 2011 ”22% of the world’s population said they have extreme stress” (American Psychological Association, S.D.), which is characterized as the greatest state that can perceive a human being. The different surveys on working conditions show that this is a widespread phenomenon and multiple sources of stress that produce this work experience, which is often associated with negative consequences. Thus, for example, in a recent survey sponsored by the European Commission of almost 16,000 workers from the 15 Member States of the European Union, 42% indicate that their pace of work is too high. [Paoli P, 1997]. It also reveals various experiences of occupational stress. On the other hand, in the fourth survey on conditions of work carried out in Spain (National Institute of Occupational Safety and Health (1997; 2000), data are provided in this same direction on the Spanish working population [Peiró, 2001]. In recent years, in Mexico have increased different types of physiological states and mood negative, such as stress, which has among its consequences, under performance work and social problems; (IMSS, 2012). Due to the increase in this problem in people between 15 and 29 years old, it can be of great importance, since, not to reduce the levels of stress, it comes to have consequences in the physical, mental and emotional health. As we can see, this is not a problem of a local or even a national nature, but it is an affectation at a human level, with psychological, physiological and economic effects, both at the individual level and at the society level. At the physiological level, we can classify or distinguish two types of stressors: acute (presented for a short period of time) or chronic (which are presented for a long period of time). Stress is a variable phenomenon that can sometimes be unpredictable and uncontrollable, mild or severe, which can occur in or out of context. It is characterized by a series of physiological phenomena very heterogeneous but coordinated in what has been formally called the reflex of flight or fight (fight or flight) [Hall and Guyton, 2006; Everly and Lating, 2013; Joëls et al., 2012], which is coordinated with the sympathetic nervous system. Given a stimulus that is identified by the brain as a stressor, usually in the spinal cord reflex centers, an action potential is produced that is directed directly to the adrenergic centers of the adrenal medulla. Adrenaline is released into the bloodstream causing vasodilation, increased heart rate and breathing, and release of substances in the hypothalamus that me-.
(23) Introduction. 3. diate the emotional response to stress. Later it is released by the adrenal cortex a second group of chemicals, glucocorticoids, which mediate the release of glucose to the bloodstream, appetite inhibition and suppression of the immune system, which are the main Adverse effects of long-term stress [Finsterwald and Alberini, 2014; ter Heegde et al., 2015], due to these harmful effects, produced by stimuli from daily life, it becomes an important public health issue to reduce stress by non-pharmacological pathways for the improvement of the state General physical and mental health of patients. On a psychological level, we find that stress, brings with it several consequences such as anxiety, bad mood, the propensity to anger and particularly the loss of attention, as well as concentration (APA, S.D.). It is important to know alternatives that help us to improve the state of stress and that at the same time we can provide an improvement in the attention; Because the medications that are used can cause physical damage to the kidney, liver, or stomach. This is why new therapies have played an important role in the health sector because of the benefits it provides and the health consequences are scarce. Studies have been developed on the relationship that the brain has with the activities we do daily and the way in which the brain can be made to believe that it is doing this activity. Because of this take place the bin-aural beats, since it has been shown that when using them can have an effect on the frequencies of the human brain [Curtis, 2007]. These manage to affect the performance within the vigilante tasks [Lane et al., 1998]. It is important to emphasize the work of these studies, since they show us as some variations in the performance environment, because of their interaction with the individual, they alter both the effect that these tasks have on the individual, as the capacity of performance of the Individual during the performance of the same; Similarly, the psycho physiological response to real stress generators differs depending on the environmental demands [Moya-albiol et al., 2005]. From the point of view of automation, Domotics is an interdisciplinary concept that refers to the integration of the different technologies in the home through the simultaneous use of telecommunications, electronics, informatics and electricity. In addition, its purpose is to improve the quality of life of human beings [Herrera Quintero, 2005]. As we can see the domotics provides us with the necessary tools to confront the problems of stress, by allowing the flexibility of the use of different technologies for the control of a space and thus the alteration of the state of the subjects in the Controlled space.. 1.2. Problem description and context. As previously mentioned, stress is an important factor in the quality of life and productivity of individuals[Expansion, 2018; Forbes, 2017]. One of the elements that are affected by both acute and chronic stress is the mood. Under this premise the idea arises to generate an algorithm for the detection, interpretation and modulation of specific mood states in a population, this by means of the control of the physical variables of their environment, that is to say domotics based on analysis of Emotions. To obtain this algorithm, it is taken as a starting point the knowledge and manuals generated by the psycho-physiology, as well as the studies carried out by Dr. Paul Ekman, who from his research found evidences of the existence of eight Universal basic human emotions. [Ekman, 2007] From his studies, Ekman developed what is called the Facial Action Coding System (FACS) [Ekman and Rosenberg, 1997]. Having this in mind, we seek to focus the algorithm on the analysis of facial patterns, focusing on the points evaluated in the FACS, using machine learning algorithms to be able to train the machine and obtain an accuracy in the acceptable evaluation, the Tolerance range is yet to be defined. The analysis of the facial features that allow the determination of a mood, are a determining factor for the selection of the procurement team and the strategy of processing the images to be analyzed. It is for this reason that, in order to determine the minimum requirements of the equipment, it is necessary to consider and determine an optimal area or work-space, looking for this to be as flexible as possible,.
(24) 4 in order to minimize installation and implementation requirements, both in the That to physical requirements as of processing is concerned, maximizing thus its feasibility for the application on a large scale. Once the algorithm of analysis and emotional interpretation is developed, it is sought to parameterize the variables, in order to be able to choose the most successful methodology for the implementation of a control law. In order to generate the control law, the response times of individuals to changes in their environment are found. Since expressions can be categorized into three types, inns expressions, macro expressions and micro expressions [Lago and Guarı́n, 2014], it has to be determined with which to work. The advantage of micro-expressions is that they are generally not controllable, but they are less pronounced than their alternatives and a twenty fifth of a second duration. On the other hand, macro expressions usually have a duration of between medium and four seconds, being therefore easier to detect. The processing capacity of the vision and computational analysis system plays a key role in determining input variables and sampling times. The possible initial control variables were only the temperature and luminous intensity. However, after a more thorough investigation and after the first experiments, more variables were integrated. Thus we reached the variables so far considered and addressed that are the temperature, tonality of light, humidity and luminous intensity. In subsequent advances to this research may be considered to expand the number of variables some of the proposals made, but not integrated given their individual complexity are auditory and olfactory stimuli. The control system seeks to be implemented in automated closed spaces, looking for the best coupling strategy with existing domotics methodologies. In order to be able to obtain an optimal connection to existing technologies and strategies, in a first approach, we will seek to work with the variables commonly controlled in an automated environment, such as temperature and air circulation, intensity Light, as well as humidity. In order to properly manage the variables to be implemented, the impact that each one can have in the individuals is analyzed previously, giving a higher priority to the most used ones. The intention of the project is to develop a system that is replicate-able and easily implementable in spaces or with existing systems. This is why one of the essential points in the research is the determination of the sensors and standards to be implemented. With this objective in mind was found the standard KNX™[Sita, 2012; Vanus et al., 2015; Martirano et al., 2015] whose equipment and communication methodology was sought to implement as the core of the system. However, such integration, as further deepened in the text, led to the adaptation of KNX™communication with the Matlab™system for control testing and signal retrieval, making this development a central element of the research.. 1.3 1.3.1. State-of-the-art First Approach. The research so far has allowed us to familiarize ourselves with the elements and algorithms that are used today for both facial and emotional identification and processing. As a result of this research and with the purpose of being able to test the tools that according to the reports are in a very advanced phase and possibly can be implemented directly in the final product, some of the algorithms were found in a way Free and free access. Such is the case of the algorithm of ”detection of units of action, from the use of scattered descriptors of appearance in time space in videos [Jiang et al., 2011]”. For the testing and training of algorithms obtained or developed, paperwork was found and started for the acquisition of the following free databases. • MIT Facial Expression Dataset (AM-FED).
(25) Introduction. 5. • GEMEP-FERA • Databases generated by Dr Libor Spacek However, during this phase of research, different areas of work were found for work in emotional recognition. In this area there are still deficiencies in what is the generation of a universal training database that allows testing the systems against variations in light intensity, changes in resolution, faces with partial obstruction and without obstruction. This is because each database generated for this purpose is focused on varying only the variables that this group has considered most important. Another potential area to be investigated in this field is the authenticity of the expression depending on its temporal dynamics, although this type of study also confronts the problematic of attenuated gestures, characteristic that will be evaluated in January with the arrival of the Software Test License. In the environment of Domotics, when revising the mentions and bibliography we encounter a recurrent complaint that is the incompatibility of the systems and the elements among themselves, as well as the difficulty to detect problems before the implementation. However, we also find that in the face of this challenge some institutions have begun to develop systems of simulation of systems of integration and implementation of domotics to locate requirements and potential problems in both models of two dimensions As a three-dimensional simulation. For the latter, you can potentially implement environmental simulation elements such as the Oculus Rift.. 1.3.2. KNX and House Automation. Previously, the topics of domotics were addressed, as well as their implications and objectives, however, a problem that the first domotic designs had was the lack of capacity of interaction between systems of various producers and suppliers. This had as consequences the limitation of the potential of the domotic installations, as well as the need to install different systems for the control of each one of the elements or subsystems that were to be controlled. As a result of this disadvantage, the facilities in addition to having a high cost had a high level of complexity for their installation. To these disadvantages at the time of the installation was added the limited life of the system, derived from the rapid evolution of the products and their lack of compatibility with previous versions. In response to these problems are proposed different quality standards for domotic systems, in this framework is given the creation of the first open standard KNX of the association Konnex, [Lee and Hong, 2008]. This standard complies with the requirements of other international and especially European standards such as ISO/ICE 14543, the CENELEC in 50090, CEN en 13321-1 and GB/Z 20965 [Woo and Seung, 2009]. This standard is based on the creation of a combination of the European installation Bus (EIB), BatiBus and the EHS (European Home Systems) [Ning et al., 2010]. The KNX standard allows various methods of interconnection for your communication, having as a wireline means what is the twisted pair or the Powerline. The first of the two carries by means of four cables what is the feeding in one of the pairs and the data or telegrams for a second pair. The Powerline allows the transmission of the telegrams through the power supply of the cable. As wireless means of communication we have as options the communication via infrared or the communication via WiFi and Ethernet. The advantages offered by the wireless media and the Ethernet for communication is the possibility of minimizing the installation requirements for the cabling and connection of the system, however, it has as weakness the need of various receiver modules For these signals. As the main characteristic of KNX systems we encounter the characteristic of decentralized control systems. That is to say that each one of its components either sensors or actuators possess its own controller that can be programmed to act according to a preset routine and to keep to the slope of the telegrams of the sensors to adapt its.
Figure
+7
Documento similar