A Multiagent Approach to Outbound Intrusion Detection
224
0
0
Texto completo
(2)
(3) Instituto Tecnológico y de Estudios Superiores de Monterrey Monterrey Campus Graduate Program in Electronics, Computing, Information and Communications. We, the undersigned, as members of the evaluation committee, hereby recommend the thesis entitled “A Multiagent Approach to Outbound Intrusion Detection” defended by Salvador Mandujano Vergara on Friday August 6th, 2004, to be accepted in partial fulfillment of the requirements for the degree of Doctor of Philosophy in Artificial Intelligence.. Arturo Galván Rodrı́guez, PhD (advisor). David Garza Salazar, PhD Chair, Graduate Program in Electronics, Computing, Information and Communications. Ramón Brena Pinero, PhD. Jesús Arturo Pérez Dı́az, PhD. Gerardo Ayala San Martı́n, PhD. Pascal Meunier, PhD. Monterrey, Mexico, December – 2004.
(4)
(5) Acknowledgments. I must thank all the support I have received from professors, researchers and fellow students during these years of graduate school. This dissertation would have never been possible without their help. Firstly, I acknowledge the authorities of ITESM for providing me with the fellowship that allowed me to enroll into this doctoral program and for the teaching and research opportunities that help us develop skills beyond the classroom. I also thank CONACyT for the funding I was awarded to study my Master’s. This dissertation is strongly influenced by ideas and motivation originated during that period. I very specially thank the members of my dissertation committee, Dr. Ramón Brena, Dr. Gerardo Ayala, Dr. Jesús Arturo Pérez, and Dr. Pascal Meunier, who were so kind in accepting our invitation to review this work. Their thorough feedback and suggestions helped me deliver a better document and identify research ideas I will definitely consider in future projects. While at ITESM, I worked under the supervision of Dr. Arturo Galván, my principal advisor. I thank him for providing me with the guidance and freedom that allowed me to enjoy the exploration of new ideas in the field of computer security. His technical competence and values as a person are equally admirable and I hope many more students have the chance to work with him. I thank Dr. Rogelio Soto for being so helpful in aligning the resources that allowed me to work with the people of the ITESM Center for Intelligent Systems. For his follow-through during my studies and for supporting my research, my sincere gratitude. Dr. Juan Arturo Nolazco has been instrumental in many respects to my doctoral studies. He received me as an assistant in his information security group and supported the research line my advisor and I were trying to pursue. I am profoundly thankful to him for the confidence placed in me and for the opportunities I had to develop my work and to contribute to the growth of the group. I thank all my ITESM professors for introducing me into the world of artificial intelligence whose different areas are worth a lifetime. Thanks Dr. Francisco Cantú, Dr. Hugo Terashima, Dr. Ramón Brena, Dr. José Luis Gordillo, and Dr. Manuel Valenzuela. I must especially thank Dr. Robbert van Renesse for having me as a visiting scholar at the Department of Computer Science of Cornell University. Working at Cornell was an amazing learning experience that would have not been possible without his interest and support. I thank Robbert for believing in my proposal and for encouraging my interaction with faculty and students. I also thank Dr. Emin Gun Sirer, Dr. Rich Caruana, and Dr. Mark Bickford for their comments and for the invaluable time they so kindly devoted to me..
(6) Some Purdue people got me really involved into computer security during my Master’s and encouraged me to pursue this degree. I must thank Dr. Sam Wagstaff for being my advisor, Dr. Sunil Prabakhar and Dr. Pascal Meunier for their support and for the opportunity to work with their teams, Dr. Clay Shields for his invaluable lessons, and Dr. Mike Atallah for his incredible cryptography class and for his guidance in our research projects. The very first thought I had of a career in research appeared when I was studying high school at UNAM’s Escuela Nacional Preparatoria thanks to the encouragement of Prof. Marı́a Elena Montoya, to whom I will be forever indebted, and the Program for Early Initiation to Research (Programa de Iniciación Temprana a la Investigación). This motivation developed throughout college at UNAM where I met Prof. José Origel, my thesis mentor, Dr. Francisco Ugalde, and Dr. Diego Zamboni who were role models that helped me find the determination to aim for higher intellectual goals. I must also thank Cheryl, my girlfriend, for her patience and understanding, and for the immense love she always shows for me, and all my friends and classmates for their help and for the moments we shared together. In alphabetical order, I thank Alejandra, Bonnie, Carlos, Charlie, Doris, Eduardo, Emily, Emmanuel, Evy, Fernando, Filip, Germán, Guanfeng, Héctor, Leonardo, Lingfeng, Michael, Patrick, Rossy, Saurabh , Tineke, Vı́ctor and Yulianto. Last but not least, I thank my family for all their love and for always supporting my decisions. I thank Felicia, my sister, for her words and strength, and Eduardo, my brother, for showing me a different way of understanding this journey called life. To my parents, Beatriz and Salvador, all my love and respect for the solid principles with which the raised us and for their everlasting support. Words will never suffice to thank them enough.. Salvador Mandujano Vergara Monterrey, Mexico, December – 2004.
(7) To Beatriz, my mother.. To Salvador, my father.. To Felicia, my sister.. To Eduardo, my brother..
(8)
(9) A Multiagent Approach to Outbound Intrusion Detection. A dissertation submitted by. Salvador Mandujano Vergara. to the faculty of the. Graduate Program in Electronics, Computing, Information and Communications. in partial fulfillment of the requirements for the degree of. Doctor of Philosophy in Artificial Intelligence. Instituto Tecnológico y de Estudios Superiores de Monterrey Monterrey, Mexico. December – 2004.
(10)
(11) Abstract “A Multiagent Approach to Outbound Intrusion Detection”. Ph.D. dissertation by Salvador Mandujano Vergara, Instituto Tecnológico y de Estudios Superiores de Monterrey. Advisor: Prof. Arturo Galván. December – 2004.. This is a dissertation on the topic of intrusion detection. It supports the philosophy of system vigilance by exploring the concept of outbound intrusion detection, which is concerned with the identification and collection of evidence that helps prove local resources are being used to compromise external systems. We discuss the motivation behind the approach, explain the need for splitting the scope of intrusion detection into sub-problems, and present trends in computer security that reveal basic design considerations that need to be taken into account when developing modern information security tools. We propose a multiagent architecture for outbound intrusion detection supported by an ontology. Groups of agents collectively monitor outbound network traffic and local activity in order to identify references to neighboring systems that may be indicative of a compromise attempt. We organize agents into sub-environments called agent cells that are connected to each other in a non-hierarchical fashion. Different classes of agents and cells compose the system, which performs attack modeling by employing multiple concurrent agents. Detection cells implement independent misuse intrusion strategies whose output is systematically fed to correlation cells capable of more accurate diagnosis. We present an attack-source-centric ontology that extends previous work in the area. It enables message interpretation and enhanced agent communication within the architecture simplifying at the same time system maintenance and facilitating the integration of new components. We describe the implementation of the proposed architecture through the FROID prototype as a proof of concept. This is a misuse-based intrusion detection system built with agent and semantic web open-source technology whose particular focus is the identification of automated remote attack tools. It performs signature generation, matching, and correlation, and supports a signature deployment mechanism over the Internet. We introduce a similarity matching method that improves the performance of existing algorithms by leveraging entropy and frequency properties of the input hereby reducing search time. We link detection with incident response by procuring low false alarm rates that allow us to study local and external reaction methods to outbound intrusion events. We also present a component of the architecture that performs tracing of interactive sessions as a way of identifying the root location of a security event. We describe the experimental design and report the results obtained with the prototype that show the feasibility of the approach as an alternate way of containing the impact of security incidents through the integration of a mesh of monitoring agents..
(12)
(13) Copyright c Salvador Mandujano Vergara, 2004.
(14)
(15) Declaration. I hereby declare that this dissertation entitled “An Multiagent Approach to Outbound Intrusion Detection” describes my own work and that, to the best of my knowledge and belief, it contains no material previously published or written by another person nor material which to a substantial extent has been accepted for the award of any degree or diploma by ITESM or any other institution of higher learning, except where due acknowledgment has been explicitly made in the text.. Salvador Mandujano Vergara. Monterrey, Mexico, December – 2004.
(16)
(17) List of Figures 2.1. Anomaly-based intrusion detection.. . . . . . . . . . . . . . . . . . . . . . . . . .. 13. 2.2. Misuse-based intrusion detection.. . . . . . . . . . . . . . . . . . . . . . . . . . .. 15. 2.3. A frequency system-call profile describing the behavior of a program [147]. . . . .. 16. 2.4. A simple Bayesian network connecting intrusion-related variables. CPT’s store a-priori probabilities such as the probability of intrusion and the proportion of disk fragmentation . . . . . . . . . . . . . . . . . . . . . . . . . . . . . . . . . . .. 2.5. A sample neural network with window that predicts the next command once n commands have appeared in the input (window size is n = 3. . . . . . . . . . . .. 2.6. . . . . . . . . . . . . . . . . . . . . . . . . . . . . . . . . . . . . . . .. 21. Code vulnerable to buffer overflow before and after embedding a sensor into it. On the left side, lines 2–6 form the embedded sensor [223]. . . . . . . . . . . . . .. 2.9. 20. A parse tree corresponding to a program that can be evolved through Genetic Programming to detect a security-relevant event [41]. . . . . . . . . . . . . . . . .. 2.8. 19. A Petri net corresponding to a partial order of events leading to a compromise state [103]. 2.7. 17. 22. Caller-callee relationships are distinctive of a program and can be used to identify abnormal behavior. An unexpected transition may be indicative of anomalous activity (see dashed line; no such transition exists in the actual program). . . . .. 23. 2.10 SVM splitting the feature space into two classes (they could represent normal and irregular behavior). . . . . . . . . . . . . . . . . . . . . . . . . . . . . . . . . . . .. 24. 2.11 Example of DNA sequence alignment [39]. . . . . . . . . . . . . . . . . . . . . . .. 26. 2.12 The increasing sophistication of attacks and the decreasing expertise of users [2, 126]. . . . . . . . . . . . . . . . . . . . . . . . . . . . . . . . . . . . . . . . . .. 34. 2.13 Number of security incident and number of vulnerabilities reported per year to the CERT–CC (Coordination Center, Computer Emergency Response Team [32]). 34 xix.
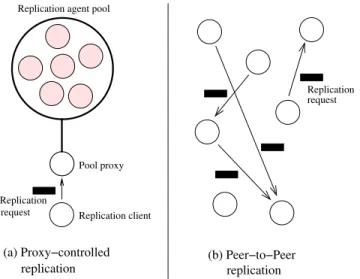
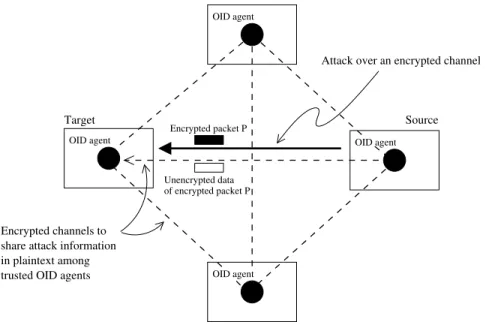
(18) xx. LIST OF FIGURES. 2.14 Use of information security technologies (2003 Global Security Survey, Deloitte & Touche [48]) and intrusion detection technologies (CSI/FBI Computer Crime & Security Survey 2003 [169]). The charts show the percentage of surveyed companies that report using this type of software. . . . . . . . . . . . . . . . . . . . . .. 35. 2.15 Number of known Denial of Service (DoS) vulnerabilities and attacks per year (PestPatrol’s detection database, PestPatrol Inc. 2002 [155]). . . . . . . . . . . .. 36. 2.16 (a) Replication is performed by a pool of agents which are contacted through a proxy agent. (b) Replication can also be peer-to-peer. . . . . . . . . . . . . . . .. 39. 2.17 Hierarchical component of a multiagent intrusion detection architecture [224]. . .. 42. 2.18 Enabling high-level agent functions through an ontology layer.. . . . . . . . . . .. 42. 3.1. Data collection focus of different intrusion detection approaches. . . . . . . . . .. 50. 3.2. Attacks are detected at the originating host or at an intermediate host and can be blocked. This creates a security structure centered on the protection of others. 51. 3.3. Characterization of automated attack tools through the use of locally-measurable and observable variables. . . . . . . . . . . . . . . . . . . . . . . . . . . . . . . . .. 3.4. 53. Under the assumption that the number of outgoing network packets an internal host generates is less than the incoming network packets a gateway sees, OID allows for more efficient packet processing.. 3.5. . . . . . . . . . . . . . . . . . . . . .. A mesh of trusted OID agents that share plaintext of encrypted attack data over secure channels . . . . . . . . . . . . . . . . . . . . . . . . . . . . . . . . . . . . .. 3.6. 54 56. Performance of an OID system: Number of comparisons vs. time (a comparison tries to match program files against program signatures). . . . . . . . . . . . . .. 57. 4.1. Features of the OID environment. 64. 4.2. Primary OID tasks (YAWL diagram; see Appendix A).. 4.3. Agent interconnection architectures ( S = sensor, C = correlator, R = reactor;. . . . . . . . . . . . . . . . . . . . . . . . . . . . . . . . . . . . . . . . .. arrows indicate data exchange flow). . . . . . . . . . . . . . . . . . . . . . . . . .. 65 69. 4.4. Grouping agents functionally into specific-purpose sub-environments or agent cells. 71. 4.5. OID architecture and main cell classes. . . . . . . . . . . . . . . . . . . . . . . . .. 4.6. Internal dataflow: (a) Traffic-signature cells, and (b) Process-signature cells (see Appendix A for YAWL symbols). . . . . . . . . . . . . . . . . . . . . . . . . . . .. 4.7 4.8. 72 74. Internal dataflow: (a) Traffic-monitoring cells, and (b) Process-monitoring cells (see Appendix A for YAWL symbols). . . . . . . . . . . . . . . . . . . . . . . . .. 75. Dataflow inside Correlation cells (see Appendix A for YAWL symbols). . . . . . .. 76.
(19) xxi. LIST OF FIGURES. 4.9. Deployment of attack program signatures. Repositories connected to the Internet receive signatures from registered signature generation sites. Agents download signatures and ontology updates (M represents a mirror repository). . . . . . . .. 76. 4.10 Graphical notation . . . . . . . . . . . . . . . . . . . . . . . . . . . . . . . . . . .. 77. 4.11 A target-centric ontology for intrusion detection [203, 202]; bold arrows represent subclasses; soft arrows represent properties. . . . . . . . . . . . . . . . . . . . . .. 79. 4.12 A source-centric ontology for outbound intrusion detection (see Appendix B for its definition in OWL) . . . . . . . . . . . . . . . . . . . . . . . . . . . . . . . . .. 80. 4.13 Overlapping between the target-centric intrusion detection ontology and the sourcecentric OID ontology.. . . . . . . . . . . . . . . . . . . . . . . . . . . . . . . . . .. 81. 4.14 OWL statements defining the Signature–Process Signature subclass predicate. . .. 81. 4.15 Literal attributes of the Traffic Signature object. . . . . . . . . . . . . . . . . . .. 81. 4.16 OWL definition of a sample Traffic Signature instance. . . . . . . . . . . . . . . .. 82. 4.17 The Agent-cell class . . . . . . . . . . . . . . . . . . . . . . . . . . . . . . . . . .. 83. 4.18 The Agent class. . . . . . . . . . . . . . . . . . . . . . . . . . . . . . . . . . . . .. 83. 4.19 The Data-source class . . . . . . . . . . . . . . . . . . . . . . . . . . . . . . . . .. 84. 4.20 The Signature class. . . . . . . . . . . . . . . . . . . . . . . . . . . . . . . . . . .. 85. 4.21 The Reaction class . . . . . . . . . . . . . . . . . . . . . . . . . . . . . . . . . . .. 85. 4.22 The Process class. 85. . . . . . . . . . . . . . . . . . . . . . . . . . . . . . . . . . . .. 4.23 The Repository class 4.24 The IP-packet class 4.25 The Executable class. . . . . . . . . . . . . . . . . . . . . . . . . . . . . . . . . .. 86. . . . . . . . . . . . . . . . . . . . . . . . . . . . . . . . . . .. 86. . . . . . . . . . . . . . . . . . . . . . . . . . . . . . . . . .. 87. 4.26 Loop unwinding. If a user connects from host hs to host ht doing a loop through hops 1, 2, 3, 4, 5 and 6 as shown above, agent A at ht will start the tracing process and will be able to identify the loop to reduce tracing time in the future. . . . . .. 90. 5.1. Sample TCP socket table. . . . . . . . . . . . . . . . . . . . . . . . . . . . . . . .. 93. 5.2. Hierarchy of classes derived from the primary JADE-agent class. . . . . . . . . .. 94. 5.3. Packet reading assignment for two (n = 2) monitoring cells. . . . . . . . . . . .. 95. 5.4. Failure cascade for sensors performing packet capture. . . . . . . . . . . . . . . .. 96. 5.5. Sample backup structure for m = 3: when A is a primary agent, B is its first backup and C is its second backup; when B is a primary agent, C is its first backup and A is its second backup; when C is a primary agent, A is its first backup and B its its second backup. . . . . . . . . . . . . . . . . . . . . . . . . .. 97.
(20) xxii. 5.6. LIST OF FIGURES. Payload data of a telnet packet. One byte is used for sub-protocol window size negotiation. The maximum value corresponds to F F which produces a deviation between 0 and 30 in the hash value. . . . . . . . . . . . . . . . . . . . . . . . . .. 5.7. Network-traffic signatures of three different attack programs considering executions of only one variant per program. . . . . . . . . . . . . . . . . . . . . . . . .. 5.8. 99 99. Network-traffic signatures of three different attack programs considering two variants. . . . . . . . . . . . . . . . . . . . . . . . . . . . . . . . . . . . . . . . . . . . 100. 5.9. Snort’s signature matching linked list [170, 37]. . . . . . . . . . . . . . . . . . . . 101. 5.10 Data structure for attack signatures. Nodes are sorted from highest to lowest frequency. . . . . . . . . . . . . . . . . . . . . . . . . . . . . . . . . . . . . . . . . 102 5.11 Splitting power per signature attribute. . . . . . . . . . . . . . . . . . . . . . . . 104 5.12 The matching method gives more weight to attributes with high splitting power (see Table 5.4). . . . . . . . . . . . . . . . . . . . . . . . . . . . . . . . . . . . . . 107 5.13 Function to compute payload hash σi sub-scores. . . . . . . . . . . . . . . . . . . 107 5.14 The text segment can be used to characterize a program. The figure shows an excerpt from the text segment of smurf4, one of the surveyed attack tools. . . . . 109 5.15 Process signature linked list. Every si node represents a program-variant signature.110 5.16 Fusing hypothesis H1 and H2 into H3 . . . . . . . . . . . . . . . . . . . . . . . . . 112 6.1. Sample attack program containing root-shell code for two different target platforms: Linux and FreeBSD. . . . . . . . . . . . . . . . . . . . . . . . . . . . . . . 116. 6.2. Experimental setup for the testing phase. . . . . . . . . . . . . . . . . . . . . . . 119. 6.3. The Mucus intrusion detection stimulator. . . . . . . . . . . . . . . . . . . . . . . 121. 6.4. Average hypothesis score σ(x) corresponding to each attack tool using one trafficmonitoring cell. . . . . . . . . . . . . . . . . . . . . . . . . . . . . . . . . . . . . . 123. 6.5. Average hypothesis score σ(x) corresponding to each attack tool using two trafficmonitoring cells. . . . . . . . . . . . . . . . . . . . . . . . . . . . . . . . . . . . . 124. 6.6. Average hypothesis score σ(x) corresponding to each attack tool using three traffic-monitoring cells. . . . . . . . . . . . . . . . . . . . . . . . . . . . . . . . . . 125. 6.7. Average hypothesis score π(x) corresponding to each attack tool using one processmonitoring cell. . . . . . . . . . . . . . . . . . . . . . . . . . . . . . . . . . . . . . 126. 6.8. Average hypothesis score π(x) corresponding to each attack tool using two processmonitoring cells. . . . . . . . . . . . . . . . . . . . . . . . . . . . . . . . . . . . . 127.
(21) xxiii. LIST OF FIGURES. 6.9. Detection time with network monitoring under different traffic levels using one, two, and three cells. . . . . . . . . . . . . . . . . . . . . . . . . . . . . . . . . . . 128. 6.10 Detection time with process monitoring under different workload levels using one and two cells. . . . . . . . . . . . . . . . . . . . . . . . . . . . . . . . . . . . . . . 129 6.11 Detection accuracy using correlation with one network-monitoring cell, one processmonitoring cell, and one correlation cell. . . . . . . . . . . . . . . . . . . . . . . . 129 6.12 Detection accuracy using correlation with two network-monitoring cells, two processmonitoring cells, and two correlation cells. . . . . . . . . . . . . . . . . . . . . . . 131 6.13 Left: average detection time using two monitoring cells and one correlation cell. Right: average detection time using two pairs of monitoring cells and two correlation cells. . . . . . . . . . . . . . . . . . . . . . . . . . . . . . . . . . . . . . . . 131 7.1. TCP datagram format (RFC 793) [38].. 7.2. IP v.4 datagram format (RFC 791) [38].. . . . . . . . . . . . . . . . . . . . . . . . B–143 . . . . . . . . . . . . . . . . . . . . . . B–145.
(22)
(23) Contents List of Figures. xix. List of Tables. xxv. 1 Introduction 1.1. 3. Context and basic concepts . . . . . . . . . . . . . . . . . . . . . . . . . . . . . .. 3. 1.1.1. Information security fundamentals . . . . . . . . . . . . . . . . . . . . . .. 3. 1.1.2. The critical need for vigilance . . . . . . . . . . . . . . . . . . . . . . . . .. 5. 1.2. Limitations of intrusion detection systems . . . . . . . . . . . . . . . . . . . . . .. 6. 1.3. Solution approach . . . . . . . . . . . . . . . . . . . . . . . . . . . . . . . . . . .. 7. 1.4. Thesis statement . . . . . . . . . . . . . . . . . . . . . . . . . . . . . . . . . . . .. 8. 1.5. Document organization. 9. . . . . . . . . . . . . . . . . . . . . . . . . . . . . . . . .. 2 Background 2.1. 11. Intrusion detection . . . . . . . . . . . . . . . . . . . . . . . . . . . . . . . . . . .. 11. 2.1.1. Intrusion detection systems . . . . . . . . . . . . . . . . . . . . . . . . . .. 11. 2.1.2. Classification of intrusion detection systems . . . . . . . . . . . . . . . . .. 13. 2.1.3. Detection techniques . . . . . . . . . . . . . . . . . . . . . . . . . . . . . .. 15. 2.1.4. Data collection and fusion . . . . . . . . . . . . . . . . . . . . . . . . . . .. 27. 2.1.5. Challenges of current models . . . . . . . . . . . . . . . . . . . . . . . . .. 30. 2.2. Recent trends in information security . . . . . . . . . . . . . . . . . . . . . . . . .. 33. 2.3. Connection back-tracing . . . . . . . . . . . . . . . . . . . . . . . . . . . . . . . .. 37. 2.3.1. Limited troubleshooting visibility . . . . . . . . . . . . . . . . . . . . . . .. 37. 2.3.2. Related projects . . . . . . . . . . . . . . . . . . . . . . . . . . . . . . . .. 37. Agent-based intrusion detection . . . . . . . . . . . . . . . . . . . . . . . . . . . .. 38. 2.4.1. 39. 2.4. Agents . . . . . . . . . . . . . . . . . . . . . . . . . . . . . . . . . . . . . . xv.
(24) xvi. 2.5. CONTENTS. 2.4.2. Multiagent systems . . . . . . . . . . . . . . . . . . . . . . . . . . . . . . .. 40. 2.4.3. Multiagent components of intrusion detection architectures . . . . . . . .. 41. Taxonomies and ontologies in information security . . . . . . . . . . . . . . . . .. 43. 3 Problem description 3.1. 49. Outbound intrusion detection . . . . . . . . . . . . . . . . . . . . . . . . . . . . .. 49. 3.1.1. Objective . . . . . . . . . . . . . . . . . . . . . . . . . . . . . . . . . . . .. 49. 3.1.2. Main characteristics . . . . . . . . . . . . . . . . . . . . . . . . . . . . . .. 50. 4 A multiagent outbound intrusion detection architecture. 59. 4.1. A multiagent approach to intrusion detection . . . . . . . . . . . . . . . . . . . .. 59. 4.2. Specific objective of the architecture . . . . . . . . . . . . . . . . . . . . . . . . .. 60. 4.3. Characterization of automated attack tools . . . . . . . . . . . . . . . . . . . . .. 60. 4.3.1. . . . . . . . . . . . . . . . . . . . . . . . . . .. 61. 4.4. Environment . . . . . . . . . . . . . . . . . . . . . . . . . . . . . . . . . . . . . .. 63. 4.5. Task definitions . . . . . . . . . . . . . . . . . . . . . . . . . . . . . . . . . . . . .. 64. 4.6. Task-to-agent mapping . . . . . . . . . . . . . . . . . . . . . . . . . . . . . . . . .. 66. 4.7. Organization of single agents . . . . . . . . . . . . . . . . . . . . . . . . . . . . .. 68. 4.8. Agent cells. . . . . . . . . . . . . . . . . . . . . . . . . . . . . . . . . . . . . . . .. 71. 4.8.1. Agent classes and cell classes . . . . . . . . . . . . . . . . . . . . . . . . .. 72. 4.8.2. Signature and ontology deployment . . . . . . . . . . . . . . . . . . . . . .. 73. 4.8.3. Operational outline . . . . . . . . . . . . . . . . . . . . . . . . . . . . . . .. 74. Ontological model . . . . . . . . . . . . . . . . . . . . . . . . . . . . . . . . . . .. 75. 4.9.1. Supporting agent-based security technologies with ontologies . . . . . . .. 76. 4.9.2. Target-centric ontology for intrusion detection. . . . . . . . . . . . . . . .. 77. 4.10 Source-centric ontology for outbound intrusion detection . . . . . . . . . . . . . .. 82. 4.10.1 Use of the ontology . . . . . . . . . . . . . . . . . . . . . . . . . . . . . . .. 86. 4.11 Session tracing . . . . . . . . . . . . . . . . . . . . . . . . . . . . . . . . . . . . .. 88. 4.11.1 Internal design . . . . . . . . . . . . . . . . . . . . . . . . . . . . . . . . .. 88. 4.11.2 Hop identification . . . . . . . . . . . . . . . . . . . . . . . . . . . . . . .. 89. 4.9. Attack program signatures. 5 Implementation. 91. 5.1. Technologies . . . . . . . . . . . . . . . . . . . . . . . . . . . . . . . . . . . . . . .. 91. 5.2. Triggering event. . . . . . . . . . . . . . . . . . . . . . . . . . . . . . . . . . . . .. 92. 5.3. Agent creation . . . . . . . . . . . . . . . . . . . . . . . . . . . . . . . . . . . . .. 93.
(25) xvii. CONTENTS. 5.4. Network data capture . . . . . . . . . . . . . . . . . . . . . . . . . . . . . . . . .. 94. 5.4.1. Buffering and coordination . . . . . . . . . . . . . . . . . . . . . . . . . .. 95. 5.4.2. Packet read backup. . . . . . . . . . . . . . . . . . . . . . . . . . . . . . .. 96. 5.5. Process data capture . . . . . . . . . . . . . . . . . . . . . . . . . . . . . . . . . .. 97. 5.6. Matching of network signatures . . . . . . . . . . . . . . . . . . . . . . . . . . . .. 98. 5.7. 5.6.1. Primary data structure . . . . . . . . . . . . . . . . . . . . . . . . . . . . 100. 5.6.2. Splitting power analysis . . . . . . . . . . . . . . . . . . . . . . . . . . . . 102. 5.6.3. Analysis of network data. 5.6.4. Matching method for network signatures . . . . . . . . . . . . . . . . . . . 106. . . . . . . . . . . . . . . . . . . . . . . . . . . . 103. Matching process signatures . . . . . . . . . . . . . . . . . . . . . . . . . . . . . . 108 5.7.1. Primary data structure . . . . . . . . . . . . . . . . . . . . . . . . . . . . 109. 5.7.2. Matching method for process signatures . . . . . . . . . . . . . . . . . . . 110. 5.7.3. Signature fusion . . . . . . . . . . . . . . . . . . . . . . . . . . . . . . . . 111. 5.8. Session tracing implementation . . . . . . . . . . . . . . . . . . . . . . . . . . . . 113. 5.9. Reaction methods. . . . . . . . . . . . . . . . . . . . . . . . . . . . . . . . . . . . 113. 6 Experiments and results. 115. 6.1. Experimental objectives . . . . . . . . . . . . . . . . . . . . . . . . . . . . . . . . 115. 6.2. Test data . . . . . . . . . . . . . . . . . . . . . . . . . . . . . . . . . . . . . . . . 115 6.2.1. Exploit types . . . . . . . . . . . . . . . . . . . . . . . . . . . . . . . . . . 115. 6.2.2. Target platforms . . . . . . . . . . . . . . . . . . . . . . . . . . . . . . . . 116. 6.2.3. Programming languages . . . . . . . . . . . . . . . . . . . . . . . . . . . . 117. 6.2.4. Test program set . . . . . . . . . . . . . . . . . . . . . . . . . . . . . . . . 117. 6.3. Experimental setup . . . . . . . . . . . . . . . . . . . . . . . . . . . . . . . . . . . 119. 6.4. Signature generation . . . . . . . . . . . . . . . . . . . . . . . . . . . . . . . . . . 120. 6.5. A word on compiled and interpreted code . . . . . . . . . . . . . . . . . . . . . . 120. 6.6. Experiments: Signature matching and correlation . . . . . . . . . . . . . . . . . . 120. 6.7. 6.6.1. Traffic generation . . . . . . . . . . . . . . . . . . . . . . . . . . . . . . . . 121. 6.6.2. Workload control . . . . . . . . . . . . . . . . . . . . . . . . . . . . . . . . 122. 6.6.3. Cell accuracy . . . . . . . . . . . . . . . . . . . . . . . . . . . . . . . . . . 123. 6.6.4. Cell performance . . . . . . . . . . . . . . . . . . . . . . . . . . . . . . . . 127. 6.6.5. Correlation accuracy . . . . . . . . . . . . . . . . . . . . . . . . . . . . . . 130. 6.6.6. Correlation performance . . . . . . . . . . . . . . . . . . . . . . . . . . . . 131. Interactive session tracing . . . . . . . . . . . . . . . . . . . . . . . . . . . . . . . 132.
(26) xviii. 6.8. CONTENTS. Results . . . . . . . . . . . . . . . . . . . . . . . . . . . . . . . . . . . . . . . . . . 133. 7 Conclusions, contributions and future work. 135. 7.1. Conclusions . . . . . . . . . . . . . . . . . . . . . . . . . . . . . . . . . . . . . . . 135. 7.2. Contributions . . . . . . . . . . . . . . . . . . . . . . . . . . . . . . . . . . . . . . 137. 7.3. Future directions . . . . . . . . . . . . . . . . . . . . . . . . . . . . . . . . . . . . 138. Appendix A YAWL symbols. A–141. Appendix B TCP and IP datagram formats. B–143. Appendix C Outbound intrusion detection ontology in OWL. C–149. Appendix D Classification Trees. D–155. Appendix E Process signatures. E–165. Appendix F Network signatures. F–171.
(27) List of Tables 2.1. Classification of intrusion detection systems by input type [223, 13]. . . . . . . .. 2.2. Classification of intrusion detection systems by their data analysis structure [223,. 29. 13]. . . . . . . . . . . . . . . . . . . . . . . . . . . . . . . . . . . . . . . . . . . . .. 31. 2.3. Classification of intrusion detection techniques . . . . . . . . . . . . . . . . . . .. 47. 4.1. Description of the Sensor, Correlator, and Reactor agent classes. . . . . . . . . .. 67. 4.2. Description of the Name and Ontology Server agent class . . . . . . . . . . . . .. 68. 5.2. Attributes stored on each node type. . . . . . . . . . . . . . . . . . . . . . . . . . 104. 5.4. Splitting power per attribute in network signatures.. 5.6. Rules to implement automated response. . . . . . . . . . . . . . . . . . . . . . . . 114. 6.2. Automated remote-attack tools used in the experiments. . . . . . . . . . . . . . . 118. 6.4. Matching scores for one, two, and three traffic-monitoring-cell scenarios. . . . . . 125. 6.5. Tracing time with and without encryption (RSA key exchange + DES chaining. . . . . . . . . . . . . . . . . 106. block ciphering); m corresponds to the number of connection hops or length of the chain. . . . . . . . . . . . . . . . . . . . . . . . . . . . . . . . . . . . . . . . . 132. xxv.
(28)
(29) Chapter 2. Background This chapter is divided into five main sections. They present basic concepts used and studied throughout subsequent chapters. We first define some intrusion detection terminology. Computer security trends observed in recent surveys are presented to support the motivation behind this dissertation. The problem of connection tracing, which is closely related to intruder identification, is also introduced. Finally, the multiagent approach to intrusion detection is explained as well as some relevant projects in the area of security taxonomies and ontologies.. 2.1. Intrusion detection. This section introduces intrusion detection concepts relevant to the objectives of this dissertation. It also describes the “state of the art” on detection techniques, shows recent trends in computer security and cyber-crime, and lists some of the primary research challenges in intrusion detection.. 2.1.1. Intrusion detection systems. There are several ways to avoid being the target of an intrusion or to react to one [76]: 1. Prevention. To proactively reduce the likelihood of intrusive activity by influencing the root causes of the problem (e.g., to remove unnecessary services from a host). 2. Preemption. To actually counter-attack the source of the intrusion before it reaches its objective (e.g., launching a denial of service attack toward the presumed offender [208]). 3. Deterrence. To persuade the attacker to stop the attack (e.g., using system banners announcing the presence of the security tools installed on the system). 4. Deflection. To make the attacker think he has succeeded (e.g., using honey-pot boxes [193]). 5. Use of countermeasures. To react to the intrusion as it develops (e.g., applying patches and reconfiguring the system). 11.
(30) 12. CHAPTER 2. BACKGROUND. 6. Detection. To identify intrusive attempts and incidents in order to keep the corresponding authority informed (e.g., reporting anomalous URL strings received by the webserver).. Out of these possible reactions, intrusion detection, along with prevention, is the approach that has been explored the most [13, 4]. Twenty years ago, Anderson wrote seminal work in the area which increased the interest in computer security [6]. A few years later, the first intrusion detection model by Denning opened the field and eventually became central reference to multiple security architectures developed around the world [49]. Intrusion detection is concerned with the identification of activities that have been generated with the intention of compromising the security of local resources [4]. An attacker may be trying to gain access to a system from outside of the network, but it can also be the case that a legitimate internal user is abusing the access control mechanism in order to disclose sensitive data or to modify files without having been authorized to do so. Intrusion detection software gathers and analyzes data from different sources within the system in order to identify activity that may be indicative of a compromise attempt [223]. An intrusion detection tool will alert the administrators who will have to take action in order to limit the damage and fix any security hole present in the system. A related concept that needs to be mentioned is that of intrusion tolerance [51, 217]. DEFINITION 7 Intrusion tolerance. The ability of a system to continue working despite of intrusion [132]. Its main goals are: (1) to recognize the failure event, (2) to asses the extent of the damage, (3) to stop the event, and (4) to recover essential services during or after the incident. It is also often referred to as survivability. This discipline comprises the sub-area of fault tolerance which studies ways to make a system resistant to failure (fault tolerance does not contemplate the case of induced failures or intrusions [210]). DEFINITION 8 Fault tolerance. The ability to resist failures that are natural to the system (i.e., random operational faults [157]). Intrusion tolerance also studies the problem of designing modular systems so that components can be easily isolated in the event they are compromised hereby allowing the rest of the system to keep providing all or part of its overall functionality [99, 12]. It is important to make the point that intrusion detection defers from intrusion tolerance and fault tolerance in that intrusion detection does not have to do with the design and implementation of robust systems that resist failure or attack. Intrusion detection’s only goal is to identify violations to a local security policy and to report them via alert messages to the administrators [63]..
(31) 13. 2.1. INTRUSION DETECTION. 2.1.2. Classification of intrusion detection systems. There are two primary methods to implement intrusion detection: (1) anomaly detection (also known as profile-based intrusion detection and statistical intrusion detection), and (2) misuse detection (also known as signature or pattern-based detection). DEFINITION 9 Anomaly detection. An intrusion detection technique that creates a definition of “normality” and flags as intrusive any activity that deviates from it [126]. Anomaly detection. Anomaly detection assumes intrusions constitute irregular events. It creates behavior profiles by observing the “normal” activity of users or applications (Figure 2.1). Once these profiles have been built through training or using heuristics, any activity that diverges from them will be considered as potentially intrusive. False positives and false negatives may arise due to the threshold that divides normal from abnormal behavior. A false positive is the classification of legitimate activity as intrusive, whereas a false negative is the classification of illicit activity as benign – the latter being a much more serious problem as it represents failure to identify hazardous events [103]. Anomaly-based intrusion detection systems are computationally expensive due to the techniques they employ. They typically require the construction and tuning of behavioral models (some of these systems are described in [152, 108, 83, 175, 109, 64]). Classifying what is “normal” from what is not is a difficult task that involves not only technical factors such as compliance with protocol definitions or the understanding of the internals of an application, but also aspects such as the expertise level of the users, their preferences, and the date and time. They also contribute to the complexity of identifying what is an acceptable variation of the system’s security context and they are sometimes difficult to model as input for software systems [4]. Intrusive sequence System activity stream. 4308FFCD3A09D8B9D80BB8E80D4A6D4A Detection system. 09E4308FFCD3A09D8 0C90C08E80D4A6D4A ... Valid sequences. Figure 2.1: Anomaly-based intrusion detection.. – Advantages of anomaly detection. The main advantage of anomaly detection is that it can potentially discover attacks that have not been seen before [103]. Any evidence of activity variating from the profile will be considered for further analysis regardless of what has been previously seen. Another advantage is that the system can be left to run unattended once the.
(32) 14. CHAPTER 2. BACKGROUND. normality profile has been created. This considerably reduces maintenance time [60]. – Disadvantages of anomaly detection. One of the disadvantages of this approach is that unusual behavior is not always a sign of attack. This may produce false alarms that report incorrect information to the administrator if not implemented correctly [2]. Another problem is that anomaly detection systems could be tricked into accepting anomalous behavior: an attacker could make the system consider illicit activities as normal behavior if he has access to the system during the training phase [60]. In general, the methods to create and evaluate these profiles are computationally intensive and complicate real-time detection [2, 13]. DEFINITION 10 Misuse detection. An intrusion detection technique that defines patterns of abnormal activity and then looks for occurrences of those patterns in the monitored data streams. An occurrence signifies a potential intrusion [13, 126]). Misuse detection. The misuse detection approach assumes that intrusive activity can be described through patterns and that those patterns can be captured by means of event strings or state machines [105, 187]. These systems identify signatures that contain information distinctive to an attack (Figure 2.2). DEFINITION 11 Attack signature. A pattern or fingerprint that captures the essence of an attack and which can be used to identify the attack when it occurs [142]. Monitoring programs observe the different data streams present on the system and match them against a bank of attack signatures [170, 194, 53, 72]). Misuse detection is a pattern matching method. Once signatures are generated, the problem reduces to one of search and matching. The primary difficulty of this approach is to generate signatures that correctly represent what constitutes intrusive actions [126]. Signatures that are too specific may not catch slight variations of an attack, and signatures that are too flexible might generate false alarms by flagging as intrusive activity that is not. – Advantages of misuse detection. Misuse detection techniques do not consume as much resources as anomaly detection methods do. The processing of signatures can be highly optimized as to comply with performance expectations by adjusting parameters in the matching algorithms [194, 75]. Thus, the rate of false alarms can be controlled since matching accuracy and signature specificity constitute a trade-off directly bound to the security level these systems offer [126]. – Disadvantages of misuse detection. Signatures need to be very precise for them to be useful and the task of signature specification is rather time consuming and requires a high level of expertise [13, 126]. In the event an attack signature overlaps with licit behavior, false positives may arise. If the signature is not specific enough the attack will go unnoticed and will compromise the security of the system. The main disadvantage of this approach is that, as opposed to anomaly-based intrusion detection, it cannot detect threats for which a signature has not been produced. Signature banks must be permanently updated and signatures need to be defined and tuned in order to detect new attacks..
(33) 15. 2.1. INTRUSION DETECTION. Intrusive sequence System activity stream. 09E4308FFCD3A09D8B9D80BB08E80D4A6D4A Detection system. BB, 3D, 25,33,2F F2,F3,F4, ... Invalid sequences. Figure 2.2: Misuse-based intrusion detection.. Hybrid methods. The two main approaches, anomaly and misuse detection, have advantages that complement each other. In fact, a breed of hybrid systems are the ones dominating the market and some more have become successful research projects (e.g., [164, 205, 77, 187, 46, 194, 140, 5]. These systems are fed with attack patterns they will detect and, at the same time, implement learning and profiling algorithms to necessary to identify invalid actions [90, 2]. The solution hybrid intrusion detection systems provide is richer detection-wise as they typically access two or more information sources which gives them the advantage of having more data elements to draw conclusions from. By correlating information of a normality profile with evidence of a particular attack, a system will be in a better position to accurately identify illicit behavior [60].. 2.1.3. Detection techniques. In order to perform the actual task of detecting unusual events from evidential data, intrusion detection systems have made use of many different techniques. This section outlines the most representative methods developed to date (we include the techniques surveyed by Kumar and Spafford in [104] and extend the list with more recent detection mechanisms): 1. Frequency-based detection. This was one of the first anomaly detection methods developed (it first appeared in Denning’s seminal paper [49]). It captures frequency patterns of users and programs through profiles that contain abnormality values P1 , P2 , ..., Pn corresponding to a set of n system measures (i.e., representative system variables). In order to determine whether the system has encountered an unstable state, the observed frequency values fi are combined through an expression such as: γ = a1 f12 + a2 f22 + ... + an fn2 ; ai > 0. . . . (1). which captures frequency information for all the measures using a series of weights ai . This technique detects intrusions by computing security level γ on a permanent basis and comparing it to a threshold value δ. If γ > δ, an intrusion may be underway [182, 104]..
(34) 16. CHAPTER 2. BACKGROUND. The different measure types that can be evaluated are diverse and can be divided into three main types: (1) ordinal measures (such as the number of files open by a certain device in a given period of time), (2) distribution measures (such as the statistical distribution of CPU utilization during the day), and (3) categorical measures (such as the number of successful transfers and the number of failed transfers requested to a DNS server). Profiles capturing normality values could be of the form: <U, file, execute; Error(0), CPU(00:01-00:04), ExpectedExec(10:00-11:30)>. This could indicate that whenever user U executes f ile, no errors are expected, CPU processing is likely to fall between 1 and 4 seconds, and the execution is expected to take place between 10:00AM and 11:30AM. This way it is possible to identify an intrusion if it rises the value of a measure over the limits stipulated in the profile [66]. If a program is described through the system calls it uses, a frequency profile can be built in order to describe its most common behavior (Figure 2.3): Sequence of system calls ... read(6, "/dev/hda3 / ext3 rw 0, 4096) = 211 close(6) = 0 munmap(0x40017000, 4096) = 0 open("/proc/stat", O_RDONLY) = 6 fstat64(6, {st_mode=S_IFREG|0444, st_size=0, ...}) = 0 mmap2(NULL, 4096, MAP_PRIV|MAP_ANONY, −1, 0) = 0x40017000 read(6, "cpu 5989400 9772 1400819 982758"..., 4096) = 312 read(6, "", 4096) = 0 close(6) = 0 munmap(0x40017000, 4096) = 0 open("/etc/toprc", O_RDONLY) = −1 ENOENT .... Frequency profile close create mmap2 execve fdsync fstat read getgid. 9 45 38 27 68 13 74 32. connect creat64 dup fcntl fork fstat64 getmsg getpgid. 66 57 26 15 34 17 49 68. Figure 2.3: A frequency system-call profile describing the behavior of a program [147].. This profile describes how often the program requests each of the system-call it uses. Taking this profile, if we observe that, for instance, the number of close() system-calls is up to 30, it is likely that there is a problem on the system. 2. Probabilistic detection models. Let A1 , A2 , ..., An be n different measure variables which can take one of two values: 1 to indicate the measure is anomalous, and 0 otherwise. Let I be the hypothesis that the system is undergoing intrusion. The sensitivity of each measure Ai is determined by P (Ai = 1|I) and P (Ai = 1|¬I). By combining these probabilities we can determine the likelihood that the system is undergoing attack given the values of the measures: P (I|A1 , A2 , ..., An ) = P (A1 , A2 , ..., An |I) ×. P (I) P (A1 , A2 , ..., An ). . . . (2).
(35) 17. 2.1. INTRUSION DETECTION. This requires the joint probability distribution of the measures given I and ¬I [104]. Assuming probabilistic independence of the measures, obtaining P (A1 , A2 , ..., An |I) would be reduced to: n Y P (A1 , A2 , ..., An |I) = P (Ai |I) . . . (3) i=1. and P (A1 , A2 , ..., An |¬I) =. n Y. P (Ai |¬I). . . . (4). i=1. A more realistic example would take into account the interdependence of the various measures. Lunt et al. [115] accomplished this through the use of covariance matrices. The compound anomaly of the system using vector A = [A1 , A2 , ..., An ] is given by AT C −1 A. . . . (5). where matrix C stores the interdependence between each pair of anomalies Ai and Aj at C[i, j]. Through a covariance matrix it is possible to consider the fact that the inputs that intervene in security diagnosis are interrelated [143]. 3. Bayesian networks. Detection models using Bayesian learning take the basic structure of probabilistic detection in which a measure variable may affect others [183, 172]. This information is used to create belief networks called Bayesian networks in order to graphically represent causal dependencies between random variables. These networks are directed acyclic graphs and are able to compute joint distributions by specifying only a subset of probabilities corresponding to the neighbors of a node (Figure 2.4). Conditional Probability Tables (CPT’s). Intrusion. Too many users. P(Intrusion). P(Fragmentation) Disk I/O. Fragmentation. CPU. Net I/O. . . .. Database queries. Figure 2.4: A simple Bayesian network connecting intrusion-related variables. CPT’s store a-priori probabilities such as the probability of intrusion and the proportion of disk fragmentation. . Bayesian networks use sets of conditional probability tables (CPT’s) that store probability values corresponding to the random variables given certain preconditions. These probabilities are usually taken from the experience of past events and contribute to effectively predict the.
(36) 18. CHAPTER 2. BACKGROUND. desired variable [94]. Intrusion is determined with a certain probability given the presence or absence of evidence. Figure 2.4 shows a small network which can be used to answer questions such as “what is the probability of intrusion given the observed level of disk fragmentation?”, or “what is the probability of intrusion given that the number of current logged-on users is high and CPU load is low?” 4. Conditional models using event sequences. Instead of considering system measures, this is a technique that detects irregular activity based on sequences and sub-sequences of events E = [e1 ≺ e2 ≺ ... ≺ en ], where ei is an event of type i and ≺ represents event precedence in time. These algorithms try to come up with a value for P (I|E) where I indicates the probability of intrusion and E the probability of occurrence of an event pattern. Bayes calculus [173] can also be applied to determine how likely intrusion is given that pattern E appeared: P (I|E) =. P (E|I) × P (I) P (E). . . . (6). An experienced system administrator could quantify approximates of a-priori probabilities such as the probability of occurrence of a given sequence of events at a certain time frame. It is then possible apply a probabilistic method that will be the one detecting intrusions and intrusion attempts. This model becomes complex when it is necessary to consider the large amount of intrusion patterns that can be observed on a system [104]. 5. Expert systems. Expert systems have also been used in intrusion detection [181, 91, 105]. These systems embody the knowledge of an expert in order to identify unusual data and irregular actions. They are classified as anomaly-based as they explicitly specify the patterns to look for [103]. The success of these methods is directly related to two factors: (1) the expertise of the security officer that will be used as input to the detection mechanism, and (2) the effectiveness of the implementation to coherently structure the expertise of the human into a computer program. Expert systems have also been used to interpret system measures in intrusion detection, however, the well-known limitations of this approach for doing uncertainty reasoning have stopped the progress in the area [104]. 6. Inductive generalization. This is a rule-based approach which characterizes the behavior of a system or user using inductive generalization under the assumption that system events can be predicted [80, 200]. A set of rules of the form: Ea → Eb → Ec ⇒ (Ed = 0.95, Ee = 0.05). . . . (7). expresses the probability of seeing an event appear after a sequence of other events. For instance, once events a, b, and c have appeared sequentially, event d is 95% likely to appear, and e will appear with a probability of 5%. These are both normal, acceptable sequences..
(37) 19. 2.1. INTRUSION DETECTION. Rules help to know beforehand the probability of being under attack given a set of observed patterns [200]. Events will be flagged as intrusive when they match the left-hand side of a rule but diverge on the probabilities that appear in right-hand side. It is claimed that if an intruder tries to guide the rule-learning phase as to accept irregular activity as normal, the very meaning of rules can help determine something irregular has been captured [200] (i.e., rules are easily read and interpreted by administrators). This anomaly-based method has a major weakness: any unknown attack which does not match the left-hand side of a rule will not be even considered for further inspection. 7. Neural networks. Supervised learning methods have also been used in intrusion detection. These methods develop classifiers that predict output values based on a set of input attributes. Neural networks can be used for supervised learning and have proved effective at classifying different sorts of data when complemented with pruning, early stopping, and other heuristics [174, 27, 173]. A neural network contains a set of nodes organized into layers. Input and output layers are interconnected through one or more intermediate layers and the learning is performed by updating edge weights and adapting the parameters of the functions present on each node. Output layer. Input layer. login ls. i. wij j. cp. chmod mail ln chown. Figure 2.5:. A sample neural network with window that predicts the next command once n commands have appeared in the input (window size is n = 3.. In the case of intrusion detection, a neural network can be used to to predict the next event to appear. For instance, the command history of a user can be used to train a neural network. Once training is done, a window of k commands will be sliding in time in order to monitor the activity of the user. If the neural network indicates that after certain k events, event ej should follow and a different event is observed, an alarm is activated. Similarly, system calls can also be predicted after a training phase that will identify interdependencies among system-call streams hereby creating a sense of normality for the system [64]. Figure 2.5 shows a small network that predicts the next command given a three-command input. Command sequences must be divided into windows so that supervised learning can take place. In this case, the window will be moving one command at a time and will use three commands as input in order to determine which of the output values is more likely to.
(38) 20. CHAPTER 2. BACKGROUND. appear next. Training time is the main restriction of the neural-network approach for the problem of intrusion detection. However, it deals very well with noisy data [174]. 8. Attack scenario models. This misuse-detection approach describes attacks through sequences of behaviors called scenarios [68]. A database containing attack scenarios is accessed by the monitoring system in order to tell which of the scenarios is most likely to be present at a given time. These systems update the database using evidential reasoning calculus. The use of a mathematicallysound theory like evidential reasoning makes retraction of intermediate conclusions easy as evidence to the contrary accumulates. When determining the behavior to look for next, the system tries to maximize a factor αx defined by: αx =. P (Sx |B) P (Sx |¬B). . . . (8). where Sx is a scenario and B corresponds to a behavior that confirms the presence of such scenario. Like other misuse detection systems, building attack scenario models require high levels of expertise and continuous updates [104]. 9. Petri nets. This is a misuse detection technique which models attacks through Petri nets [105, 103]. Petri nets are graphs composed by states and conditions which have well defined semantics. The transitions from a start state into a final state describe the evolution of attacks. Petri nets have been used to model system events such as user commands and system calls (two popular types of input data used to detect intrusion). The graphical representation provided by a Petri net conveys an intuitive understanding of the events that compose an attack and allow for the representation of partial order as well – finite-state automata have also been explored in a similar way [201]. Rather than handle fixed sequences of events, Petri nets can describe series of events that are loosely connected to each other. Figure 2.6 shows a net describing an attack scenario. The steps that compose an attack may have variable precedence relations not being part of an absolute-order sequence.. 1. 2. 3. 4. 5.. cp /bin/sh /usr/spool/mail/root chmod 4755 /usr/spool/mail/root touch x mail root < x /usr/spool/mail/root. s4. t1. touch. t3. s5. t4. t2. s6 Compromise state. (init) s1. cp. s2. chmod. s3. mail. Figure 2.6: A Petri net corresponding to a partial order of events leading to a compromise state [103]. Petri nets allow us to describe and match partially ordered sequences as an alternative way of visualizing attack scenarios. In Figure 2.6, state s5 may be reached well before or after an.
(39) 21. 2.1. INTRUSION DETECTION. alternate transition reaches s3. “A partial order state transition analysis allows more than one sequence of events in the state transition diagram” [66]. A single diagram can be used to represent several intrusion scenarios involving the same set of actions. This simplifies modeling and speeds up detection. 10. Genetic programming. Many security systems use monolithic programs to perform intrusion detection functions. A different approach is to have multiple small programs in charge of simple monitoring tasks. These programs can be further evolved through Genetic Programming techniques so that the best candidate for a determined task can be found [41]. Genetic programming is a machine-learning method derived from Genetic Algorithms which evolves a population of programs, and not a population of sample points, to solve a problem. Possible solutions are represented as parse trees whose component nodes are manipulated through genetic operations such as crossover and mutation. A fitness function aids in the identification of the best individuals (i.e., programs). In the case of intrusion detection, normal and abnormal activity is presented to the programs in order to evaluate how well they do at distinguishing between the two. Figure 2.7 depicts a sample parse tree corresponding to a block of code whose purpose is to watch for packets arriving at a host but destined for another host [41] (a simplistic way of determining something wrong may be happening). Packet Data. FOR_EACH_PACKET DO IF( ip−destination−address−of−packet NOT_EQUAL my−ip−address ) THEN Generate(alert−broadcast) END_IF END_FOR. IF. RAISE. IP−NEQ. IP−DEST. MY−IP. Figure 2.7: A parse tree corresponding to a program that can be evolved through Genetic Programming to detect a security-relevant event [41].. Each component of a program, which can be expressed using different languages and graph structures, will be moved from place to place connecting with other different nodes during the evolution stage. This will last until the component finds the location at which it can produce best detection results to the program as a whole. Important to notice that a good.
(40) 22. CHAPTER 2. BACKGROUND. number of combinations will produce incorrect trees from the programming logic perspective whose fitness will be low. These will be discarded and the best ones will be selected to implement the intrusion detection strategy. 11. Embedded sensors. Another technique called embedded sensors [223, 98] proposes the use of code segments that are inserted into programs during the development phase. These code segments automatically search for abnormal conditions at execution time including well-known error or attack conditions such as stack overrun and data-type abuse (Figure 2.8). 1 char buf[256]; 2 strcpy(buf, getenv("HOME"));. 1 2 3 4 5 6 7. (a) Code before inserting sensor. (b) Code after inserting sensor. char buf[256]; { if( strlen(getenv("HOME")) > 255) { log_alert("buffer overflow"); } } strcpy(buf, getenv("HOME"));. Figure 2.8: Code vulnerable to buffer overflow before and after embedding a sensor into it. On the left side, lines 2–6 form the embedded sensor [223].. The type of checking these tools provide is equivalent to the implementation of good coding practices with the difference that sensors can be specific to certain attack types and are reusable. Among the disadvantages of this approach are the need to have the source code of the program to protect, the need to implement sensors in the same language as the program, and reduced portability [59]. 12. Functional dependency checking. This is a recent misuse detection approach based on functional dependencies present in a program. In order to perform certain actions, a function executes others that provide the results it needs. At each function call, one function is the caller and other is the callee. Caller-callee relations can be captured through a graph using executable or source code: at run time, the runtime stack can be read in order to determine what are the functions being called by each function; by looking at the source code, it can be determined the same type of information but at a higher level [71]. These dependencies are characteristic to a software program and it is possible to implement a monitor which detects graph transitions not present in the graph (system-call precedence as well as regular function-calls can be used; [211, 186, 201]). Figure 2.9 shows an example of this approach. The structure of a program is analyzed as to create a graph describing the relationships among its functions. This graph is built during a training phase when legitimate behavior is exercised and captured by the graph. Once in detection mode, if a security monitor observes a transition that is not present in the program’s graph, it is likely that the program has been altered [186]..
(41) 23. 2.1. INTRUSION DETECTION. Program code main() { IF ( x == 1) { f1(); f2(); } ELSE { f3(); } } f1() { f2( f(5) ); } f2() { f4(); }. Function−to−function transitions. f1() Intrusion. main(). f2(). f4(). f3(). f5(). f3() { f5(); f3(); }. Figure 2.9: Caller-callee relationships are distinctive of a program and can be used to identify abnormal behavior. An unexpected transition may be indicative of anomalous activity (see dashed line; no such transition exists in the actual program).. 13. Data mining. Some researchers have studied ways to apply data mining techniques to intrusion detection [114, 113]. Data mining is concerned with the discovery of new knowledge in large data collections. This discipline employs machine learning and statistical analysis methods to identify hidden patterns and trends a human would not be able to detect efficiently on large databases. Inferred patterns or rules allow the prediction of future results and, in the case of intrusion detection where the amount of data to inspect is quite large, this kind of prediction can help detect furtive attempts to circumvent the security of a system. For example, suppose that 10% of the packets received by a host have the SYN and ACK flags on and that 30% of the packets that have the ACK flag on also have the SYN flag on. These two variables could be associated using a rule ACK ⇒ SY N with support degree s = 0.1 and rule confidence c = 0.3: ACK ⇒ SY N. s = 0.1, c = 0.3. . . . (9). Rules like this can be computed for different components in order to build a normality profile that helps identify illicit activities [112]. 14. Fuzzy data mining has also been studied [22]. The integration of fuzzy logic with data mining helps create more abstract patterns at a higher level. Rather than describing a measure through an abnormality range [a, b], a security incident can be described using terms such as “high” or “low” which are more easily interpreted by humans [212]. By incorporating this concept to data mining, a value can contribute to the support of more than one fuzzy set. For instance, we can have a rule:.
(42) 24. CHAPTER 2. BACKGROUND. {SY N = LOW, F IN = LOW } ⇒ {RES = LOW }. s = 0.5, c = 0.9. . . . (10). where SY N is the number of synchronize flags, F IN is the number of finalize flags, and RES is the number of reset flags in a certain time period. Instead of having numeric values describing these figures, fuzzy terms are introduced to give more flexibility to the rule. Fuzzy sets describing these terms (e.g., LOW , HIGH) would have to be created in order to map the input before performing intrusion detection [22]. 15. Support Vector Machines. Support vector machines (SVM) are one of the most recent supervised-learning methods and is based on the addition of dimensions that allow for regression methods to be executed [135, 219, 130]. SVM’s are constructs that perform binary classification. A set of input data points are mapped into multidimensional-space vectors using kernel functions so that they can be split into two classes. Y. +. +. +. +. − −. − − 0 −. −. −. − Feature space. −. +. −. +. − − −. +. +. + + + + +. − −. +. − − − − −. +. + +. + +. +. Support vectors. +. +. Margin δ. X. + Classifier. Figure 2.10: SVM splitting the feature space into two classes (they could represent normal and irregular behavior).. Some of these vectors are selected to define the boundary between the classes, and a hyperplane is computed through regression in order to split the input. It is then gradually adjusted by minimizing a marginal-error distance δ measured from the representative vectors (i.e. support vectors) to the hyperplane. It then becomes an optimization problem. Just like neural networks, SVM’s are trained in order to create classifier functions that help separate normal from abnormal activity. The training speed of SVM’s is one of its most notable characteristics as well as its scalability (SVM’s are “relatively insensitive” to the number of input data points [219]). They can learn large pattern sets and are able to scale better than neural networks..
(43) 25. 2.1. INTRUSION DETECTION. Figure 2.10 shows an example of a SVM on a bi-dimensional feature space. Vectors vi = (xi , yj ) ∈ X × Y × {±}1 (which could represent packet information such as packet length and checksum) are classified by a linear function which has a variable marginal distance δ determined by support vectors close to the boundary. This margin should be maximized in order for classification to be accurate. SVM’s have been used to predict security events and also to classify system behavior and fingerprints [135, 219]. 16. Planning. An approach presented in [66] involves the construction of partial-order plans (i.e., partial-order subsequences) that limit the exponential growth of the number of states in a state-machine representing an intrusion scenario [173]. A planner builds “plans that achieve goals which describe situations that are desirable to an intruder” [66]. A monitor will search through the set of active plans and not through the set of all possible situations, hereby reducing overhead. A planning program for intrusion detection will use a knowledge base which contains dependencies between actions. These dependencies will be used to create alternative plans. For example, the arrangement of preconditions Pi necessary for achieving a certain state S can be given by an expression like: (P1 , P2 , ..., Pk ) ∧ (Pi ≺ Pk ) ∧ ... ∧ (Pj ) ≺ Pm. . . . (11). which could be used to represent a more concrete plan:. (cp, chmod, touch, mail) ∧ (cp ≺ chmod) ∧ (chmod ≺ mail) ∧ (cp ≺ mail). . . . (12). That means, a set of actions need to appear and they must keep some relative precedence among them. A plan is started with a start state and further steps are added as preconditions appear. A planner uses precondition sequences to generate attack schemes that can be then validated with Petri nets or a similar tool [66, 104]. First order logic can be also used to capture a penetration plan using the same approach. For example: ∃ f ile1 , f ile2 , f ile3 , x owner(f ile1 ) = x ∧ cp(f ile1 , f ile2 ) ∧ chmod(f ile2 , 4755) ∧ touch(f ile3 ) ∧ mail(root, f ile3 ) ∧ cp(f ile1 , f ile2 ) ≺ chmod(f ile2 ) ∧ chmod(f ile2 ) ≺ mail(root, f ile3 ) ∧ touch(f ile3 ) ≺ mail(root, f ile3 ) ∧.
(44) 26. CHAPTER 2. BACKGROUND. ⇒ attacker(x) which represents the conditions necessary to determine x is an attacker. Inference engines can be used to evaluate such plans with strong logic support. Each condition is evaluated and, in case all the conditions of a given plan are given, the system is able to tell intrusion is occurring. 17. Bioinformatics sequence-alignment methods. Sequence alignment is key to determine the similarity between two DNA sequences. Nucleotides or amino-acids are aligned in each sequence and a score is computed as to tell how well the sequences align with one another [39]. Pattern-matching algorithms originally developed for quaternary logic can be applied to determine the similarity between an input and an attack stream (Figure 2.11).. GTGACAAGCCAC−−AAGAGG−−−CCTT−−AG −−|−−−|−−|−|−−−||−−−−−−−−−|−−−| −−GGAGAC−CCCG−TAGGAA−−−−GATAGCG Key: | = match − = gap. Figure 2.11: Example of DNA sequence alignment [39].. These methods are adapted to inputs consisting of more than four event types (i.e., the number of system-call types on Linux environments are over 200). In general, alignment of observed commands with long attack patterns is rewarded without heavily penalizing gaps or misalignment. The reason is that a matched subsequence is highly relevant for intrusion detection compared to misaligned subsequences. Matrices and n-dimensional data structures are built in order to compute the matching score of an input against n attack patterns. As shown in Figure 2.11, protein patterns slide over the input similarly to other matching algorithms [104, 37]. The main difference with binary matching methods is that Bioinformatics algorithms involve more than two input symbols, which allow them to be extended more easily to the case of intrusion detection sequences where the input domain has more symbols.. The techniques above are some of the most common methods utilized to detect illicit activity in computer systems. Table 2.3 at the end of the chapter lists the reviewed techniques and classify them according to three main points: (1) their basic approach (anomaly-based intrusion detection (AID), misuse-based intrusion detection (MID)), (2) their foundation (probabilistic method or learning method), and (3) the data source they can use (audit information, network packets, or a different type)..
(45) 2.1. INTRUSION DETECTION. 2.1.4. 27. Data collection and fusion. Data sources Intrusion detection is based on information collection and processing. Multiple data sources are available to systems that try to identify suspicious symptoms. The first intrusion detection tools were monolithic architectures and would process data at a single location [49]. With the expansion of information systems, more data sources became available and intrusion detection systems diversified by specializing on specific data sources. There exist two main aspects that can be taken into account for classifying intrusion detection systems [13]. By the data they use they can be: (1) host-based systems, or 2) network-based systems. By their processing methods they can be classified as: (1) centralized, or (2) distributed. We now describe these four categories which are relevant to the architecture proposed by this dissertation. (1) Host-based intrusion detection These systems are designed to protect a single server by scrutinizing large amounts of data contained in audit trails or log files as well as other system data structures. These files describe a system by keeping a record of every atomic service requested and every problem reported by the kernel and applications. The design of audit trail modules and audit data reduction are research areas in information security that aim at improving the quality (i.e., expressiveness and regularity) of the information stored by historical records. Auditing was considered a secondary aspect of operating systems [4, 56] but now, due to the importance of computer security, there are numerous projects devoted to create consistent models that provide the operating system and intrusion detection tools with security-relevant information in a format that can be queried by automated entities [107, 90]. An audit tuple typically consists of fields such as user id, process id, log-on time, permissions mask, and even system-call numbers and system-call types. This information can be used to detect some types of attacks, but it does not suffice for catching others. Not all operating system events are recorded to audit files [56]. There are actions that actually take place but do not leave any trail of its execution. This constitutes a problem for auditing and intrusion detection systems since important data may be missing which would otherwise enable them to find an intruder. The processing of audit data is expensive as the number of audit records generated by users and applications can be huge (in fact, for audit data to be suitable for intrusion detection it is typically necessary to enable full-audit mode on the host. This produces large files that are not easy to handle and prevents real-time execution forcing security checking to be performed off line. Additionally, audit data is prone to modification by an intruder as it is regularly stored on disk. System data structures are another source of evidence available on the host. As a process executes, it modifies its environment through actions. The changes can be observed on user tables, open-file tables, disk reads and writes, the process table, etc. This sort of data is more reliable from the security perspective as it is more difficult to be tampered with (alterations to system data structures are more evident [125, 101]). The disadvantage of basing a design on this.
Figure
![Figure 2.3: A frequency system-call profile describing the behavior of a pro- pro-gram [147].](https://thumb-us.123doks.com/thumbv2/123dok_es/2287526.514990/34.918.114.787.514.704/figure-frequency-profile-describing-behavior-pro-pro-gram.webp)


![Figure 2.12: The increasing sophistication of attacks and the decreasing ex- ex-pertise of users [2, 126].](https://thumb-us.123doks.com/thumbv2/123dok_es/2287526.514990/52.918.151.732.172.541/figure-increasing-sophistication-attacks-decreasing-ex-pertise-users.webp)
+7


Documento similar
The resource-constraints put forth many challenges to apply the available standard security protocols such as Transport Layer Security (TLS), Internet Protocol Security
The work presented here is part of a larger study to identify novel technologies and biomarkers for early AD detection, and it focuses on evaluating the suitability of a new
• WSSecTech (Web Service s Security Technologies): The main purpose of this stage is to identify a set of WS security standards that will implement the security services identified
The methodology developed for security management and its maturity in SMEs will allow any organization to manage, evaluate and measure the security of it information systems, but
We justify the importance and motivation of security in the migration of legacy systems and we carry out an analysis of different approaches related to security in
MeSSa 2010 addresses research and experimentation results in the development of security metrics, security assurance metrics and security measurement solutions in the
To do this, enterprise security patterns put together in one cohesive pattern all the elements included in the enter- prise security architectures: (i) the information assets to
“A Common Criteria Based Security Requirements Engineering Process for the Development of Secure Information Systems ” [38] and “Towards security requirements management for
