Mechanical and microstructural characterization of dispersion strengthened Al–C system nanocomposites
17
0
0
Texto completo
(2) https://cimav.repositorioinstitucional.mx/jspui/ Dispersion strengthened materials belong to the group of composite materials made by powder metallurgy (PM) techniques. The microstructure of these composites materials is composed of a polycrystalline matrix, in which dispersed particles are incorporated (typically oxides, carbides and/or nitrides) to reinforce the matrix [1]. The strengthening effect due to the presence of reinforcement particles is the result of elastic interactions between the particles and matrix dislocations, which inhibit dislocation motion. However, the efficiency by which reinforcement particles strengthen the matrix depends on their type, size, morphology, volume fraction and overall distribution. In the case of coarse particles, where the inter-particle distance is large, the strengthening effect is typically not significant. In contrast, the presence of highly dispersed nanoscale reinforcement particles (smaller than ∼100 nm) in a matrix can lead to significant enhancements in strength [2].. Among the others, the PM methods are unique because they can produce metalmatrix composite (MMC) materials, with uniform particle distributions, which would be impossible to produce by conventional ingot metallurgy [3]. Furthermore, by combining PM methods with mechanical milling (MM), which provides additional refinement of the matrix’s microstructure, a new generation of materials, called nanocomposites, can be produced [4,5]. These novel metal-matrix nanocomposites (MMNCs), which consist of a metallic matrix with a fine microstructure, reinforced with nanoscale particles, are very promising for various applications due to their unique mechanical properties. In this regard, the development of high-performance MMNCs inevitably involves the development of constitutive relationships that can predict their mechanical properties as. 2.
(3) https://cimav.repositorioinstitucional.mx/jspui/ a function of processing conditions and microstructure (grain size, dislocation density and composition of the matrix, as well as the properties of the reinforcing-phase). In this context, X-ray diffraction peak profile analysis is a wellestablished technique for the determination of microstructure in terms of dislocation density and subgrain size in crystalline materials. Diffraction peak profiles broaden when subgrains (or crystallites) are small or if the crystal lattice is distorted by lattice defects, especially by dislocations [6]. Until recently, different procedures have been used for the evaluation of X-ray diffraction profiles or patterns. The convolutional multiple whole profile (CMWP) method, produces the convolutions of model-based, physically wellestablished size and strain profiles and that of the instrumental profiles, and compares the so constructed and the measured diffraction patterns by using a non-linear least squares fitting procedure [7,8].. In this work, the CMWP procedure is used to determine the crystallite size distribution and the dislocation density, based on X-ray diffraction data. The results, determined by the CMWP method, are then compared with those obtained from atomic. 3.
(4) https://cimav.repositorioinstitucional.mx/jspui/ force microscopy (AFM). Additionally, the crystallite size and dislocation density effect on the microhardness were determined for each sample by using theoretical models and compared with experimental microhardness values. The main aim of this work was determinate the nanographite particles dispersion effect on the Al matrix strengthening. Experimental procedures Al-based nanocomposites were produced by mixing Al powder (99.5% purity) and various powder mixtures composed of graphite and Cu-graphite (previously milled) powders (Table 1). Each Al–C and Al–C–Cu mixture was mechanically milled in a high energy Spex mill for 4 h. Argon was used as the milling atmosphere. The device and milling media used were made from hardened steel. The milling ball to powder weight ratio was set to 5:1. Consolidated samples were obtained by pressing the powder mixtures for 2min at ∼1200MPa in uniaxial load.. Microstructural characterization was performed by atomic force microscope. (AFM) DIGITAL, Model Nanoscope IV-a Multimode, equipped with tapping and tunneling. In addition, the as-milled specimens were studied by X-ray diffraction. The diffraction profiles were measured by a Philips X’pert powder diffractometer using a Cu cathode (λ = 0.15406 nm). The step size and step time were 0.02° and 5 s, respectively. X-ray diffraction peak profile analysis was carried out to determine the crystallite size distribution and the dislocation substructure of the nanocomposites studied using the CMWP fitting procedure program. We have assumed that strain is caused by dislocations [8]. The lattice parameters of the various nanocomposites were obtained from the positions of the X-ray diffraction peaks calculated by the Rietveld method. Microstructural observations were performed by using a transmission electron 4.
(5) https://cimav.repositorioinstitucional.mx/jspui/ microscope TEM (Philips CM-200) equipped with energy dispersive spectrometer (EDS). The material’s hardness was measured by a Micro Hardness tester (FM-07), using an indentation time of 10 s and a maximum load of 200 g. Results and discussion Experimental results: The X-ray diffraction patterns of the samples with 0.75 wt.%C and pure Al are in Fig. 1, the diffraction patterns show no appreciable differences between them and only the Al phase peaks are observable. The X-ray diffraction results obtained from Al–C, Al–C–Cu samples and pure Al are summarized in Table 2. In particular, this table shows the lattice parameter obtained from Rietveld analysis a, and the median m, the variance of the crystallite size distribution functions σ, the dislocation density ρ and the mean crystallite size d obtained from the CMWP program. The microhardness H (HV) and standard deviation (S.D.) from measurements made at various compositions of Al–C, Al–C–Cu samples and pure Al are in Table 3.. 5.
(6) https://cimav.repositorioinstitucional.mx/jspui/. where a is the lattice parameter obtained from Rietveld analysis and the dislocation density ρ, the median m, the variance, σ of the crystallite size distribution functions, and the mean crystallite size d obtained from the CMWP program.. 6.
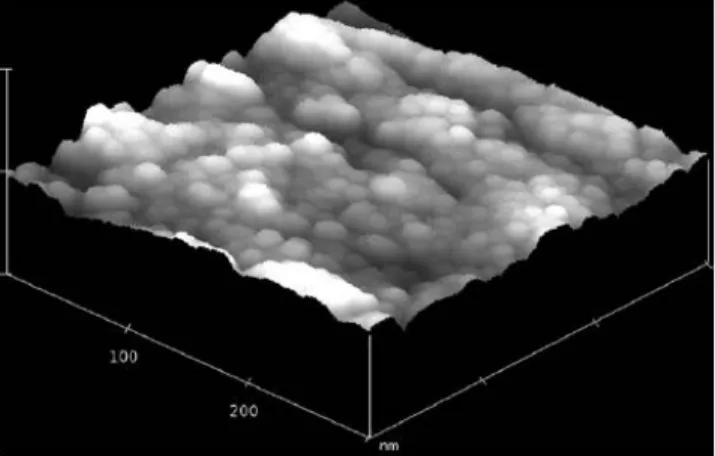
(7) https://cimav.repositorioinstitucional.mx/jspui/. Fig. 2 shows an atomic force image from the 75/50 sample in the as-milled condition. It is evident the relatively homogeneous crystal size ranging from∼10 to∼20 nm. The log-normal crystallite size distribution function determined with m and σ parameters from Table 2 for the 75/50 sample (see Fig. 3) is compared with the lognormal crystallite size distribution from the AFM image of Fig. 2. It is important to note that both curves show at maximum in a range from few nanometers of crystallite size to 7.
(8) https://cimav.repositorioinstitucional.mx/jspui/ ∼25 nm. Similar results were obtained by comparing X-ray with TEM analyses [9],. therefore, for subsequent calculations the mean crystallite size was taken from the Xray analysis. The mean crystallite size d influence on microhardness for Al–C, and Al–C–Cu samples at different C and C–Cu concentrations are show in Figs. 4 and 5, respectively. The microhardness of Al–C samples seem to follow a direct relationship with the crystallite size, in this case the microhardness increases as the crystallite size decrease from ∼45 to ∼25nm with the composition. On the other hand for Al–C–Cu samples, for a. similar interval of crystallite size decreases (from ∼45 to ∼23 nm) a significant. microhardness increase with composition is observable. This means that, for the Al–C– Cu samples, besides the crystallite size influence on microhardness, the particle dispersion effect on microhardness could be playing a significant role on microhardness where Cu is acting as a carrier in the graphite nanoparticles integration. To determine the graphite nanoparticles integration effect on the aluminum strengthening, the various strengthening contribution effects were analyzed separately.. 8.
(9) https://cimav.repositorioinstitucional.mx/jspui/ Strengthening hardness contribution: By superposing of every single contribution to strengthening (via hardness analyses), the microhardness (H) corresponding to the microstrength was expressed in the following way [10]:. where HPN is the Peierls–Nabarro strengthening hardness contribution, HSS is the contribution caused by solid solution, HD is the dislocations contribution, HC is the contribution by crystallite size, and HP is the direct contribution by particles dispersion. Because HPN contribution has a relatively low value as reported by [11] and HSS has a relatively low influence on the microhardness since the lattice parameter which is mainly related with solid solution [12] varies slightly with composition (see Table 2); both contributions are consideredcommonto all samples. Therefore, the sum of the these contributions named HL is. In considering the HP contribution, this is influenced by graphite nanoparticles (HGNP) strengthening dispersion effect, as a result, the model for H is then. The strengthening hardness effect by dislocations, HD is described by the modified Taylor equation [13,14]:. 9.
(10) https://cimav.repositorioinstitucional.mx/jspui/. where k = αMGb,Gis the modulus of elasticity in shear and is 26 GPa, b is the Burger’s vector 0.2863 nm, ˛ is the coefficient of the dislocation pattern hardness, Mis the Taylor factor and ρ is the dislocation density in the final condition. The strengthening contribution by crystallite, HC is described by Langford–Cohen [15,16]:. where d is the crystallite size and k1 =6Gb. Strengthening hardness effect for the Al–C samples: Since Al–C samples show a linear relationship (as mentioned previously) between the crystallite size and the microhardness without strengthening contribution by graphite nanoparticles (HGNP), the first three terms of Eq. (3) were used to model the microhardness experimental results of Al–C samples. First, the material constant k of Eq. (4), was determined by using α= 0.3 and M= 2 from [17] and the microhardess H (in GPa) values divided by 3 to approximates at yield strength [18]; the constant value is k = 1.48×10⁻⁶ nmHV.. 10.
(11) https://cimav.repositorioinstitucional.mx/jspui/ With the dislocation density ρ, mean crystallite size d values from Table 2, the constant k (previously determined) and microhardness mean valuesHfrom Table 3 for Al–C samples; the term HL, HD, HC, and k1 were determined by means of least square method and applying Eq. (3). The calculations yield the following results: HL = 48.88HV and k1 = 1303.3nmHV and the HD and HC values as a function of composition are in Table 4. Fig. 6 shows the contribution to the strengthening calculated curves: HL, HD, HC and the experimental microhardness mean values H for Al–C samples. In the graph is clear an important strengthening effect due to both crystallite and dislocation density as expected for materials in the as-milled condition. In addition, the graph also shows a good correlation between calculated curve for crystallite size contribution, HC and experimental microhardness mean values H for Al–C samples, which are consistent with Langford–Cohen prediction (see Eq. (5)). On the other hand, the relatively small k1 (change of microhardness with the crystallite size) is in good agreement with studies realized on nanostructured materials where at small crystallite size (below ∼25 nm) the. effect of the crystallite size on the microhardness is low [18].. The term HL which involves the strengthening hardness effect of Peierls–Nabarro HPN and solid solution HSS, has previously been considered relatively low, some authors have reported HL values of about 10MPa (∼3 HV) [11]. The hardness remaining quantity (∼50 HV) could be attributed to the Al2O3 particles contribution present in Al-based composites mechanical milled [19].. 11.
(12) https://cimav.repositorioinstitucional.mx/jspui/. According with the results, for Al–C samples, the graphite is mainly adhered to the aluminum powder surface during the milling and segregated out the aluminum 12.
(13) https://cimav.repositorioinstitucional.mx/jspui/ matrix. In this case the graphite is only playing the role of a processing control agent (PCA) resulting in a decrease of crystallite size [20]. Strengthening hardness effect for Al–C–Cu samples: The microhardness H for Al–C–Cu samples includes: HL, HD, HC and the graphite nanoparticles strengthening hardness effect, HGNP (see Eq. (3)). The term, HL determined before was considered the same for both Al–C and Al–C–Cu samples. The terms HD and HC were calculated with the Eqs. (4) and (5) respectively by using the dislocation density ρ and crystallite size d experimental results from Table 2 for Al–C– Cu samples and k and k1 material constants previously obtained for the Al–C samples. The HGNP contribution was obtained by simply subtracting (HL +HD +HC) of H for Al–C– Cu samples (Table 5). Fig. 7 shows the contribution to the strengthening calculated curves: HL, HD, HC and HGNP contribution. As expected, similar results to Al–C samples were found; however, in this case an important increment in the microhardness due to the graphite nanoparticles dispersion effect (HGNP) is observable. At seem the best ratio C/Cu correspond with the 150/50 sample which shows the best microhardness value. A high resolution TEM image of the 75/50 sample (see Fig. 8) shows a lamellar shaped graphite nanoparticle of about 5 nm long and 5 nm wide and the interplanar distance which correspond with the (0 0 2) plane of the graphite. At seem this kind of particles are responsible of the HGNP contribution. Finally, since graphite nanoparticles are potential nanosized precursors for aluminum carbide formation (Al4C3), it could be expected that with the sintering process the graphite nanoparticles could be crystallized in Al4C3 and end up finely dispersed into. 13.
(14) https://cimav.repositorioinstitucional.mx/jspui/ the Al matrix [21]. These very fine precipitates could strengthen the aluminum matrix by the precipitation mechanism with short sintering times [22].. Conclusions 14.
(15) https://cimav.repositorioinstitucional.mx/jspui/ By superposing all strengthening effect was possible to determine the dispersion strengthening effect of the Al–C–Cu samples. The graphite nanoparticles dispersed into the Al–C–Cu matrix are responsible of dispersion strengthening for samples in the asmilled condition. The crystallite size and dislocation density effect contribute in great measure to the total strengthening. Apparently the Cu content in the Al matrix promotes the graphite dispersion and incorporation into the Al matrix during the milling. Acknowledgements This work was supported by project CONACYT (75926). Thanks to E. TorresMoye, G. Vazquez-Olvera, A. Hernández-Gutierrez, Wilber Antúnez and D. LardizabalGutierrez for technical assistance. References [1] M. Tavoosi, F. Karimzadeh, M.H. Enayati, A. Heidarpour, J. Alloys Compd. 475 (2009) 198–220. [2] S. Goussous, W. Xu, X. Wu, K. Xia, Compos. Sci. Technol. 69 (2009) 1997– 2001. [3] H. Arik, Mater. Des. 29 (2008) 1856–1861. [4] H. Abdoli, H. Asgharzadeh, E. Salahi, Turk. J. Alloys Compd. 473 (2009) 116– 122. [5] M. Khakbiz, F. Akhlaghi, J. Alloys Compd. 479 (2009) 334–341. [6] W. Woo, L. Balogh, T. Ungár, H. Choo, Z. Feng, Mater. Sci. Eng. A 498 (2008) 308–313. 15.
(16) https://cimav.repositorioinstitucional.mx/jspui/ [7] L. Balogh, T. Ungár, Y. Zhao, Y.T. Zhu, Z. Horita, C. Xu, T.G. Langdon, C. Xu, T.G. Langdon, Acta Mater. 56 (2008) 809–820. [8] L. Balogh, S. Nauyoks, T.W. Zerda, C. Pantea, S. Stelmakh, B. Palosz, T. Ungár, Mater. Sci. Eng. A 487 (2008) 180–188. [9] T. Ungár, J. Gubicza, G. Ribárik, A. Borbély, J. Appl. Cryst. 34 (2001) 298– 310. [10] R.W. Cahn, P. Haasen, A.S. Argon, Physical metallurgy, in: Elsevier Science B.V. (Ed.), Mechanical Properties of Single-Phase Crystalline Media, Deformation at Low Temperature, fourth ed., Press Cambridge, MA, USA, 1996, pp. 1878–1955. [11] M. Besterci, J. Mater. Prod. Technol. 15 (2000) 356–408. [12] J. Gubicza, M. Kassemc, G. Ribárik, T. Ungár, Mater. Sci. Eng. A 372 (2004) 115–122. [13] G.E. Dieter, Mechanical Metallurgy, third ed., McGraw Hill, USA, 1986. [14] M.E. Kassner, Acta Mater. 52 (2004) 1–9. [15] M. Besterci, L. Kovac, Int. J. Mater. Prod. Technol. 18 (2003) 26–55. [16] G. Langford, M. Cohen, Trans. ASM 62 (1969) 623–638. [17] O. Velgosova, M. Besterci, P. Hvizdos, P. Kulu, Mater. Sci. 12 (2006) 199– 201.. 16.
(17) https://cimav.repositorioinstitucional.mx/jspui/ [18] M.A. Meyers, A. Mishra, D.J. Benson, Prog. Mater. Sci. 51 (2006) 427–556. [19] A. Santos-Beltrán, V. Gallegos-Orozco, I. Estrada-Guel, L. Bejar-Gómez, F. Espinosa-Maga˜na, M. Miki-Yoshida, R. Martínez-Sánchez, J. Alloys Compd. 434 (2007) 514–517. [20] L. Shaw, M. Zawrah, J. Villegas, H. Lugo, D. Miracle, Metall. Mater. Trans. A 34 (2003) 159–170. [21] Y. Zhou, Z.Q. Li, J. Alloys Compd. 414 (2006) 107–112. [22] V. Garibay-Febles, H.A. Calderón, F.C. Robles-Hernández, M. Umemoto, K. Masuyama, J.G. Caba˜nas-Moreno, Mater. Manuf. Process. 15 (2000) 547–576.. 17.
(18)
Figure
Documento similar