Agricultural production and employment in Colombia
39
0
0
Texto completo
(2) -. ... "'". ------_._-------. .,. -. ", .. nAL pnoDUCTION. AG 1\1 ~ftt'1' UBit. • •. ... •. ~. •. ... ". E MPI,OYMENT. in. '. lB'" . " lA,·, C· 0····-'. L·:· 10'.··,v,w. " •. ., " ,:. " \:i¡¡,.. \::~l".. "l?ll.·:: .f!!;r.. . .. :ur(. I. , I i(. al. -•. GUNARS. DAMBE'-. BIlIS THORBECKE. • OCCABIONAL. PAPBR. NO.:t. FEBRUARY, 1974. • ,IGWA. STAT8. UNllVEiHHTY 2U-d GRANT. PROGBAM.
(3) ... !hl. atudy la one of ten cas. atudlel prepared by Erik Thorbecke &Dd Cunar. Dambe and pub11ahed ln:. Comparativa Ana1y.ta o("Asrlcultuul Develop'Mnt and Employmeot Performance and Plunnlns. FAO, Roma, 1974.. !he authora are grateful t:) FAO for allowlnfl thl,a case Itudv to be rpproduced In the 1OW4 St.te Univpr~~ty ?ll-d"Grent Occ8,!~"!i Paper serles. The aboYe study 1. orlglna11y publl.hed .s Agricultural Planning Study #18 •. •. •. ,¡. -'.
(4) AGRlCULnJRAL PRODUCTION ANO EMPLOYMENT IN COLOMBIA. •. by. Cunara Dambe and Erlk Thorbeckc. Occa.lonal Paper No. 3 Fcbruary. 1974. Publ1caUon ol thl.. paper i. fundcd under the AID/211-d grant lo Iowa State Univerllty. All vicwe, interpretations, reC~!nd3tions. and concluR1ons exprctUJod in thi& pllpcr are those o[ the authofn anc not neccflPRrily thoBa uf Iowa Stat:a Univert;ity or the Agency for International Developmant..
(5) ------------------------1. PRESENT SlTUATION Colombla la richly ondowed with agricultural land Buitable for crops and llvestock and th_ro exlsts a range of altltudes that offer a varlatlon ln climate and, thereforo, a favorablo environment for dlver.ified agrlcultural output.. Land, howevcr, appears to be greatly underutilized.. According to 1960 eensu8, land under permanont and soasonal erops amounted to only 3.5 million hectaroa out of approxlmately 12.3 milllon hectares sultable for crops.. 5lmllarly, only abeut 14.2 million heetares vere. being used (mootly in a very extensivo manner) for beef and dairy production--a small fraetlon of the potential gra.lng land, especially when the use of the secminr,ly unlimited expanse of tha empty. lowlands in eastern Colombia) 1. eonsidered.. Llano~ (t~op!cal. Colombia i8 alBo relatjvply. rich in foreBta, mlneral., and 011 deposlt •• Extent of Poverty and Underutl1l.atlon of Laber In splto of the relatlvely rieh natural resouree endowment, thcre is. •. wldespread poverty and underutl1ization of human resource rosulting from laek of productivo emplo)'m.mt opportunlties in prcscnt day Colombia.. Eco-. nomic duaUsm 10 clearl)' visible beth in the country-side and urban area •• A rolatively 8mall segment of the population constitutes tho modern, high income sector "hich gen.ratos growth 4nd alGO absorbs most of 1ts benefits. !he majority oí peopl., however, are in the trod1tional, low incOllle Rector whic:h 1s bypa'ued by economlc progresa.. Here !ncomes are stllgnating.. often at the threshhold oC .ubs1stenco.. Colombia'. Dcpartmont of National. Planning ha. ".tlmated that in the past decad. ncarl)' 75 percant of tha total labor force vas in the tradltional sector. mostly in rural are4S. •. [9].. Underutl11E4tion of human roaources has been recognized 88 tho most serlous.
(6) 2. obstacle to economic development in Colombia.. Much has beco done in. recent years to assess the aize and na tu re oí the problem. 80. that develop-. ment strategies could be devised for sustained growth and a more equal aharing of benefits.. Following are some smuples of recent findins. which. indicate the extent of poverty and underutilization of labor. rt must be noted that figures conceming the extent of poverty, the 8i •• of un- and underemployment etc., differ quite substantially.. Such. v.riation reflects both differences in survey techniques and coverage, and the conceptual difficulties of measurement and comparison.. For ex-. runple, it is very difficult to measure and directly compare unemployment in rural and urban areas because, in rural Itructure clouds the distincticn. ~etween. ~reas,. the family and. c~nunity. those employed and unemployed.. Aloo seasonal agricultural unemployment has no comparable parallol in urban areas.. For these and other reSSDns the interpretation of thc abso-. luto level of unemployment and underemployment may be quite diffcrent. However, all studies agree that poverty 15 widespread 8nd serious, that. •. underemployment cut. deeply into the labor force, and that, if present trends continue, undcrutilization of labor and the distribution of tncorne will become worse. a). A thorough analysis concerning labor in Colombia has been under-. taken by the lnternational Labor Office (ILO) in 1970 [lJ.. Accord!ng to. thia atudy unemployment in the urban sector in 1962 was estimatcd at about 17 percent of the urban labor force, or at half a millton peoplc out of a urban labor force of sorne three mill1on.. lt was al so found that among. those employed, about one third received lese than three quarters ol the. •. m1nimum wage of 11.20 pesos per day and, therefore, could be considered underemployed, aince underemployment can also be defined in terma oí. tncomes below a certain mínimum..
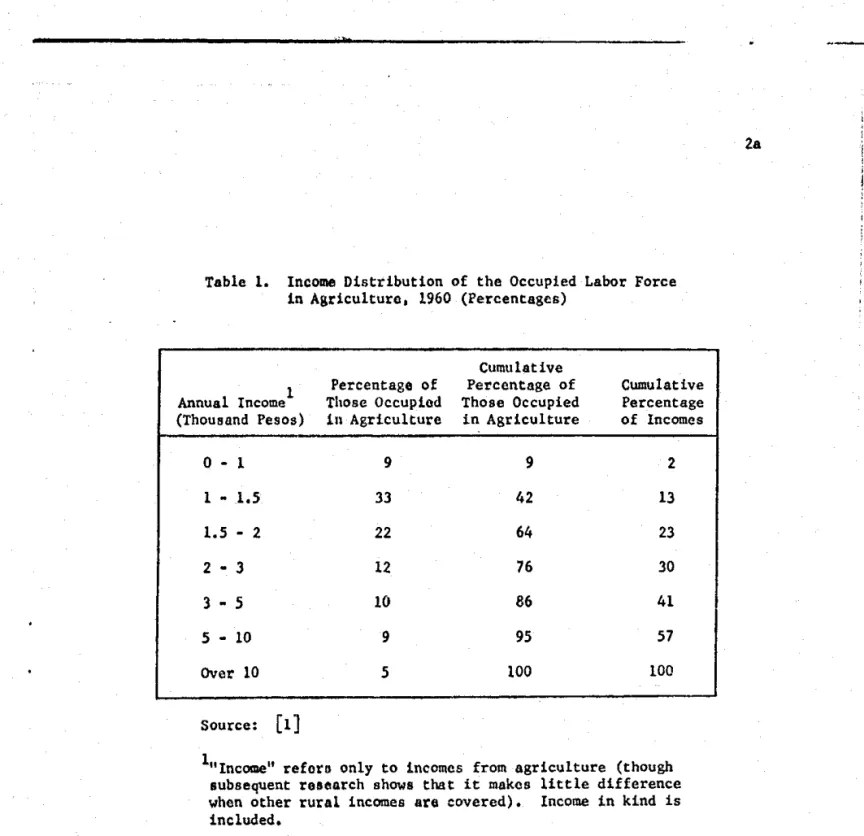
(7) .,. 2a. Table l.. lneome Distribution of the Oecupled Labor Force in Agricultura, 1960 (Pereentages). . Annual Income. 1. (Thousand Pesos). Cumulative Pere.ntsga of Those Occupied in Agriculture. Cumulative Percentage of Incomes. 9. 9. 2. 1 - 1.5. 33. 42. 13. 1.5 - 2. 22. 64. 23. 2 - 3. 12. 76. 30. 3 - 5. 10. 86. 41. 5 - 10. 9. 95. 57. Over 10. 5. 100. 100. O- 1. ~. Pereentage of Those Oeeupiod 1n Agriculture. Source:. [1]. 1"Income lt reforo, on1y to lncomcs from agricul.ture (though. 8ubsequent ro •• areh ShOW8 that it makcs little difference whan other rural incomes aro covered). lneome in kind i. included..
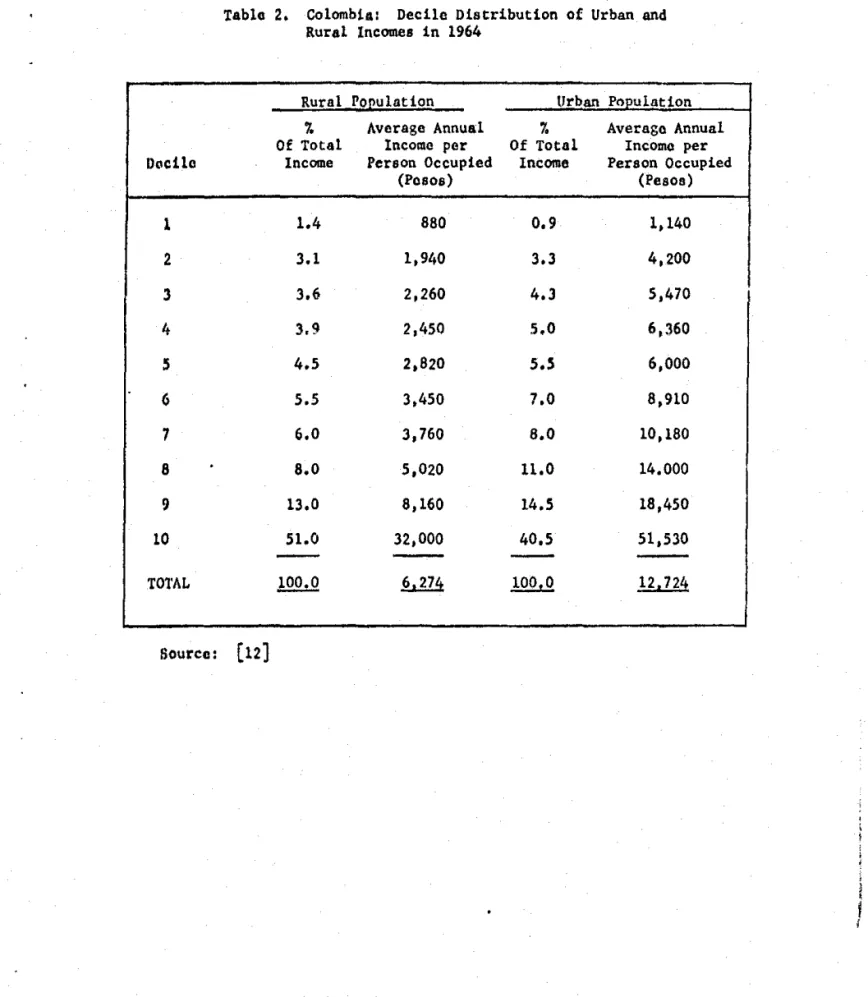
(8) J. The 8ituation in rural areas was approxhnntcd with tha holp of lnformation contained in Table l.. Using the minimum wage approach and setting. the minimum wage at 1,100 pesos per annum, lLO conclud.d that about on. sixth of those tabulated rece1vcd incomes below the minimu,n and was, therefore, underemployed.. Taking both sector. together and 4110wing for both. unemploymcnt and underemployment, ILO estimatad that in 1970 only 5 million man-years were used compared to .n estimated labor capa.lty of 6.5 mllllon man-years, which indicates an unemployment of about 23 poreent.. USAID. Mission to Colombia, <onsidering agricultura alone, found the rate of unemployment for 1968 to be mueh higher.. Aceording to it. c.lculationo 450. mil1ion work days wcrc required to produce the total output al the agrkultural sector tor thát. yOGr.. On the basis ef a 2S0~dG.y. yOllr,. it. W3G. e¡;t1". mated that 750 mill!on work daya were availablo which monnt that un- 8nd underemployment togethor amounted to 40 perc.nt of the agricultural labor ". force [14].. •. b). The extent of poverty and dualism becomes evid.nt in Urrutia ' •. recent otudy concerning the distribution of incomes oí rural and urban populations in 1964 [12]. 2.. Figures from thi. scudy are prcsentcd 1n rabIe. They reveal thac incomes in Colombia ar<, di.tributad very unevenly ru:d. that the s1tuation 18 worse in the rural sector, in which the upp.r ton percent of the population receive more than halí of the total <lorel 1n<""'" It. io also apparent that the absoluto level of rural incemo. lo only holf. the level af urban 1ncQmes.. Project1ng 1964 por capita rural income to 1970 (on tho 018is of the growth of value added in agriculture) an incomo uf ollly $175 per rural. • inhabitant i. obtained .s contrasted to aboue $300 per copita for tha. •. total population.. Poverty in rurnl arcas is cl •• r1y quite extensive •.
(9) 3a. Tabla 2.. ,. Urban Pnpulatlon Rural P02ulatlon Average Annual Averago Annual % % Income por Of Total Of Total Incomo per Income Person Occupled lncome Person Oecupied (Pesos) (Pesos). O.eUe. ,. ~. <. .. 1. 1.4. 880. 0.9. 1,140. 2. 3.1. 1,940. 3.3. 4,200. 3. 3.6. 2,260. 4.3. 5,470. 4. ).9. 2,450. 5.0. 6,360. 5. 4.5. 2,820. 5.5. 6,000. 6. 5.5. 3,450. 7.0. 8,910. 7. 6.0. 3,760. 8.0. 10,180. 8. 8.0. 5,020. U.O. 14.000. 9. 13.0. 8,160. 14.5. 18,450. 10. 51.0. ---. 32,000. 40.5. 51,530. !QQ.J!. hlli. 100.0. 12,724. T01'AL. Sourco:. , i. Colombia: Oeel1o Dlscributlon of Urban and Rural Ineomes ln 1964. [12].
(10) 4. e) 4. Rural poverty. an~. ehange in its extent has been the subjeot oí. detailed investigation by the Colcmbian Institute of Agrarian Reform. (INOORA) in 1970 [13].. In defining the coneept of poverty INCORA adopted. a minmum ineome of 14,7000 pesos per family as a poverty hcnehmark íor 1970.. It was ealculated that in 1962 (deflating 1970 incame to 1962 price. level) there were 802,000 families with ineomes belów the poverty benchOf this total, 85,000 families were landless, 633,000 owned les s. mark.. than 5 hoctares of land. and had incomes oí less than 80 pereent oí the. benehmark ineome, 34,000 were families with 5 to 10 hectares oí land with incomes less than 60 percent oí the benchmark, and 50,000 were tenant. and sharccropper families working plots of less than 15 hectares. In 1970 the total number of families below the poverty line mated tO have increased by nearly 17 percent to 935,000.. esti-. The number of. landless familios more than doubled and amounted to 190,000.. •. WRS. Familios. with less than 5 hect ares of land and earning les s than 80 percent of the benchmark income increased to 658,000, families with 5 to la hectares and ineomos les s than 60 pereent of the benehmark increased to 37,000 and o~ty. che number oí tenant farmero and sharecroppers with les s than 15. hectares oí land remained as befare at about 50,000. This indicates a rapidly worsening situation, particularly with reapect to che group of landless families.. There i8 strong reason to believe. that the distribution of rural incomes has tended toward greater inequality in spite of the rise in per capita value added which, for the agricultural sector. a8. a whole, increased by 150 to 175 percent during the 1930-70. periodo. • Size of the Employment Problem The seriousnes8 of the employment problem becomes clearer when the.
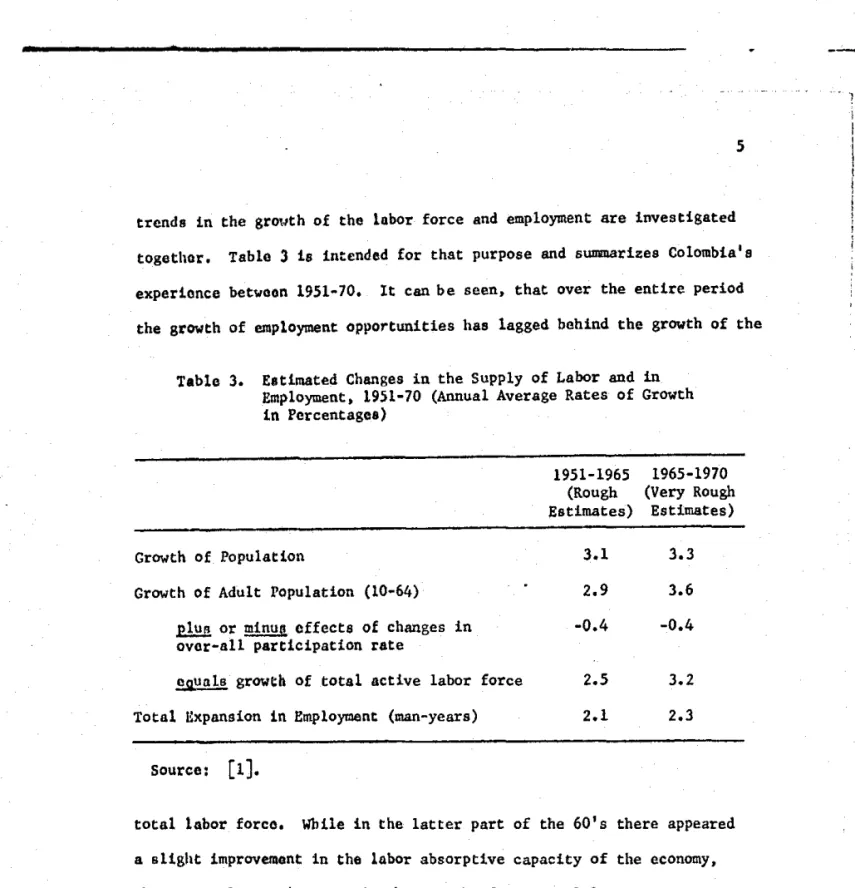
(11) ........ . -1. .5. trcnd. in the grm,th of the labor force and employment are investigated togethor.. Tablo 3 1s intended for thllt purpose and sUIIIII8r1zes Colombia'.. experionee betwoon 19.51-70.. lt can be seen, that over the entire period. the growth of employment opportunities has lagged behind the growth of the Table 3.. Eatimated Changes in the Supply of Labor and in Employment, 1951-70 (Annual Average Rates of Growth in Percentages) 1951-1965 1965-1970 (Very Rough (Rough Estimates) Estimates). Growth of Population. 3.1. 3.3. Growth of Adult Population (10-64). 2.9. 3.6. -0.4. -0.4. growth of total active labor force. 2• .5. 3.2. in Employment (man-years). 2.1. 2.3. plu. or minug offects of changes in ovor-all participation rote ~unlB. Total. ~xpansion. Source:. [lJ.. total labor forco.. While in the latter part of the 60's there appeared. a aUght improvemont in the labor absorptive eapacity of the eeonomy, thero vas alBO an increase in the growth of the total labor force.. Conse-. quently, the growth of output not only failed to reduce the existing backlog ol unemployment, it also failed to absorb significant and increasing aharca oí the incrementB to the labor force. l'ho Government of Colombia has initiated a vigorous family planning. •. program in order to case the problem ;f employment.. But even 1f present. attempta to control the population succeed it will be st least 15 years before there i •• marked offect on the growth of the labor force.. Hence. i ~--. ---.
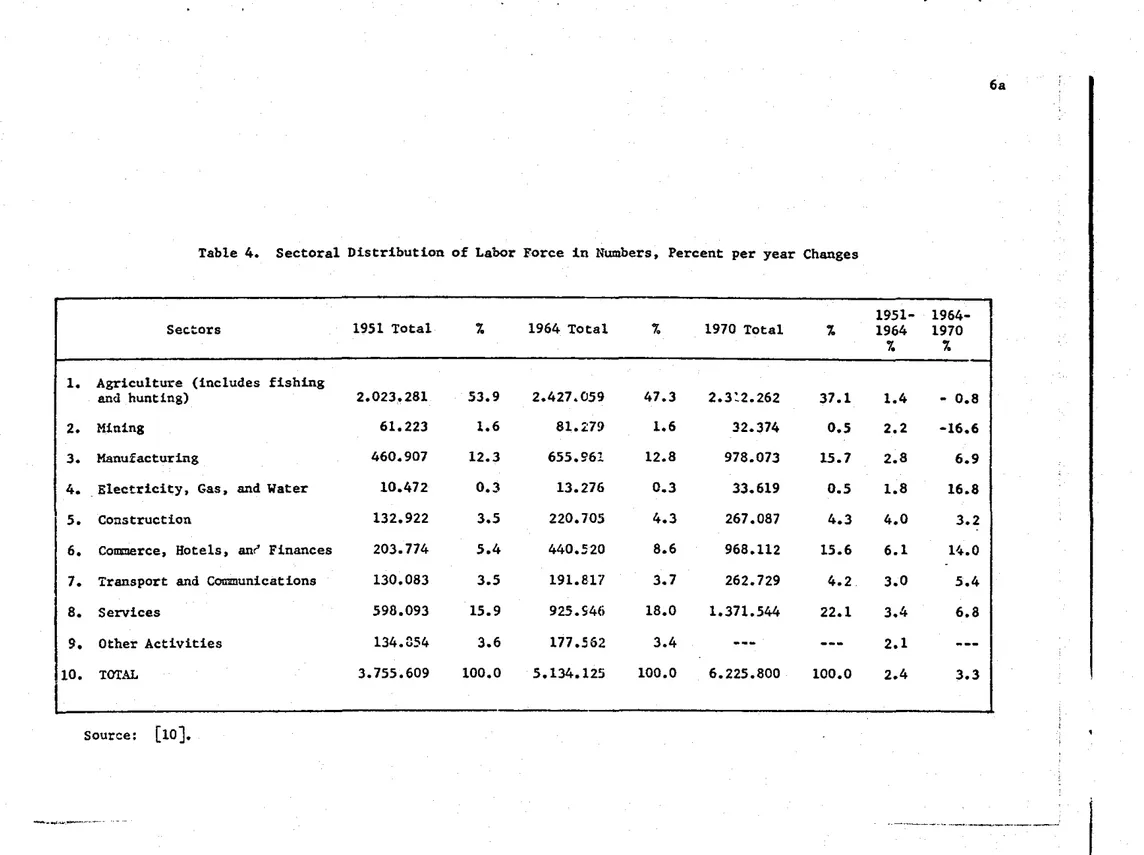
(12) 6. lt i8 ro •• onable, u.:ng 1970. •. 1985. for. .1. a base, to project present trends to. 4 numericAl avaluatlon of tbe employment problem at tbat time.. AI.umlng that omployment continue. to grow at 2.3 pereent per year. ,. ,. snd applylng thie fote to tho 5 million joba which ware .stimated to exist in 1370, the numbor of jobs in 1985 wHl total 7 mill1on.. Tbe growth of. the labor force wh1ch has bean aceeleratlng, ia expeeted to proceed at 3.5 per y•• r durin¡¡ the 70'... At thia rato Colombia'. labor force of 6.5. million in 1970 w111 have incroued to neorly 11 million by 1985.. On. tl,is bu1s, thero wUl b. 4 ml1Uon persona unemployud in 1985, or more than ona third of tila 1985 labr. force.. Changing Saetoro! Dlltribution ol Labor Forco ond Rural-Urban Migration. Saet.oral d1str1bution of Colombia's labor force and change. that took place botween 1951 and 1970 are 1l1ustratad in Table 4.. This inform&tion. yields important and intere.ting insights not only in the changing compositian of tha total labor forco, but also ln the direction of labor mobility and •• etoral protorences.. lt also can ba used to ealculat. sectoral. growth of unomploymant, glven aoctoral growth oi labor absorptive eapadty. A notable chafAetoristlc i. che present importaneo of agriculture desplto the rapid fAte at whieh agricultura'. share in total labor force has beon doeL1ning.. Table 4 show. that in a period of nearly 20 years. prlor to 1970, during which tha total labor force was growing between 2.4 and 3.3 pereant,. a~rlculture 's. pereent to about 37 pareent.. share in tho total declinod from ncarly 54 Novarthele •• , agricultura still continues. to accornmodate mora oE the total labor forco than any other sector.. lt. • 10 avid<lltt that agriculture 's do.lining waight in total labor force has. •. boc . cau.od by a rApidly dimlnichlng growth rate of agrieultural labor force, whieh. ShOW8 A. decline. fr~,. 1.4 pero.nt par year in 1951-64 to.
(13) -. .'. •. :. -. ,>. j. ". •. 6a. Table 4.. Sectoral Distribution of Labor Force in Numbers, Percent per year Changes. -.-.--_._... _~._~--.---.
(14) 7. slightly a negative -0.8 percent per year in 1964-70.. Ihe latter means. that the agricultural labor force may have stabilized. or is beginning to decline in absolute numbers, a fact which may mark an important tuming point, provided the trend persists.. lt can be ca1culated that if this. trend continues through 1985, agricultural labor force wil1 decline to slightly over 2 million, while the urban labor force will double from 4 million in 1970'<0 8 million in 1985. lt 18 clear, however, ths.t while agriculture has been, to some ex-. tent, relieved of the pressure generated by rapid population growth, the problem of employment has merely shifted to sectors outside agriculture. Table 4 shows, for exarople, that the growth of labor force in thc three mast important non»et"i cul tu!."al sect('!'s, manufactur!!'!g, commcrce plus fi ... nances, and services, have doubled or more than doubled ta 6.9, 14.0, and. 6.8 percent per year, respectively, between 1951-64 and 1964-70. employment in these seetora has grown at a much slower rate,. e.e_. Since at 2.0. percent per year in manufacturing between 1965-70, unemployment here, and in nonagriculture in general, has been tncreasing at a fas ter rate than. in agriculture. Underlying the changes in the cemposition of Colombia's labor force is a complex rura1-urban migration pattem.. Colombia has approximate1y. one hundred towns with over 100,000 inhabitants, some thirty of which have more than 300,000 inhabitants.. Ihe pattem of migration indicates. that in mast cases rural migrants move ta villages and amall towns, while the residents of these move on to larger towns.. •. This meana that smaller. towns, which are very fmportant in the strategy of rural development, are. loosing much of their more dynamic entrepreneurs while gaining migrants with few skills.. Ihe flow of migrants ha. been increasingly unidirectional.
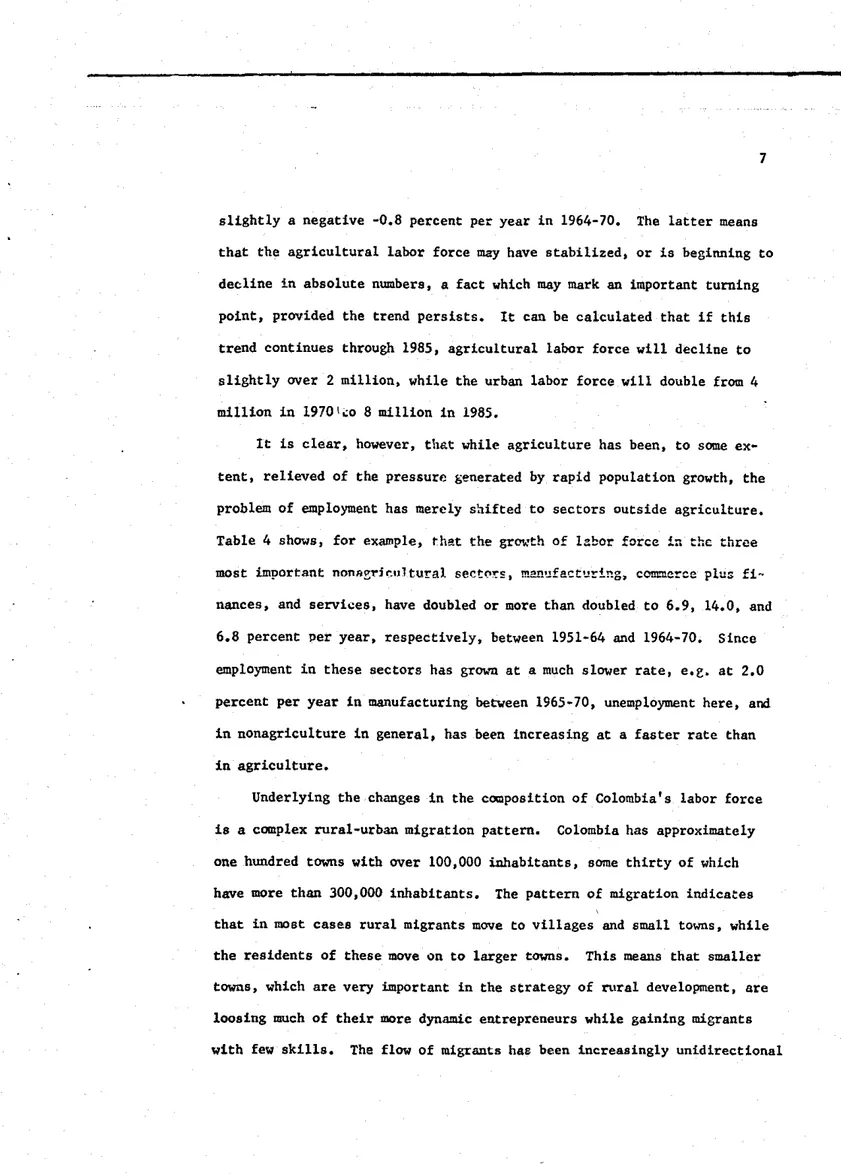
(15) 8. and Ilrow1nll ln nUlllbera.. In 1938 only 31 p~re •.nt of total popul.tlon was. ln urban area. vhlle in 1364 over 52 poreent redded ln dUo. vit!> populatlon aver 100,000.. By 1985 nearly 73 pereent oí tho ostlmated popula-. tion of 33 mil110n ia expected to havo 1eft the rural lector •. •. In recant. yeara the large.tl four citie. in Colombla hlve been growing by n.8rly 7 pereont a y04r, approxlmately tvice. .8. fast as the growth of total popula-. t1on.. Sector.l Output Performance. Un- and undoremployment in Colombia continue to porsi.t ln faco of a relatively good aggregato output performance. the 50'0 the grovth of the GN?, in real cent por year unt11 about the m1d 60's. 811y 1ncrcüsed to about 7.0. pc¡~eüt. te~,. Sinee the beginning of has been elose to 5 per-. From then on the rate has sradu-. par ycar in 1970.. Ihe oueput of. agriculture, vhole ahare in total output declined from 40 pereent in 1950 to about 31 pereent in flucCuating rate:. 196~.. h.9 grown at a aomewhat moro uneven snd. at about 2.8 pereent per year in the periodo 1950-55. and 1960-67, and ae about 4.4 percent per year in 1955-60.. Reeont aati-. matoa for the 84rly 70'a again place agricultural output gravth at a highar rate of 5.4 percent por year [9].. lt i. importARt to noto that. agricultural output generateo 75 pereent of foreign exchange earntnsa and provides 50 porcent of input. for domestic induatry. Nonagrieultural output during the sama perlod ha. ahovn a. f~sccr. growth. averaging at 5.7 perc.nt per year "ah some fluctuationa.. The. grovch of manur.ctur1ng hao proceeded at a relat1vely atable rato of aboue 7.0 pereent pu year but v1thouc too l1IUeh dynamiSlO, ahov1ng only a slighe increaa. to about 8.0 pereent per year at the beginning of the. • •. 70'.. !he share ol manufacturing in total output h&8 nov increased percent.. tO. 18.
(16) 9. FAcrORS CONTRIllUTING 1'0 UNDEIlEIIPLO'tl1ENT AND UNEKPLOYKENT. For econamic development to take place at lensl two condition. must be sati.fled:. a) increa.ed availability of goods and service., and b). gr.ator cquallty ln consumption, education, nealth and opportunities.. To. attaLn the former there must be sufficlent growth ol output, to attain the. l3tt~r,. of the. ~or. there i. n definite need for impraved ineomes Cor the mas.e. through the generation of productivo employment.. It "as. shown in the preceding sectian that "hile there has been a relatively satisfactory growth of output aceompanicd by structural change toward. greater industridlization, underutilization oC labor and the distribution of incomes have actually worsened.. It i8,. t~erefore,. rcasonable to con-. elude thnt Colombia's underdevelopment rests on the failuro of the economy ca generate suificient cmpioyment.. Th. basie fectoro re.pon,lule for this failure in the Colombinn setting aro not too diff!cult to f1nd and erc diE;cusscd next.. However, it. must be real1ud that the.e Letor. are difficult to isolate fuUy because. of their com.plolt and intimate intcrdependence. Unequal Distribution oí tho tNnership of I.and Thore is little doubt that the nature of land oW:lership constitutes one of the principal obstacle. to economie development and employment generntion not only in rurnl areas, but a160 outside agriculture.. Land. ownership in Colombia like the distribution oí incames, i. highly concentratad.. Two recent studies attast to this.. a). According to ILO finding.. for 1960 quoted ln [1], nearly 45 percent of cultivable and pasture land vas in the bando of on1y 1.2 percent of the population with average hold-. •. ,. ings around 700 hectares.. In contrast, 65 pereent of the population owned.
(17) 9.. ",. Table S.. 19S0. 19S5. 1960. 1967. 40.0. 35.5. 34.6. 30.9. 3.8. 3.6. 4,1. 3.5. Hanufacturing. 13.9. lS.l. 16.7. 17.6. Comtruction. 2.8. 3;9. 3.2. 3.7. 12.8. 13.6. 12.7. 12.9. Transportation. 5.3. 6.9. 6.1. 6.3. Services. 8.0. 7.5. 7.6. 7.3. Other. 13.4. 13.9. 15.0. 17.8. Total. 100.0. 100.0. 100.0. 100.0. Sector Agriculture Miner.la. Conmerce. ... Sourc:e:. •. ".. Soetoral Di8tribution of GNP (Pareentageo). [7]..
(18) ,. 10 5.5 pereant of land with average holding aize of le •• than 2 hectares and with 25 percent of them awning holdings of 0.5 heetares.. b). More. reeent figurea, which take into aeeount the results of the agrarian reform of the past deeade, are quoted in [9) by the Department of National These cover the size diatribution of naarly 1.4 million farma. Planning.. with a total area of 23.5 million hectares. ferent.. The picture is not mueh dif-. About 70 pereent of all farma have an are a of les s thao 5 hec-. tares, and oeeupy only 5.6 pereent of total farm area. pereent of all farma are smaller thao 1 heetare.. Furthermore, 32.5. On the other end of. the scale, holdings of more than 50 hectares represent only 5.9 pel'cent of the total number of farms, but oceupy 72.3 pereent of total farm area. Farma of more thao 300 hectares (0.8 pereent of total farma) eOver 40.7 percent of thc: total .ith1n which holdings oí. IilOt't!. l.han 1 J 000 hcccarcs. (0.2 pereent of total farms) control 22 percent of total arca.. ... These findingo refleet the eo-existenee of a modern, high. ineo~e. export oriented subsector, and a low income or subsistence level traditional. suboector supplying the domestic market, which to some extent is still nonmonetized.. Sinee the largest part of the agricultural population ia con-. fined to a smal1 fraetion of total land, inerease. in rural population can only lead to two alternatives:. further fragmentation of land, thus depress-. ing 1ncomes and widening the extent of poverty, or outmigration to urban areas in search for new employment opportunities.. Employment opportunities on large farma in the modern subscctor are quite limited because of capital intensive productlon techniques. mechanization in Colombia appears quite extensive.. matlon, quoted in [S],. Farm. Accordlng to FAO. infor~. there 18 one tractor for roughly every 150 hectares. • of lsnd, clase ta the level found in labor-scarce, land-rich economies of t. Australia and the USSR, where agricultural production is an extensive.
(19) 11. operation. The pattern of mechanitation ia clearly linked to the dlstributlon of farm 81zes:. unev~n. farma bigger than 50 hectares have 66 per-. cent of total tractoro. !he unequal distribution of land thus createo a power structure which highly discriminatcs against the poor in the traditional subsector by deprivlng them of adcquate incomes and opportunlties to fully satisfy their basie needs.. The large land owner in the modern subsector is ax-. cluded from sny adverse effects of poverty since the product of his land is sold in external markets and the gaino from trade are at his di.polal at favorable terma as will be indicated below.. Poverty ln the traditional. subsector may even be beneficial to the land owner in the modern sub •• etor by providing 18ree. ~upplie9. in. ch~ap. labor.. Existing. 1n:tit~tcs. which provldp. P.m91oymp.nt,t t"d\lcl"tfon~ justi~et hl)'l!!!!!.g, heelth .and cther. public services, are built along the lines of dualism and raflect th. hlghly unequal dlstributlon of land.. They, thorcfore, do not adequatcly. respond to the needs of the poor who own little or no land at all. Ind:¡striaUzatlon by Import Substitutlon and Dlstorted Factor Price. Another principal obstade to ful! employment 10 the exlsting dlstortions in the relativo prlccs of capltal and labor.. The prlces of. capltal, credit and ferelgn cxchange have been artificlally lowercd below their equilibrium and, therefore, di.torted in relation to labor. In aódition,. imp~rted. exempt from túriffs.. farm and other machinery are also fully or partially This explains "hy in a labor surplus economy such. as Colombia, labor saving is made econooically rational. Existing distortion of factor priees in Colombia is a direct conso-. •. quence of industrializatlon by import substitution pollci.s.. Initiated. after the Great Depression in the 30'1 import oubstitution became e.
(20) 12. deliberate policy for aconomic development after World War 11.. 5uch. poliey wa8 prescribed to achieve a) a lower dependencc on imports and a higher sclf-aufficiency in consumer goods. b) a more healthy indus-. trial basi. with higher employment opportunities out.idc agriculture and c) a r1.1ng level of manufactured exports.. Ihese aims, lt ls con-. ceded in (9), have not becn approximated, and the unsatisfactory performalice of industry 1s presently of much concern. While Colombia now produce. a large quantity of consumer goods, s.t1sfying most of its domestic demand, it 1s. ~lso. necessary to import. for the1r production much larger and increasing quantities of l,ntermed1ate and capital good... In 1956, for example, 12 parcent of imports. were compased of con.umer goods, 35 percent of intermediate Bood.. 1964,. ~hiJe. imrorts O! consuMer gocds ¿eclincd te 6. intermediate goods increased to 46 percent.. •. porc~nt.. In. importa úf. Ihe net cffect ha. been. that import requirements to sustain manufacturing have actually increased 1n relativo snd absolute terma making manufacturing output and omploymene much more dependent'on foreign sources of supply than be{oro. Colombia'. manufacturing industries have be en buUt with tho help of art1fic1ally cheap capital, crcdit and foreign exchange, built heh1nd protect1ve tadff. wh1ch 1n same instance. even today 1nvolve dueles as h1gh a. 200 parcene in value terma [9].. Ihere have aloo been quftntita-. Uva import restricUon. in the forlO of quotas and licenses. tion of impore substltution has be en indiscriminate.. Tito promo-. Ihat l., thcre havo. not been serious attempt8 ta concentra te on industrial seetora which m1gnt have hacl a potential comparative advantage.. •. Aa. 4. result. most in-. dustrial enterprises in Colombia are capital intenslve. relativoly 1neff!-. cient and inward looking.. Moreovcr, the government baing anxioul to se-. curo benefit. of domestlc competition (since protectionlst policios.
(21) 13. suspend foreign competition) cneouraged too many firma to entero. The. result h•• been tha emergenco of numcroua firms with too amall an output capacity faeing a very limited. mark~t. so that frequently even the omall. output eapaeity eould not be utllized fully. The extent of capital mia.llocation and vaste i. revealed in a study by tho Dopartment of National Planniug whieh diseloses that it is poa8ible in me.t indu9trios to. d~plicate. present output without additional inve8t-. ment in fixed capital. [9]. In other words, about 50 percent of the capi-. tal in manufaeturing industrio. is in faet idle.. This greatly explains. why tho growth of manufacturing output has resulted in a disappointingly lov rato of employment creation, and why the service sector in aecomodating tho majority of migrants from rural areas has fulfllled essentially tbe aama function as the low incorne subsistence agricultural subscctor.. The contribution of tho manufaeturing industries to exports haa. •. been oqually dis.ppointing.. In 1966 industrial exporta amounted to only. about 13.6 percent of total exports. about 17.4 pereent. I\a. In 1969 this figure inereased to. a result of speeial export promotion measures.. rhese. figurea, however. as indicatcd in [9], seriously overcstlmate the actual. ehare oí manufacturad exporto in the total, beeause the import eontent of manufacturing i. much higher thao that of agriculture. Laek of dynamism in !Ilanufacturing exports and employment ia due mo.tly to the prevalence of high tariffs and exeessive proteetion from international competition.. Of particular relevance lB the concept of. effectivo tariff (the pereentoge by whieh the value. add~d. in domes tic in-. dustry can excced what this would be in the absence of protection) as COn-. •. traated to the eoneapt of nominal tariff (the pereentage by which prie •• of proteetod good. exceed their world priees).. In most caaes the.
(22) 14. effectivo teriff in Colombia is very higb, much higber thnn the teriff for intermediate or capital good... Under such circumstancos incentive.. to increaoe production efficiency are eliminatod and it i. difficult to bring tho cost of production down to international level... ". ...,'. ';. ~ ~:' /~{,.~..~;. In fact, it. is more profitsble to produce at higb COsts for the protccted domes tic market than to specialize and .eek international outlet... Hence, import. replacement industry in Colombia has not been able to gain competitivo advantage in export markets. Populat1on Growth The characteriatics of demographic trends have been high fertility rates, raJid declino in infant mortality, high. a~d inc~ea9ing ro~ul~tion. growth ratea, and a growing proportion of young. growth ratas are reflected in the !ollowing:. ?~np]e.. Ac~elerating. it took 33 years, between. 1905 and 1938, for tho population to double the !irst timo in this century, but only 26 yeara, second time.. betwe~n. 1938 and 1964, for this to happen tho. It is estimated that the population will double again by. 1986, in only 22 yeare.. In the same time period, i.e., since the begin-. ning of tho 20th contury, world population has been doubling, on the average, ovory 42 yoara, that of Latin America, every 26 years. Whil. Colombia i. relatively rich in land and. ~atural. resources and. there is even underutilized and idlo capital resources, rapidly doubling population 1. elearly. Q. aerloua factor responsible for continued under-. developmcnt, the extonsive poverty and the difficulties of generating productive employment for the incrementa to the labor force.. Although the. goverrunent 1. channo11ng additional resources in administrat1on. educatiol\.. houBing and other aervlce. to break the eirc le of low productivity and ".
(23) 15. low incomes, rllpidly r181ng numbers ta IIhom thes" .ervices are appUed make lt very dlfficult to lncroase tbe!.r quality and afficiency.. As a. result, dualism cuntinues and the numbar of the poor increases. Ctber Obstacles rhere are aloo a numbar of other raauono which oxplain the lack of productive employmcnt opportunitias in Colombia.. Thoso, howevar, seem to. exist mostly as a consaquenco of the first tilO major institutional obstacles and becausc of rapid population growth, and are, therefore, discussed in less detaLl. a). Internal demando. It was emphashed that most1y as a consequence. of the unequal distribution of land, incomos in the traditional subsec-. .~ . ·':1. tor, espectally in ruraL areas, are very iow and stagnot1ng.. Undcr such. circumstances efícctivé Jemand, 1.e., demnnd supported by the purchasing. ~. powcr is also very lo", and stllgnating.. Horoover, g1ven the relatively. 1. ". fr.' i. :1. high incerne elasticity of dcmand for foad at low incoma levala, increases in incernes a"e spent mestly en food.. Henco, lh. growth of output and cm-. ~loyment in manufncturing ts eertously limitcd. by. lack of adequata nnd. vigorously increaotng internal demand, tha principal incentive of produc-. J ¡. :. .j. j. ,. ;j ~. <. •. tlon.. Whlle the initial proces8 of import aubEtitution brought about quite substantial indu6tdal growth, ie appearo ta have becn a once-for-all expans10n with aulo subsequent rcinvestlllQnt.. This is not only because of. insufficient and sl:':lignating 1nte.rnal demllnd, bl1t aloo bec4u8C the proceas. of impert substitution 1s nat thought foaoibla te be carried further ta the domestic repJ.acoment of 1ntcrmed1atc input., and Hnally, because 1mport-replacement indu.try can not yat succ •• sfully compota in expart markets..
(24) 16. b). High yie1ding varictic8 and rural institution8.. Yie1ds of. major food eropo, a1though rising quite rapidly in recent years, are sti1l relatively low and 1agging behind those oE most other countries. According to FAO data for 1970 [15], Colombia's eorn yicldo amounted to. 12.5 thousand kilograms per hectare (kg/ha) aa contrastad to 45.0 thousand kg/ha in the USA, 35.9 thousand kg/ha in Chile, and 32.2 thousand kg/ha in Japan.. The wheat yieldo in Colombia registered 9.4 thousand ks/ha,. behind Mexieo with 28.4 thousnnd kg/ha, Japan with 20.7 thousand kg/ha and Chile with 16.9 thousand kg/ha. Only in terms of paddy rice, Colombia'. yields of 29.7 thousand kg/ha rnnked somewhat more fnvorably as compared to 28.6 thousand kg/ha in Mexieo, 31.3 thousnnd kg/ha in Chile .ud 56.4 thotlsand kg!ha in JerBn. Relative1y low yields "efloct the limitcd spread of high yiolding varieties, with the er.ception of paddy rice for which noarly 85 pcreent of total area was found under inlprvved varict les.. Also the use oí ferti-. lizers, pestieides and insecticides is still quite 10101.. Thus, in 1968. only 22 pereent of total area under the 12 major crops reeeived fertilizers 8nd only about 1.3 percent oí a11 fams uscd inflocticides and pesticides [9]. The last decade, however, has seen a wider adoption oE high yielding varietie. and other modern inputs as a result of vigorous agricultural research and dissemination of knowledge, originating mostly in the Ggricultural researeh station at Palmlrn, operated by the Colombian Institute of Agricultura (ICA) , and in the Intornational Center of Tropical Agriculture. .. (CIAT) in the Cauca valley.. However, cxtention efforts to acquaint íarmers. ,. with new method. and seeds resulting trom re •• arch still do not reach too fsr beyond the more progressive, botter educated and more well-to-do.
(25) 17. farmers.. HOst of the small farmers are ignorant of the new technology. and those who havo heard aoout it generally are distrustful of it. Some 60 extension units, a numbar far too small for the needs of the country, exist over the country, each usually staffed with an agronomist, an animal seientist or vetorinarian and a heme economist, plus five or slx agricultural technicians who live in the 1mmediate area.. The spread. of extension work to more satisfactory levels is hompered by financial and skill constraints.. In Colombia as in mast developing countries, the. great majority oí extenoion workers and researchers do not originate from rural areas, but come frem towns or cicies and are professionally qualified on che ba.lo of aeademic and thooretical edue\le1.on in or university... ~ o"ll~ge ~nd/. Henee: they lack first hand experlence. of actual farm. operations and of farm peoplo, which lends to diíflculties in cornmunication, to suspicion and sometimes hostility on the part of poorly educated farmers.. Farm credit. which is needed to adopt che new technology i. available only in very limited omounts and. O~. a selective basis.. To be eligible for. a loan from the agricultural credit bank a farmer must presant a farm plan worked out by an ICA licensod agronomist or livestock specialist, for whose services be must pay afee. hia loan and recelvea the. balanc~. Tbe farmer then is advancod part of only after an inspection in mid-season. shows that he 18 following the plan.. Smaller fa""",," who cannot afford. the services of a professional planncr may qualify for the rcmittance of the fee, but althaugh the intent oi the credit policy is to help them,. • •. the prevalent power structuro of dualism 16 such that farm crod1t goes. mostly to the biggor farmero.. It. h~.. been estimated that roughly only. about one-third oí amall farmera with farms of 20 hectares or les. ¡. 1.
(26) 18. received institutional credit ln 1970. When the dcfinition of tha small farmer is set at a lower limit, che coverage of institucional credit is mueh smaller whleh indieates thac chere is a large and urgent noed of improving credit avallabillty to che small farmer. e). Education and skill levela.. HOst of the peop1a ln the tradi-. tional subsector are illiterate, only ". few of tbem havlng had as much as two or three years of sehoollng.. The sltuatiPD is o.pecially aerious. ln rural areas as refleeted in the follow1ng figures for 1970.. Out oí. every 100 students attending primary schaola 64 were in the urban areas and 36 in the rural areas. tially enrolled. cCQplete~. But in. rural .ere:::: cnly 10. Of urban children 48 percont of those in1the thlrd grade, snd 38 percant the fifth grade. pcre~Mt. were ¿¡bIe tú obtaiu three years of. primary education and only 3 percent completed th.e fifth grade [9).. Pri-. mary education 1. suffarlng from a sho.tage of funds, Bchool., and instructora.. •. The very low level of basic educatlon is a seriouo impedimcnt to. eeonomla progre.s.. Laek of knowledge strengthens the aeceptance of the. status quo and weakens the prospects of change in responjo to economic stimulae.. Investment ln human capital has been a major lource of growth. in advanced eountries, but ln Colombia the small amount of investment in basic education has done little to extend the capac1ty ol ehe people to meet the challenge of development.. Equally •• rioua 18 the deficiency in. secondary education, esp.eially in technical skills.. Somo of the moRt. critical manpower shortages are far managers. administrators, scient1sts, engineers, agronomists, economista, llccountants. and techn1cal persan-. •. nel •. Of partlcular handicap is tha low level oE knowledgo and skill. in the sector of agriculture.. In order to moderni •• and to Accept new.
(27) r. I. 1'9. equipment, seed.,. 11~ecticides. etc., the quality of labor need. to be. improved first as an input in its own right. As was pointed out earlier, land is not a limiting factor of production per se, it can be made available on a more equal oasis, but agricultural transformation may not succeed without higher levels of knowledge and ski lIs. Finally, the success of population control palicy clearly requires new knowledge of birth control and a change of traditional beliefs Qnd social institutions that have sustained fertility at a high level.. Evi-. dence in a number of countries (e.g., India, Korea) where regional planning projects have beeo quite successful, tends to indicate that literate and more educated populations are more responsive to population control policies. d). lnfl~tion.. Import substituticn policies in Colombia have been. accompanied by relatively strong inflationary pressures.. lt seems to be. quite impossible to ascertain quantitatively to what extent inflation as such has obstructed the growth of output and employment. pacts are somewhat easier to describe.. QUalitative im-. Since Colombia has displayed a. strong propensity to maintain fixed exchange rates, inflation has introduced a progressive tendency toward exchange rate oveNalu"Uon, balance of payments difficulties and, hence, has been a cause of increasing protectionism and capital intensive bias in production.. All th!s, as ex-. plained earlier, has helped to divert resources away from export industries toward high cos. import substituting industries and has resulted in the lo.s oí economic efficiency.. • •. Distortions caused by increasing price.. appear to be quite influential in farm mechanization, for example.. lt. has been estimated that as a reeult of i.nflation farmers purchasing farm machinery, mostly tractors, have been paying back only about 85 to 90.
(28) 20. percent of the initial loan (8].. •. EMPLOYMENT PLANNING ANO SPECIFIC E2!PLOYMENT CENERATL"G STRATECIES. Development planning in Colombia is of recent origino. ,. lt i. only. since the constitutional reform of 1968 that economic planning ha. as.umod broader and more comprehensive perspectives, has acquired authority and has been based on a more realistic assessment of the existing aituatlon. Early development plano emphasized high GNP growth rates as.umlng that high rates of growth would lead to full employment and nlOre equal distri ution of income.. By the end of the 60's it was abundantly clear. that in the Colombian setting of dualism and unequal ownership of land, there does not exist a complementary relationship of any consCquencc be· tween GNP growth and employment and that, therefore, major structural changes must be planned and brought about with explicit employmcnt and income redistribution objectives in mind. The case of Colombia has received much attention. Several strategies for action have been suggested and are described below. ILO Full Employment Strategy This strategy, described in [1 J, is essentinlly based on the realizaHon that trends in the rural-urban migration will continuo, that the urban component of the population will increase and that, thercíore, major empbasis on structural change must be in nonagrlculture.. The 8trategy. oets 1985 as a target year by which 95 pereent of the total labor force becomes fully employed.. •. The task involves the creation of 5 million now. jobs in a time span of 15 years. required to absorb 85 percent.. Of this the nonagricultural sector i •.
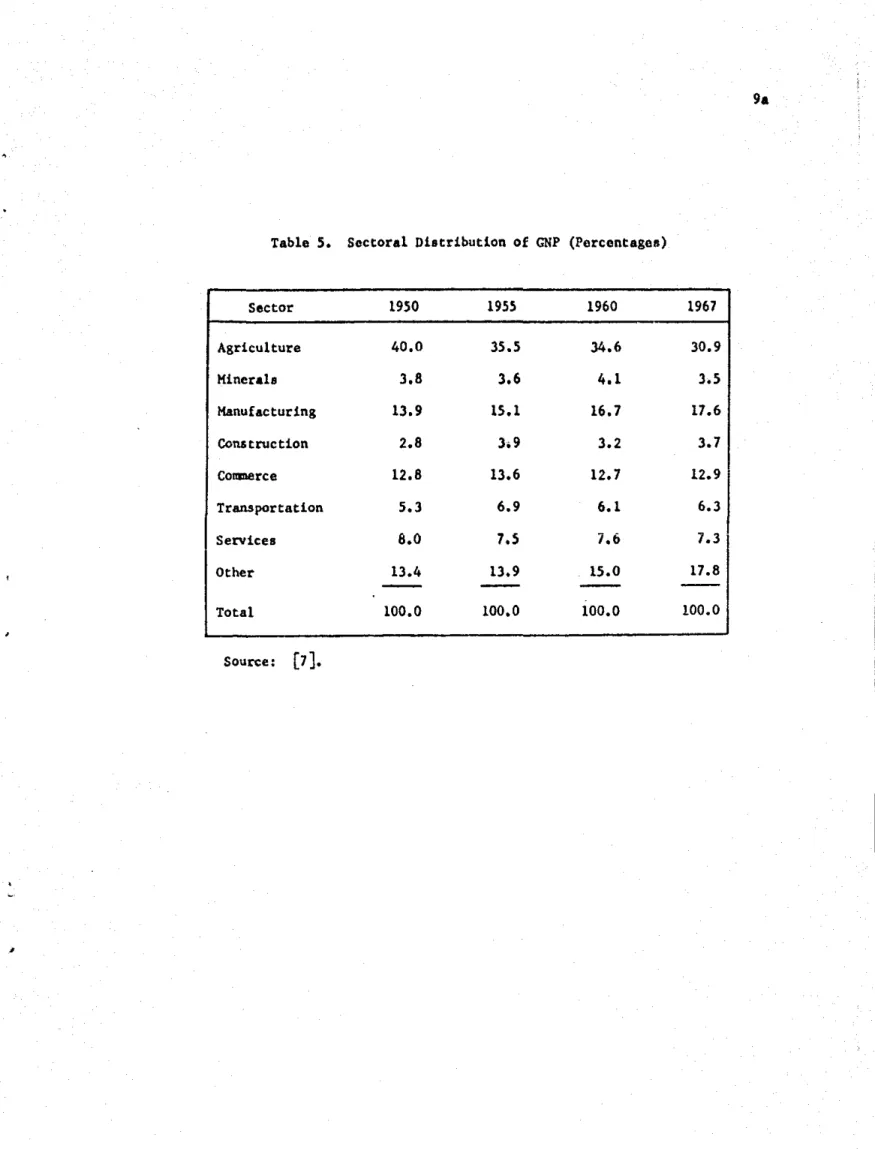
(29) 21. The 8trategy 1. that of aelectlve lnduatrlall.atlon and more modern .grl~ulture,. and is basod on planned chanse. in th. labor absorptlve capa-. citiea of varioua aectorl, changes whlch have to be enforced to attain. •. the deaired objoctive of full employment.. To lllustrate the detalla the. nonagricultural aector i. broken down in three subsector.: and gamma.. alpha, beta,. Th. alpha subsector comprlse. mining, manufecturlng, publlc. utilities, and tran_port and i. defined .a relatively capital and skill intensive.. The beta BubBector which consllts of conatructlon, handicraft,. commerce, and personal servlces la relatlvely labor lntensive, and the gamma subsector, embracing banking and other servlc.a, is skill lntensive. Th. baBie aapectB uf the atrategy are fllustrated In Table 6.. Th.. rate of growth of labor productivity in agricultura 1_ required to incre.Be, implying a ahift frem tradlt10nal low-ylelding prod"ction to more eff!cient modern mothad. making wide use of high yielding plant varieties, the appllcation of fertilizer_, lnsecticides, irrigation, and some mechanization.. The nonagrlcultural Bector, in contrast, 18 required te .hift to. much more labor intensive praduction in order to absorb the bulk of the unemployed.. Thia i. indicated by fallins productivity srowth ratce in. all of the threo composite subsector •• The implemontation of the ILO Strategy clearly involves drastic changes and a major dislocatlon ()f vestad interest. both In agriculture and nonagricul.ure.. The growth of agricultural output 1. planne¿ to in-. crease from 3.4 pereent per yesr in 1964-70 to 5.4 percent per year in 1970-85.. The underlying growth in agricultural productivity is not pos-. sible under exi.ting land fragmentation be.au.e the greatest majority of farma are so Bmall that tlley connot hope to adopt modern inputB and thUB improve the1r 1ncomes and purchasing power.. •. The latter are needcd to.
(30) 21a. Tablo 6.. •. Colombia: Growth Ratos of Emp1oyment, Labor Productivity and Value Added by Sector: Estlmates far 1964-70 and Hypothetical Strategy for 1970-85 (annual cumulative growth rates in perceotag •• ) •. Employment. Labor Productivity. V.lue Added. 19641970. 19701985. 19641970. 19701985. 19641970. 19701985. 1.4. 1.8. 2.0. 3.5. 3.4. 5.4. 3.2. 7.0. 2;5. 1.8. 5.7. 8.9. Capital-intensivo and 21 Skill-intensive -. 2.5. 6.9 I. 4.0. 2.9. 6.6. 9.1. Not capital-intensive nor Sk} 11intensive 1-. 3.6. 6.9. 1.4. 1.5. 5.1. 8.5. 41. 3.3. 8.3. 1.8. 1.0. 5.1. 9.3. 2.3. 4.8. 2.9. 3.2. 5.2. 8.1. Sector:. 11. Agriculture -. I. Nonagriculture of which:. Skil1-inten81ve All Scctors. I. l/Agriculture, livestock, fore.try, and fi.hing. l/Minins, modern manufacturing, public serv,ces, and transport.tion. 1/Conatruction, artiaanal production, trad., and personal servic •••. ~/Financial and government servicea. Source:. [1]..
(31) 22. enlarge the domest!c market which in turn la called for •• part of the program oí industrial growth and overall development.. !LO. strategy,. therefore, appears feasible only under a major land reform which gives to eh. majority of rural people the opportunity to participate in domas tic and export market. from famlly .iza farma or. c~al. enterprises.. Since tha bulk of productive employment i. to be generated !n nonagricultura a major effort i. required to speed up its structural change and increase the growth of output to nearly 9.0 percent per year, by_ more than 50 percent in comparlson to 1964-70.. In order to achieve the. employment objective the productivity growth of labor must decline to. 1.8 percent per year from 2.5 percent per year in the last pare of the 60's.. For this to take place a basic change in the production techniques. üed in thc outrut. m!~. i3 roquired.. Such changa. ~st. include tha. 61~ina-. tion of the existing capital intensive bias, a readjustment of factor prices to reflect the abundancy oí labor, a downward adjustment in the exchange rate, a chango in the protective tariff system, the loss of speeial preferencea for domes tic and foreign firms importlng capital goods, the redirection of industrial credit to labor-intensive, omallseale industries, including handicraft, catering to the demand of the rural populatlon, etc. The task of this d1mension will impose a ehsllenge of unpreeedented magnltude on Colombia's administrative and managerial capacity to identify measures and techniques whieh would fit development need. best, then to change the prosent structure uccordingly.. The challenge vill also exert. a heavy pr.osure on the country's educational system whlch vill be requlred to sharply increase the qual1ty and quantity of .k -'.led manpower to ensure. •. a 8ucceaaful implementation of the full-employment strategy •.
(32) 23 Conaiateney Check Within an Input-Output Framework The central idea of ecanomio planning i. to describe the economy in sueh a way that the effeeta of sn initial change ln sny part (sector) of it can be traced to all other part. (sectoro) qualltstively and quantitatively.. This i. po.sible in an lnput-output framowork, which ensures. internal consisteney of any projeetions within such framework.. Far ex-. ample, given tho inter-industry matrix of coefficients one can ealculate if an expeeted incr .. se in the final demand ean be sustained wlth present technology. 1.e., presant input structure, including labor.. An attempt to check tho !easlbl1ity withln an input-output framework of full employment in Colombia by 1985 Itas been recently made (for details see [4]).. Thero are ("o majar conelu.iono which result from the study.. F1tst. an agreernent with othcr findings that 1f the present productive and. technological structure ls not bssically altered, futura prospocts are for a rapidly worsening employment and inco",e distrlblltion situation, .... inly becauoe of the balaneo of payments constra1nt whieh .. ill Plcke it. •. iD:possl.ble for the GNP ta incrense ot 8 pereent per year as postul.1ted by the ILO.. Second, a drasUc struetura1 cllIlDge, .ueh 80 proposed in tbe. U.o strategy (described above) may not be fcosible on the g"ounds OL con-. dsteney.. The results of the input-output otudy are compared to those of. th. ILO proposed strategy in Table 7.. lLO's target growth rate of GDP of. 8 percent is substantially higher than the srowth rat.. ranging between. S.2 and 6.1 pereant whieh were found possible in tha 1nput-output study. Substantlal differences a180 appear in the saetoral growth rates of labor productivlty.. As a consequence. the fate of employment generation. whieh results from the ILO Htl"4tegy appears very hiCh, 4.8 percent <lImu-. •. a11y, in comparison to 2.8 - 3.3 percent in this .tudy.. Finally, the. sectoral growth rates of value added in the lLO alternative donnot appear.
(33) 23&. rabIe 7.. •. Colombia: Comparisons oí Results Obtaineu in Con.lstency Study Under Alternatives 1 and 11 with lLO Full t~ployment Strategy, 1966-19&0 (compound annual growth ratea 1966-1980) •. Growth Rata. of Growth Rates of Growth Rates of Employment Value Added Labor Productivity r r r e p v i 1 i Employment Value Added Labor Productivity Alt.I Alt.II ILO Alt.I Alt.II ILO Alt.! Alt.II lLO. Sector. Agriculture. 3.8. 4.6. 5.4. 1.8. 2.2. 1.8. 2.0. 2.4. 3.5. Alpha 1/. 6.1. 7.0. 9.1. 2.8. 3.4. 6.9. 3.3. 3.6. 2.9. 5.3. 6.3. 8.5. 3.9. 4.4. 6.9. 1.4. 1.9. 1.5. 5.7. 6.3. 9.3. 3.8. 4.0. 8.3. 1.9. 2.3. 1.0. 5.2. 6.1. 8.1. 2.8. 3.3. 4.8. 2.4. 2.8. 3.2. Beta. 1/. C........ :J/. GOP. l/Alpha sectors are the capital and skill-inten.ive .ector.:. mining,. manufactur1ng, util1ties, and transportation.. l/Beta sector. are ndther ca¡>ital llor .kill-lntensive, l.e., construction. craft lndustry,. commerc~,. and personal services.. l/Gamma aactoro are skl11-lntensiva, 1.e., finance, government 8ervice., and other servlces. Source:. [4) .. .. • .1,.
(34) 24. to be interoally consbtent fr"", the den&and side. A growth rate of agricultural vale. added of 5.4 percent secms very high given likely. •. values of the income elaaticity of demand for food in Colombia and the export prospeccB. More Labor Intensive and More Productive Agriculture Since nonagricultll.re may not be in the positioo to absorb most of the uncmployed productively, it may be necessary to place a major emphaaia on agriculture and investigate to what extent ia it possible to create cmployment there.. TIten nonagriculture could be planned to absorb the. residual. The last two de.ades have seen the successful spread oí hlgh yieldlog varieties along with modero agricultural inputs which have increased output per area quite sub8tantially snd improved lncames in the small farm sector.. The new technology has also proven more labor intensive,. therefore, there is a considerable scope of cmploymeot generation es-. •. pecially on larger farms if excesslvc mechani.ation 18 avoided.. What. matters most, however, is the fact that by adopting che new technology even the very small farmar may be in the position to improve con.umption and ensure more adequate level of nutrition until such time when manufacturins industries and aervlces develop moro dynamism and are capable of offering more rewarding employment opportunities. ~utside. agriculture.. A full employment atrategy which aaaigna key importance to agriculture has been developed by the FAO.. ... It is. based on. &. careful and de-. talled investigation of labor absorptive alternative. at the mIcro level, namoly at the level of indlvidual cropa.. In the Colombian context of. dualism, agricultural production take. place in two distinctive subaector.:.
(35) 25. (1) u.lng labor-intensive, traditional waya of cultivation, accomplished v1th simple hand and animal methods, and (2) using fuUy mechanized,. •. capital intensivo methods.. Xf agricultura io to play its assigned role. in the full employment strategy, a mixed or intermediate technology viii have to be planned (to the extent that ie does not presently exiot) and becOOl4 dominant.. Such technolcgy would involvp. the use of high-yielding. vari.ties, fertilizers, insecticides, irrigation, and selected mechanizatlon.. !he scope for employment planning appears quito large since labor rcquirements for different crops vary substantially, depending On the technology uscd.. !he average for Colombia indicates that labor require-. menta per hectare are increased by 45 percent if traditional agriculture 18 modernized by means of intermediate tochnoiogy, out are reduced by 34. percent 1f mechanization is included in modernization The basic finding of the study, described in. [a].. [3) is that, if the inter-. mediate technology is favorcd, productivo employment in agriculture can grow quite rapidly, at as much as 3.5 percent per year, vhile output incre.ae. at about 4.5 percent per year.. Whilo productivity and incames in. the high income group vill grov at a dcclining rato, tilos e in the low income group vill increase more rapidly, thus bringing about a sizable redistribution in favor of the poor.. Such changes aro clearly in line with. the obJective ta stL..ulate internal demand and make the growth selfsuatained. FAO's full employment strategy via more labor intensive and more productive agricultura i8 designed within a framework vhich maintains internal consistency 41\d limits the analys1s ta feasible alternatives only.. •. !he mathodalogy, described in (2), check. the fea8ibility from several.
(36) 26. standpoints.. Fir.t. a macro model is used to determine GNP growth. alternatives, a po •• ible range of growth based on balance of payment.,. •. exports and other macro variables.. Second, on the basia of alternativo. lncome dlstributions and export prospects likely to prevail in the futuro (e.g. in 1980), maximum poaaible agricultural demand, by crop., i. determined.. Third, the feasibility of reaching projected demand levels from. the production sido i. checked under alternative technologios (i.e. check of input requirements against their availability at national level). Fourth, a check i. made as to what extent the actual growth of value added corresponda to the growth in income implied by the underly1ng 1ncome distribution objective.. That ls, to what extent is the growth aelf-. susta1ned wlthin agriculturc and ta what extent resource tronsfers into agriculture may be required to sustain the income distributicn ob.lectiva. Hultiplc Strategy Approach - La. Cuatro Estrategias. As a result of the rccent re-eKmnination of social and oconornic. ties in Colombia, Colombia's Department of Nat19nal PIannlng is. n~. ating a stratcgy which involves simultaneou. actlon on tour fronts The four-pronged approach, in fact, combines the two prevlously strategies and. th~.. rca11~. cvalu-. [9].. descr!.b~d. seems to indicate a preforence toward. a more balancad. and setective pattarn of devclopment. 10 propos.d in the following areas: ports and income dlstribution.. Concentration of determinate action urban c.onstruction, agriculture ex.. The first three concern productive activi-. ties and are expectcd to contribute sfgnificantly ta. lty, output and employment.. 1ncr~a8cd. productiv-. The third Is a corrective actloll, planned. to redistribute incornos toward a greater equality by direct government 1nterventlon where the econom1c procesa 16 judged unablc to do this on ita. own accord..
(37) ... ---------------. .- ..•. ----_._----------_ ... 27. Emph.sis on construetion (residential, publie, commerclal) steafrom the realization that eeonomic development in Colombla today i8 in-. •. separable frem urban development.. The .trategie 1mportance of the sector. of eon8truction to serve aa en lnducemant mechanism for 8ustained growth i. due to the following.. a) Housing ls bAdly needed, there is a large. but presently dormant demand forlt.. b) Ccnstruetlon is quite labor in-. tensive requiring large numbara of unskllled labor.. Furthermore, tbere. exiot strong and wldesprcad backward llnkages wlth other manufacturing seetors, with servic.s and agrlculture.. Hence, the direct and indirect. labor requirements aasodated with an increase in the final dem411d for housing io expeetod to be quite substantial and will greatly stimulate productive actlvlUA8. th"Ollg~O\.lt. linkages can be found in [10]).. the eco!!Omy (qusntit!!tive esti..ates of e) Higb labor componant and lin~ages. will mean that an lnerease in constructlon investment will have an 1mmediate lncrease in lncomes and consumption, thus stimulating and viden-. •. ing the presently l1m{ted domastie market and spreadlng the growth to the rest of the eeonomy.. d) The import contont of constructton la very low,. hence no undue prOS8ure on the balance of payment can be expected.. e). Publie eonstruction wl1l inerease badly needed facilities for edueation. The strategy concerning agricultura alms toward more productive, more modern technology avoiding undue lahor di8plaeement by meehanization. However, speeifie emphasis ia plaeed on more extensivo redistribution of land to achieve greater equaHty.. Tha Planning Dopartment makes it quite-. clear that produetivity in latifundia i8 quite low, even lover than in. •. minifundia and that a well-planned rediatribution of land can significantly contribute not only to higher productivity and output, but al so to rising. •. incomel and conoumptLon for a large segmont of the rural population..
(38) 28. Increase in exports is considered sine qua non to sustain the. growth oí manufacturinR industriAl, ineluding •. cope vith growing payments on foreign debt.. eonstruetion and a1so to Exports are expected to. pravide significant additional employment of their own in manufacturing ¡. ·. 88. vell as in agriculture.. The moasures vhieh are auggeated to "timulate. exporta and make them more competitive in vorld markets are along tbe lines already diseussed. While the three measures ju.t deseribed are designed to increase output, the fourth coneerns itself vith a more equal distribution of the gains from growth.. The generation oí additional employment, as envisioned. by tbe strategy, viII by itself 1mprove the existing distribution, es-. pecially if the employed come from the rank.s of un". .(fnd tmde~employ~-!.. However, tbere is a definite noed to mobilize additional funds for administrative and social services, vhich are badly needed, espccially fundo for education.. For tbis reason, ths income distribution aspect of the. strategy proposes a progressivo incame tax, carefully designed not to. •. lessen incentives.. In this vay tho fruits from economic growth may be. direeted where the need is greatost for the benefit of all •. •. •..
(39) SOURCES 1.. ILO, Towards Ful1 Emplcyment.. 2.. Erik Thorbecke, "A Methodology to Derive Consistent Agrieu1tural Projeetions under Teehnologieal Change within the Context of Overall Eeonomic Growth and Alternative Ineome Distribution.... FAD, Rome, 1911.. 3.. FAD (Dambe), Colombia: Colombian Agriculture.. •. r. 4.. A Programme for Colombia. Geneva, 1970.. Alternative Output and Emp10yment Prospeets for Pre1iminary draft. Rome, 1971.. Erik Thorbecke, J. K. Sengupta, A Censístency Framework for. ~ployr-,!ent. Output and Income Distribntion Prolections Applicd to Colombia.. Paper. prepared for the Development Rcsearch Center of the International Bank for ReconstructiOQ and Development, January 1972. 5.. Erik Thorbecke, "Uncmployment and Undcremployment in Latin America" Paper prepared for the Interameriean Development Bank, Iowa State University, Ames, Iowa,. 6.. Erik Thorbccké, ''Unanploj''ment and Undcremployrnent in the De-veloping Wo¡-ld" in U.S, Congress Joint Economic Coumittee, Hearings on A Foreir;n Ikonomic Poliey for the 1970' s, May 1970.. 7.. Republica de. 8.. K.C. Abercrombie, Agricultural Mechanization snd Employment in Latin Amcrlea. Internacional Labor Revicw, Vol. 106, No. 1, July 1972.. 9.. Republ1ea de Colombia, Las Cuatro Estrategias, Departamento lIacional de P1aneacion, Bogot~, 1972.. 10.. ~olombla,. Cuentas Nacionales, undated.. Repub1iea de Colombia, Aspectos Cuantitativos del Plan de Desarrollo, Documento de Trabajo, Departamento Nacional de Planeacion, 1972.. 11. Colombia Information Serviee, Colombia Today, Vo1s 6 & 7. Nev York, N.Y., 1971 & 1972. 12. Miguel Urrutia, "La Diatribueion del Ingreso en Colombia", Unpublished paper, 1972. 13.. Repub1iea de Colombia, La Realidad Rural y la Reforma Agraria como Factor INCORA, 1970.. ~ Cambio,. 14. USAlD Mission to Colombia, "Colombia: Agricultura1 Sector Analyab Paper", USAlD, 1972. 15.. FAD, IOORLn PRODUCTION 1970, United Nations,. Rome, 1970.
(40)
Figure
+4
Documento similar
Further results show that the negative impact of international trade on manufacturing employment is mainly determined by the export orientation policy in Denmark and the
Using changes in manufacturing output, changes in employment in the US service and manufacturing sectors, corporate tax receipts and changes in manufacturing imports, this
The particular effect of FDI on male employment rates shown in column one indicates that FDI has a positive and significant effect on total employment rate in
16 It is especially noteworthy that there were guilds of journeymen (though not from the maritime cargo-handling guilds). The relevance of this fact is the
17,18 Contrary to graphene, the band gap in ML-MDS separating the valence and conduction bands is naturally large and due to the absence of inversion symmetry in ML-MDS the
In the preparation of this report, the Venice Commission has relied on the comments of its rapporteurs; its recently adopted Report on Respect for Democracy, Human Rights and the Rule
Despite the sharp slowdown in recruitment in the public sector since 1983, this sector remains a key employer in the Moroccan labour market with a share of 22% of total employment
From 1947 at the latest, the CEA Scientific Committee had every intention of producing radioisotopes, and the CEA’s first high commissioner, Frédéric Joliot, had dreamed of
