Does erythropoietin regulate TRPC channels in red blood cells?
10
0
0
Texto completo
(2) Physiol Biochem 2017;41:1219-1228 Cellular Physiology Cell © 2017 The Author(s). Published by S. Karger AG, Basel DOI: 10.1159/000464384 and Biochemistry Published online: March 06, 2017 www.karger.com/cpb Danielczok et al.: EPO Regulation of TRPC Channels?. importance is increasingly recognized. The abundance of transient receptor potential channels of canonical type (TRPC channels) in primary erythroblasts, erythroid cell lines and RBCs [4-8] was associated with an increase in intracellular Ca2+ upon stimulation with Erythropoietin (Epo) [5, 6]. Although the activity-regulation of the different TRPC isoforms can be complex [9, 10], two independent studies on Epo-treated patients revealed diminished basal Ca2+ concentration or reduced phosphatidylserine exposure to the outer membrane leaflet that may be considered secondary to decreased intraerythrocytic Ca2+ levels [11, 12]. Furthermore, stimulation of RBCs with Prostaglandin E2 (PGE2) was associated with electrogenic Ca2+ influx [13, 14] and was considered as mediated by a TRPC channel [15]. The physiological and functional significance and importance of PGE2-mediated channel activity and Ca2+-signalling in stressed and Malaria-infected erythrocytes was previously documented [16-19]. To elucidate the effect of Epo and PGE2 we challenged mature human and mouse RBCs of several genotypes with both substances and recorded the intracellular Ca2+ content. Our results allow concluding that Epo and PGE2 regulation of the Ca2+ homeostasis is distinctly different between murine and human RBCs. In a previous investigation PGE2-stimulated Ca2+ entry in Epo treated patients was smaller compared to not Epo treated patients [12]. In this study the modulation of erythropoiesis could have caused the change in Ca2+ influx. Here we show that it is a direct effect of Epo: In human RBC, Epo itself has no effect on Ca2+ fluxes but inhibits the PGE2-induced Ca2+ entry. In murine mature RBCs Epo activates TRPC4/5 mediated Ca2+ entry whereas PGE2 leads to a TRPC independent Ca2+ entry. Material and Methods. Blood Samples Blood sampling from humans was approved by the ethical committee (Ärztekammer des Saarlandes, approval number 132/08) upon informed consent and blood sampling from animals was approved by the Saarland animal experiment commission (approval number H1-2.3.4.5). TRPC4/C5 double knock-out (dKO) mice and mice lacking all TRPC channels (hepta TRPC KO-mice) were generated in successive crossings of published single knock-out mice ([20] and references therein) until the desired multi- knock-out strains were obtained. The RBCs of both knock-out mouse lines did not show an obvious phenotype. Wild-type mice were C57Bl6/N, the same as the background of the dKO mice. For enriching reticulocytes (RNA) in the blood samples, mice were treated for an induction of a reticulocytosis as described before [21]. These experiments were conducted in accordance with the recommendations of the Guide for the Care and Use of Laboratory Animals of the National Institutes of Health. The protocol was approved by the State Office for Health and Consumer Protection (permit number: C1-2.4.3.4). Imaging We performed confocal Ca2+ imaging of mature human and mouse RBCs and we chose the imaging approach in particular because it allowed, in contrast to flow cytometry, to follow a cell population over time. In addition we have previously shown that for Ca2+ detection in RBCs, flow cytometry and microscopy lead to comparable results [22]. Microscopy has additionally an advantage if very fragile cells are measured that are likely to lyse under the rather harsh conditions (pressure and shear stress) in the flow cytometer [23]. The latter aspect is likely to be relevant for the rather fragile mouse RBCs. Confocal imaging was performed as previously described [24], in detail we used a multibeam array scanner (Infinity-4, VisiTech Int., Sunderland, UK) with a 491 nm DPSS laser (Calypso, Cobolt, Solna, Sweden). The confocal scanner was attached to an inverted microscope (TE2000-U, Nikon, Tokyo, Japan) utilising a 60x objective. Image acquisition was done with an EM-CCD camera (iXon887, Andor, Belfast, UK) and the entire measurement process was software controlled (VoxCellSCan, VisiTech Int., Sunderland, UK). RBCs were loaded with Fluo-4, AM (ThermoFisher Scientific, Waltham, MA, USA) at a concentration of 5 µM (from a 1 mM stock solution in DMSO containing 20% Pluronic F-127) for 1 hour. After the staining, cells were washed 3 times by 3 min centrifugation with 1000xg. Then RBCs were plated on coverslips and 20 min were allowed for. 1220.
(3) Physiol Biochem 2017;41:1219-1228 Cellular Physiology Cell © 2017 The Author(s). Published by S. Karger AG, Basel DOI: 10.1159/000464384 and Biochemistry Published online: March 06, 2017 www.karger.com/cpb Danielczok et al.: EPO Regulation of TRPC Channels?. sedimentation and deesterification of the Fluo-4. Data analysis was performed as previously described [21], data extraction (defining the regions of interest) was done in ImageJ (Wayne Rasband, National Institute of Health, USA), further data analysis and determination of the maximal cellular response was processed in Igor Pro 6.2 (WaveMetrics, Portland, Oregon, USA) with custom made macros and statistical analysis was performed in Prism 6 (GraphPad Software, La Jolla, California, USA). The physiological solution, in which RBCs were kept during the staining procedure and the experiments was Tyrode solution containing in mM: 135 NaCl, 5.4 KCl, 10 Glucose, 10 HEPES, 1.8 CaCl2, 1 MgCl2, pH 7.35 adjusted with NaOH, 300 mOsmol/ kg H2O. All experiments (human and mouse) were performed at least 3 times with RBCs from 3 different donors. PGE2 was purchased from ThermoFisher Scientific, Waltham, MA, USA and used at a concentration leading to a pronounced Ca2+ entry into RBCs [13, 14]. Epo was purchased from ProSpec-Tany TechnoGene Ltd., Ness-Ziona, Israel and applied at concentrations similar to those used by others to challenge RBCs [10, 11].. RNA analysis To purify human RBCs we followed a method originally developed by Beutler et al. [25]. Blood samples were centrifuged at 1000xg for 20 min. Plasma was aspirated and mixed with phosphate buffered saline (PBS) (1:10). Erythrocytes were washed 3 times (1000xg, 5 min) and mixed with PBS (1:1). Filter paper (Whatman No. 4 GE Healthcare, UK) was pressed in a 10 ml syringe (Omnifix Solo Lure, Braun, Germany) and a mixture of 180 mg Sigma- and 180 mg Alpha-Cellulose (Sigma-Aldrich, St. Louis, MO, USA) suspended in 10 ml PBS was added. After the PBS drained, the syringe was primed with 10 ml of the diluted plasma. 1 ml of RBCs were added and eluted with 10 ml PBS. Filtered RBCs were again washed 3 times in PBS. For a following RNA isolation RBCs were used immediately. To evaluate the purification of the RBCs we used the gelatin zymography technique, previously described by Achilli et al. [26]. This method allows the detection of contaminations with polymorphonuclear neutrophils (PMNs), a type of leucocytes that cannot be eliminated by washing the blood sample. PMNs are the only type of blood cells that express the matrix metalloproteinase 9 (MMP-9), whose catalytic activity against gelatin can be used as a specific marker. Briefly, 10 µl of diluted RBCs samples (PBS, 1:10) were lysed by adding Zymogram Tris-Glycine SDS Sample Buffer (1:1) (Thermo Fisher Scientific, Waltham, MA, USA), followed by a protein separation in 10% Gelatin Protein Gels (Thermo Fisher Scientific, Waltham, MA, USA) using a nonreducing SDS-PAGE. After separation (2 h, 125 V), gels were incubated for 1 h in Zymogram Renaturing Buffer (Thermo Fisher Scientific, Waltham, MA, USA) under continuous shaking and washed three times in Aqua dest. For activation of the catalytic activity of MMP-9, the gels were incubated for up to 40 h in a digestion buffer containing (in mM): 50 Tris-HCl pH 7.6, 150 NaCl, 10 CaCl2. Degradation of gelatin in the gel could be visualized after Coomassie blue staining as white spots. Fluorescence-activated cell sorting was performed with wild type murine blood samples using a FACSAria III (Becton Dickinson, Franklin Lakes, NJ, USA). Blood samples were initially filtered as described earlier. RBCs were incubated in PBS for 1.5 h at 4° C with the following antibodies: IgG2a rat anti-mouse CD71, PE-conjugated, clone RI7217 (BioLegend, San Diego, CA, USA) [1:40] and IgG2b rat anti-mouse CD45, APC-conjugated, clone 30F11 (Miltenyi Biotec, Bergisch Gladbach, Germany) [1:200]. RBCs were sorted CD71-positive (marker for reticulocytes) and CD45-negative (marker for leucocytes). A number of 65 to 70 x 106 cells were sorted, which were kept at 4° C for the duration of the sort and thereafter used immediately for RNA isolation. For leucocyte depletion we additionally used antibody-coupled magnetic beads. To reduce the number of CD45+ cells that needed to be eliminated we first performed the Ficoll-Paque separation of the blood sample. Blood was diluted with PBS and layered on top of the Ficoll-Paque solution (GE Healthcare, Little Chalfont, UK). After centrifugation (800xg, 25 min) plasma and a layer of leucocytes were removed and RBCs were washed three times in isolation buffer (PBS with 0.1 % BSA and 2 mM EGTA). Cells were incubated over night at 4° C with the following antibodies: IgG rabbit anti mouse/human CD45 (GeneTex Inc., Irvine, CA, USA) [1:40] and IgG rabbit anti mouse/human CD15 (Biorbyt, Cambridge, UK) [1:50]. Magnetic beads (Dynabeads sheep anti-rabbit, Thermo Fisher Scientific, Watham, MA, USA) were washed once in isolation buffer using a DynaMag Holder (Thermo Fisher Scientific, Watham, MA, USA) and then added to the RBCs (1:1) for further 120 min. To remove the bead-bound cells the RBC-Bead-Mix was washed twice in PBS again using the DynaMag Holder.. 1221.
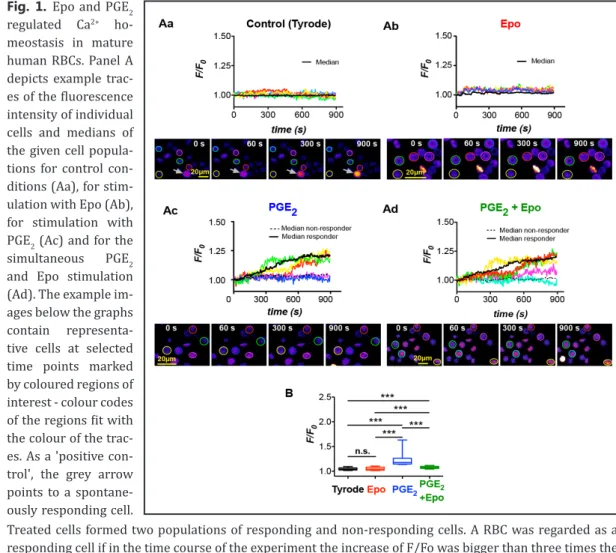
(4) Physiol Biochem 2017;41:1219-1228 Cellular Physiology Cell © 2017 The Author(s). Published by S. Karger AG, Basel DOI: 10.1159/000464384 and Biochemistry Published online: March 06, 2017 www.karger.com/cpb Danielczok et al.: EPO Regulation of TRPC Channels?. For RNA isolation we used the RiboPure RNA Purification Kit (Thermo Fisher Scientific, Watham, MA, USA) and 500 µl of human or murine blood samples, prepared as described before. Subsequently, the alpha and beta globin mRNA, which have the highest expression in reticulocytes, was removed from the total RNA preparations by using the GLOBINclear Kit (Thermo Fisher Scientific, Watham, MA, USA) according to the manufacturer´s protocol. Transcriptome analysis was performed by Expression Analysis Inc. (Henderson, CO, USA) using next-generation sequencing.. Results and Discussion. Figure 1 depicts fluorescence intensity traces, example images and a statistical analysis of human RBCs challenged with Tyrode solution only or with addition of 5 nM Epo, 0.1 nM PGE2 and both simultaneously, 1 min after the start of the imaging. The values presented remain as fluorescence intensity, because a calibration of the Ca2+ dyes in haemoglobin containing. Fig. 1. Epo and PGE2 regulated Ca2+ homeostasis in mature human RBCs. Panel A depicts example traces of the fluorescence intensity of individual cells and medians of the given cell populations for control conditions (Aa), for stimulation with Epo (Ab), for stimulation with PGE2 (Ac) and for the simultaneous PGE2 and Epo stimulation (Ad). The example images below the graphs contain representative cells at selected time points marked by coloured regions of interest - colour codes of the regions fit with the colour of the traces. As a 'positive control', the grey arrow points to a spontaneously responding cell. Treated cells formed two populations of responding and non-responding cells. A RBC was regarded as a responding cell if in the time course of the experiment the increase of F/Fo was bigger than three times the standard deviation of the control condition. The medians of the responding and non-responding population in (Ab) is plotted by black solid and dotted lines, respectively. Panel B provides the statistical analysis of the maximal response of RBCs under control conditions (Aa), with 5 nM Epo stimulation (Ab), 0.1 nM PGE2 stimulation (Ac) and simultaneous PGE2 and Epo stimulation (Ad). The RBC numbers analysed were 449 for Tyrode, 214 for Epo (7.2% responder), 218 for PGE2 (17.9% responder) and 370 for PGE2 and Epo simultaneously (13.4% responder). The diagram shows the median with 25-75 percentile box plots and 10-90 percentile whiskers. Significant differences were checked with the Mann-Whitney test with p>0.05 regarded as non significant (n.s.) and p<0.001 marked with ***.. 1222.
(5) Physiol Biochem 2017;41:1219-1228 Cellular Physiology Cell © 2017 The Author(s). Published by S. Karger AG, Basel DOI: 10.1159/000464384 and Biochemistry Published online: March 06, 2017 www.karger.com/cpb Danielczok et al.: EPO Regulation of TRPC Channels?. Fig. 2. Epo and PGE2 regulated Ca2+ homeostasis in mature murine RBCs of wild type mice. Panel A depicts example traces of the fluorescence intensity of individual cells and medians of the given cell populations for control conditions (Aa), for stimulation with 5 nM Epo (Ab), for stimulation with 0.1 nM PGE2 (Ac) and for the simultaneous PGE2 and Epo stimulation (Ad). The example images below the graphs contain representative cells at selected time points marked by coloured regions of interest - colour codes of the regions fit with the colour of the traces. A RBC was regarded as a responding cell if in the time course of the experiment the increase of F/Fo was bigger than three times the standard deviation of the control condition. The RBC numbers analysed for each condition were between 407 and 470. 63.1% of the RBCs responded to Epo, the same number responded to PGE2 and 81.1% of the RBCs responded to the simultaneous stimulation with Epo and PGE2. The diagrams show the median with 25-75 percentile box plots and 10-90 percentile whiskers. Significant differences were checked with the Mann-Whitney test with p>0.05 regarded as non significant (n.s.) and p<0.001 marked with ***.. cells is close to impossible [27]. PGE2 stimulation led to the increase in intracellular Ca2+ in agreement with our earlier findings [14]. Acute Epo stimulation alone had no effect on the intracellular Ca2+ concentration. However, 5 nM Epo was sufficient to inhibit the Ca2+ signals induced by 0.1 nM PGE2. These data confirm the observation of a decreased PGE2-induced Ca2+ response in Epo treated patients [12]. Because these results were in contradiction with what was reported for murine and human primary erythroblasts and erythroid cell lines [5, 6], we performed the same experiments with RBCs from wild type mice. The results are shown in Figure 2. The heterogeneity of the data is not caused by inter-individual differences but by a heterogeneous response of the cells similar as reported before for the stimulation with Lysophospatidic acid [21]. In murine RBCs, Epo as well as PGE2 induced a clear increase in the intracellular Ca2+. These stimulatory effects of PGE2 and Epo were additive suggesting the existence of two independent targets for the stimuli. In search of these targets we investigated the effects of PGE2 and Epo on the intraerythrocytic Ca2+ in TRPC4/C5 dKO-mice. As outlined in Figure 3, RBCs of TRPC4/C5 dKO-mice responded to the Epo stimulation with a modest depletion of intracellular Ca2+. Ca2+ uptake triggered by the PGE2 treatment appeared to be Epo-insensitive in these animals. This observation suggests that the Epo-induced Ca2+entry critically depends on TRPC4/C5. In line with these findings, responses of RBCs of hepta TRPC KO-mice to the stimulation with Epo and PGE2 were similar to those measured in RBCs of. 1223.
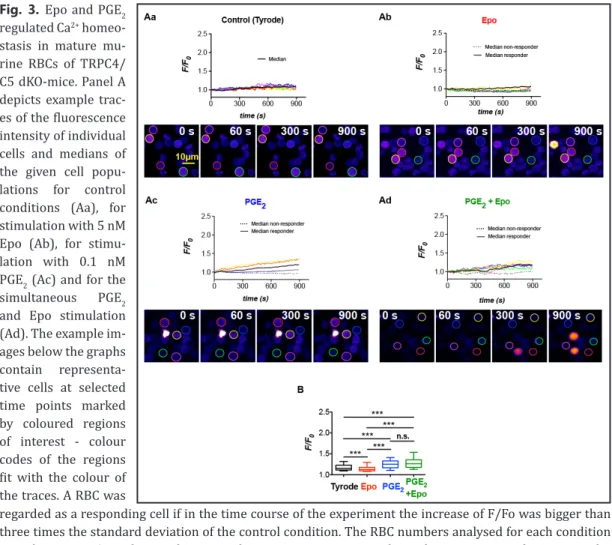
(6) Physiol Biochem 2017;41:1219-1228 Cellular Physiology Cell © 2017 The Author(s). Published by S. Karger AG, Basel DOI: 10.1159/000464384 and Biochemistry Published online: March 06, 2017 www.karger.com/cpb Danielczok et al.: EPO Regulation of TRPC Channels?. Fig. 3. Epo and PGE2 regulated Ca2+ homeostasis in mature murine RBCs of TRPC4/ C5 dKO-mice. Panel A depicts example traces of the fluorescence intensity of individual cells and medians of the given cell populations for control conditions (Aa), for stimulation with 5 nM Epo (Ab), for stimulation with 0.1 nM PGE2 (Ac) and for the simultaneous PGE2 and Epo stimulation (Ad). The example images below the graphs contain representative cells at selected time points marked by coloured regions of interest - colour codes of the regions fit with the colour of the traces. A RBC was regarded as a responding cell if in the time course of the experiment the increase of F/Fo was bigger than three times the standard deviation of the control condition. The RBC numbers analysed for each condition were between 359 and 400. The responding rate to Epo, PGE2 and simultaneous Epo and PGE2 stimulation was 60.7%, 70.3% and 93.8%, respectively. The diagrams show the median with 25-75 percentile box plots and 10-90 percentile whiskers. Significant differences were checked with the Mann-Whitney test with p>0.05 regarded as non significant (n.s.) and p<0.001 marked with ***. Table 1. Ca2+ uptake targeted by Epo and PGE2 in human and mouse erythroid precusors and mature RBCs. Erythroid precursor information are exclusively taken from the given references while the majority of mature RBC data are presented in this paper. The abbreviation n.d. denotes ‘not determined’. Because we found in the transcriptome of mouse reticulocytes a correlation between reads for TRPC1/C2 and CD45 (Fig. 5), we are uncertain about role of TRPC2 in erythroid precursor cells and therefore added a question mark. 1224.
(7) Physiol Biochem 2017;41:1219-1228 Cellular Physiology Cell © 2017 The Author(s). Published by S. Karger AG, Basel DOI: 10.1159/000464384 and Biochemistry Published online: March 06, 2017 www.karger.com/cpb Danielczok et al.: EPO Regulation of TRPC Channels?. Fig. 4. Epo and PGE2 regulated Ca2+ homeostasis in mature murine RBCs of hepta TRPC KO-mice. Panel A depicts example traces of the fluorescence intensity of individual cells and medians of the given cell populations for control conditions (Aa), for stimulation with 5 nM Epo (Ab), for stimulation with 0.1 nM PGE2 (Ac) and for the simultaneous PGE2 and Epo stimulation (Ad). The example images below the graphs contain representative cells at selected time points marked by coloured regions of interest - colour codes of the regions fit with the colour of the traces. A RBC was regarded as a responding cell if in the time course of the experiment the increase of F/Fo was bigger than three times the standard deviation of the control condition. The RBC numbers analysed for each condition were between 356 and 422. The percentage of responders for Epo, PGE2 and simultaneous Epo and PGE2 stimulation was 75.6%, 93.1% and 83.8%, respectively The diagrams show the median with 25-75 percentile box plots and 10-90 percentile whiskers. Significant differences were checked with the Mann-Whitney test with p>0.05 regarded as non significant (n.s.), p<0.01 marked with ** and p<0.001 marked with ***.. TRPC4/C5 dKO-mice (Fig. 4). The persisting Ca2+ increase by stimulation with PGE2 suggests that PGE2-induced Ca2+ entry in RBCs is TRPC-independent. The investigation of the hepta TRPC KO-mice was the only approach that allows such a conclusion because even putative experiments with a combination of single and double knock-out mice could fail to show such a result due to compensatory effects of different TRPC channel isoforms [28]. The results summarized in Table 1 show Ca2+ uptake evoked by Epo varies in erythroblasts [5, 6] and mature RBCs (Fig. 1-4). In mouse erythroblasts the major Epo activated Ca2+ channel is claimed to be the TRPC2 channel, whereas in human erythroblasts it is TRPC3 [5] regulated by TRPC6 [10]. In mature murine RBCs functional data (Fig. 3) indicate that the Epo induced Ca2+ entry is TRPC4/C5 mediated, while in mature human RBCs an Epo induced Ca2+ pathway is absent reflecting the putative absence of TRPC4/C5 in human RBCs. The negative regulation of the Epo induced Ca2+ entry by TRPC6 [10] is in agreement with indications of the presence of TRPC6 in mature RBCs [7]. Already previously, discrepancies of functional and molecular data in the context of ion channels have been reported [29], we tackled the investigation of TRPC channels on the molecular level by analysing RNA of reticulocytes. The difficulty in all investigations based on cell populations is the preparation of pure RBC suspensions as outlined in [23]. Our experiments on human RBCs underline this statement: Although we performed the state of the art preparation of cellulose filtering. 1225.
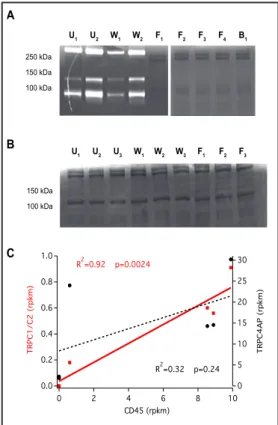
(8) Physiol Biochem 2017;41:1219-1228 Cellular Physiology Cell © 2017 The Author(s). Published by S. Karger AG, Basel DOI: 10.1159/000464384 and Biochemistry Published online: March 06, 2017 www.karger.com/cpb Danielczok et al.: EPO Regulation of TRPC Channels?. Fig. 5. Molecular analysis of RBCs. Gelatin zymography A was performed on human und murine blood samples W F B U U W F F F after 16 h digestion. (A) Coomassie blue stained human 250 kDa RBCs samples were analysed. Subscripts 1 to 4 refer to 150 kDa blood donors 1 to 4. U: unwashed samples, W: washed 100 kDa samples, F: cellulose filtered samples. Dark lanes in the background represent Coomassie stained RBC proteins, whereas gelatin degradation can be seen as white lanes. B U U U W W F F F W Unwashed and washed human blood samples show the typical pattern for MMP-9 activity as described before (Achilli et al.) [26], therefore being contaminated with 150 kDa 100 kDa PMNs. In addition sample B1 shows a human blood sample that was depleted from leucocytes using antibody– coupled magnetic beats. Like in the filtered samples C there is no trace of MMP-9 activity, meaning there is no detectable contamination with PMNs. (B) depicts murine blood samples from three different mice (subscripts 1 to 3). Unwashed samples (U) were again used as a positive control for MMP-9 activity, though they do not show the digestion pattern that was reported for human samples, making it impossible to draw any conclusion about the contamination level of the washed and filtered murine samples. Therefore we performed a correlation of reads from Next Generation Sequencing (NGS). NGS was applied to RNA extracted from mouse reticulocyte preparations. (C) The reads of CD45 (Tyrosin phosphatase, marker for leucocytes and hence for impurities of RBC preparation) are plotted against the sum of reads (rpkm – reads per kilobase per million mapped reads) for TRPC1/C2 channels (red squares fitted with a red solid line). Please note that two samples without any CD45 reads (just one point in the graph) also showed no reads for TRPC1/C2. For comparison we plotted the reads for the TRPC4 associated protein (TRPC4AP) with black circles fitted with a black dashed line. The correlation of TRPC1/C2 with CD45 is significant (**) while there is no correlation between TRPC4AP and CD45. 2. 1. 1. 2. 1. 2. 1. 2. 3. 4. 1. 3. 1. 2. 3. 1. 2. 3. [26] and the subsequent zymography test (Fig. 5A) ensured a clean preparation, only one out of four human samples was devoid of CD45 reads in next generation sequencing (NGS) analysis. For mouse RBCs the situation is even worse, because the zymography does not work on mouse RBCs (Fig. 5B). Therefore we followed two independent approaches to purify mouse RBCs: (i) by depleting CD45 and CD15 positive cells with magnetic beads and (ii) fluorescence-activated cell sorting (FACS) of CD71 positive and CD45 negative cells. Although we induced a reticulocytosis in the mice resulting in a reticulocyte count of approximately 30% and used the latest state of the art FACS technology, it took for each sample 6-8 hours non-stop sorting to get the required 65-70 million reticulocytes necessary for a NGS analysis. Additionally, to increase the sensitivity of the RNA analysis a reduction of the predominant globin-coding RNA was performed. Only the FACS sorted samples were free of CD45 reads with TRPC6 being the only detectable channel within the TRPC family. In all other samples reads for predominantly TRPC2 and partly TRPC1 channels occurred and these correlated with the amount of CD45 reads as outlined in Figure 5C, whereas TRPC4 associated protein (TRPC4AP) did not correlate with CD45 (Fig. 5C). From the data presented in Figures 1-5 we conclude that NGS is not sufficient to justify functional data reported based on knock-out models. We therefore regard a functional identification of ion channels as more sensitive than classical biochemical approaches including Western blots, especially when a small copy number of channels is considered. In light of these results, both, the sensitivity and the specificity (due to impure cell preparations) of previous studies must be critically reflected.. 1226.
(9) Physiol Biochem 2017;41:1219-1228 Cellular Physiology Cell © 2017 The Author(s). Published by S. Karger AG, Basel DOI: 10.1159/000464384 and Biochemistry Published online: March 06, 2017 www.karger.com/cpb Danielczok et al.: EPO Regulation of TRPC Channels?. Returning to the discussion of the physiological parameters: Beside the unequivocal effect of Epo on erythropoiesis, we report species-specific responses to Epo in murine and human RBCs. Whereas in human RBCs, Epo reduces Ca2+ uptake protecting RBCs from premature clearance during, e.g., inflammation induced eryptosis and hypoxic/anaemic episodes, this regulation mechanism is inverted in mice. Possible explanations include (i) differences in the abundance of Epo-receptors, (ii) differences in downstream signalling resulting in the regulation of Ca2+ uptake pathways, and (iii) differences in the Ca2+ uptake pathways. Beside the differences in TRPC channel abundance/function (Table 1), in mouse RBCs the Epo-receptor was determined to be heterogenic distributed and amounts between 2 and 105 receptors per cell (decreasing with cell age) [30]. Epo receptors were reported to be devoid in human reticulocytes [31] or to be at least very low in their abundance (about 6 binding sites per cell) [11]. We can speculate about the function of Epo-stimulated Ca2+ entry for RBC biology in mice: An increased Epo level, e.g. induced by hypoxia, would not only increase erythropoiesis but considering the increased intracellular Ca2+, also trigger eryptosis. This enables immediate recycling of iron and such allows for an effective reticulocytosis. A renewal of RBCs may lead to a more effective oxygen transportation without a significant increase in RBC number, which eventually would raise the thromboembolytic risk as it is known for human patients receiving high Epo doses [32]. Acknowledgements. The research leading to these results has received funding from the European Seventh Framework Program under grant agreement number 602121 (to LK and AB), the European Framework ‘Horizon 2020’ under grant agreement number 675115 (to LK and AB) and the NIH Intramural Research Program (project Z01-ES 101684 to LB), the Transregional Collaborative Research Centre (TR-SFB) 152 (to MF and PL), Collaborative Research Centre (SFB) 1118 (to MF) and the DZHK (German Centre for Cardiovascular Research), the BMBF (German Ministry of Education and Research) (to MF). Disclosure Statement. The authors have nothing to disclose. References 1 2 3 4 5 6 7. Tiffert T, Bookchin RM, Lew VL: Calcium Homeostasis in Normal and Abnormal Human Red Cells; in Bernhardt I, Ellory C (eds): Red Cell Membrane Transport in Health and Disease. Heidelberg, Springer, 2003, pp 373–405. Kaestner, L, Juzeniene A, Moan J: Erythrocytes – the “house elves” of Photodynamic Therapy. Photochem Photobiol Sci 2004;3:981-989. Bogdanova A, Makhro A, Wang J, Lipp P, Kaestner L: Calcium in red blood cells-a perilous balance. Int J Mol Sci 2013;14:9848–9872. Tong Q, Chu X, Cheung JY, Conrad K, Stahl R, Barber DL, Mignery G, Miller BA: Erythropoietin-modulated calcium influx through TRPC2 is mediated by phospholipase Cgamma and IP3R. Am J Physiol Cell Physiol 2004;287:C1667–C1678. Tong Q, Hirschler-Laszkiewicz I, Zhang W, Conrad K, Neagley DW, Barber DL, Cheung JY, Miller BA: TRPC3 is the erythropoietin-regulated calcium channel in human erythroid cells. J Biol Chem 2008;283:10385– 10395. Chu X, Cheung JY, Barber DL, Birnbaumer L, Rothblum LI, Conrad K, Abrasonis V, Chan Y, Stahl R, Carey DJ, Miller BA: Erythropoietin modulates calcium influx through TRPC2. J Biol Chem 2002;277:34375–34382. Foller M, Kasinathan RS, Koka S, Lang C, Shumilina EV, Birnbaumer L, Lang F, Huber SM: TRPC6 contributes to the Ca2+ leak of human erythrocytes. Cell Physiol Biochem 2008;21:183–192.. 1227.
(10) Physiol Biochem 2017;41:1219-1228 Cellular Physiology Cell © 2017 The Author(s). Published by S. Karger AG, Basel DOI: 10.1159/000464384 and Biochemistry Published online: March 06, 2017 www.karger.com/cpb Danielczok et al.: EPO Regulation of TRPC Channels?. 8 9. 10 11 12 13 14 15 16 17 18 19 20 21 22 23 24 25 26 27 28 29 30 31 32. Kucherenko YV, Bhavsar SK, Grischenko VI, Fischer UR, Huber SM, Lang F: Increased cation conductance in human erythrocytes artificially aged by glycation. J Membr Biol 2010;235:177–189. Chu X, Tong Q, Cheung JY, Wozney J, Conrad K, Mazack V, Zhang W, Stahl R, Barber DL, Miller BA: Interaction of TRPC2 and TRPC6 in erythropoietin modulation of calcium influx. J Biol Chem 2004;279:10514–10522. Hirschler-Laszkiewicz I, Tong Q, Conrad K, Zhang W, Flint WW, Barber AJ, Barber DL, Cheung JY, Miller BA: TRPC3 activation by erythropoietin is modulated by TRPC6. J Biol Chem 2009;284:4567–4581. Myssina S, Huber SM, Birka C, Lang PA, Lang KS, Friedrich B, Risler T, Wieder T, Lang F: Inhibition of erythrocyte cation channels by erythropoietin. J Am Soc Nephrol 2003;14:2750–2757. Wang J, van Bentum K, Sester U, Kaestner L: Calcium homeostasis in red blood cells of dialysis patients in dependence of erythropoietin treatment. Front Physiol 2014;5:16. Li Q, Jungmann V, Kiyatkin A, Low PS: Prostaglandin E2 stimulates a Ca2+-dependent K+ channel in human erythrocytes and alters cell volume and filterability. J Biol Chem 1996;271:18651–18656. Kaestner L, Tabellion W, Lipp P, Bernhardt I: Prostaglandin E2 activates channel-mediated calcium entry in human erythrocytes: an indication for a blood clot formation supporting process. Thromb Haemostasis 2004;92:1269–1272. Foller M, Kasinathan RS, Duranton C, Wieder T, Huber SM, Lang F: PGE2-induced apoptotic cell death in K562 human leukaemia cells. Cell Physiol Biochem 2006;17:201–210. Kaestner L, Bernhardt I: Ion channels in the human red blood cell membrane: their further investigation and physiological relevance. Bioelectrochem 2002;55:71–74. Lang PA, Kempe DS, Myssina S, Tanneur V, Birka C, Laufer S, Lang F, Wieder T, Huber SM: PGE2 in the regulation of programmed erythrocyte death. Cell Death Differ 2005;12:415–428. Thomas SLY, Egée S, Lapaix F, Kaestner L, Stains HM, Ellory JC: Ionic channels in malaria-infected chicken red cells. FEBS Lett 2001;500:45-51. Lang PA, Kasinathan RS, Brand VB, Duranton C, Lang C, Koka S, Shumilina E, Kempe DS, Tanneur V, Akel A, Lang KS, Föller M, Kun JFJ, Kremsner PGK, Wesselborg S, Laufer S, Clemen CS, Herr C, Noegel AA, Wieder T, Gulbins E, Lang F, Huber SM: Accelerated clearance of Plasmodium-infected erythrocytes in sickle cell trait and annexin-A7 deficiency. Cell Physiol Biochem 2009;24:415–428. Liao Y, Abramowitz J, Birnbaumer L: The TRPC family of TRP channels: roles inferred (mostly) from knockout mice and relationship to ORAI proteins. Handb Exp Pharmacol 2014;223:1055–1075. Wang J, Wagner-Britz L, Bogdanova A, Ruppenthal S, Wiesen K, Kaiser E, Tian Q, Krause E, Bernhardt I, Lipp P, Philipp SE, Kaestner L: Morphologically homogeneous red blood cells present a heterogeneous response to hormonal stimulation. PLoS ONE 2013;8:e67697. Wesseling MC, Wagner-Britz L, Boukhdoud F, Asanidze S, Nguyen DB, Kaestner L, Bernhardt I: Measurements of Intracellular Ca2+ Content and Phosphatidylserine Exposure in Human Red Blood Cells: Methodological Issues. Cell Physiol Biochem 2016;38:2414–2425. Minetti G, Egée S, Mörsdorf D, Steffen P, Makhro A, Achilli C, Ciana A, Wang J, Bouyer G, Bernhardt I, Wagner C, Thomas S, Bogdanova A, Kaestner L: Red cell investigations: Art and artefacts. Blood Rev 2013;27:91– 101. Hui X, Reither G, Kaestner L, Lipp P: Targeted activation of conventional and novel protein kinase C through differential translocation patterns. Mol Cell Biol 2014;34:2370-2381. Beutler E, West C, Blume KG: The removal of leukocytes and platelets from whole blood. J Lab Clin Med 1976;88:328–333. Achilli C, Ciana A, Balduini C, Risso A, Minetti G: Application of gelatin zymography for evaluating low levels of contaminating neutrophils in red blood cell samples. Analytical Biochem 2011;409:296–297. Kaestner L, Tabellion W, Weiss E, Bernhardt I, Lipp P: Calcium imaging of individual erythrocytes: Problems and approaches. Cell Calcium 2006;39:13–19. Nilius B, Flockerzi V: Mammalian transient receptor potential (TRP) cation channels. Preface. Handb Exp Pharmacol 2014;223:v - vi. Kaestner L: Channelizing the red blood cell: molecular biology competes with patch-clamp. Front Mol Biosci 2015;2:46. Mihov D, Vogel J, Gassmann M, Bogdanova A: Erythropoietin activates nitric oxide synthase in murine erythrocytes. Am J Physiol Cell Physiol 2009;297:C378–C388. Broudy VC, Lin N, Brice M, Nakamoto B, Papayannopoulou T: Erythropoietin receptor characteristics on primary human erythroid cells. Blood 1991;77:2583–2590. Singbartl G: Adverse events of erythropoietin in long-term and in acute/short-term treatment. Clin Investig 1994;72:S36–S43.. 1228.
(11)
Figure

Documento similar