pH effect on thermo optical response of Er3+ doped silicagel prepared by the sol gel method
14
0
0
Texto completo
(2) https://cimav.repositorioinstitucional.mx/jspui/ properties of the vitreous sol-gel matrix, particularly luminescence (Weber, 1990; Blasse, 1987; Lucas et al., 1978; Kohli and Shelby, 1991). When the samples are exposed to a high intensity laser light source, additional effects to fluorescence may occur, for example, a local heating due to the absorption of the incident radiation on the matrix (Baesso et al., 1997; Durville and Powell, 1987; John et al., 1992; Alvarez et al., 1996). This localized change of temperature may cause a local change in the refractive index, known as thermal lens effect. Due to the importance of this effect it has been studied largely in optical glasses Baesso et al. 1997; Durville and Powell, 1987; John et al., 1992; Alvarez et al., 1996; Falcao et al., 2005; Baesso et al., 1999). In this work, we present preliminary results on the study of spectroscopic properties, thermooptical and thermo-gravimetric analysis of glasses with trivalent erbium impurities prepared with the sol-gel technique for different pH values. Experimental details Erbium doped glasses were prepared by the sol–gel technique from Teraethylorthosilicate (TEOS) taken as the glass precursor. The molar ratio of TEOS was 1:1:1 with respect to the ethanol and tri-distilled water, the other constituents used in the preparation. Appropriate molar quantities of Er(NO3)3.5H2O were dissolved in tridistilled water along with nitric acid and aqueous ammonia to change the pH in a 2 to 5 range. TEOS and ethanol were stirred for about 15 min and then distilled water containing dopants was added to the mixture and stirred for 2 h until gelation started. The mixture was placed in plastic cells, covered with parafilm (flexible film), and its evolution was followed by UV-Vis spectroscopy. After 150 h at room temperature (RT), a pink solid glass sample was obtained retaining approximately 10% of the initial. 2.
(3) https://cimav.repositorioinstitucional.mx/jspui/ volume. The sample was dried at room temperature for 3 weeks, then for 3 days at 70°C and finally one more day at 120°C.. Thermal lens experiments were performed by using an experimental arrangement as described by Durville and Powell (1987). The excitation source was an argon laser model Melles Griot 35 LAP 431-220. The 488 nm line of the laser allowed performing resonance experiments with an electronic transition of the Er3+ glass samples. A 10 mW He-Ne laser was used as a probe to detect changes in the refraction index induced by the excitation beam. The wavelength and the low power of the attenuated probe beam did not cause any alteration on the refractive index. The excitation and the probe laser beams were collinear and focused inside the sample using a lens with a focal distance of 10 cm. The thickness of the sample is 0.2 cm; the transmitted excitation beam was filtered out and the resulting intensity I(t) at the center of the probe beam was monitored using a pinhole and a Hamamatsu R928. 3.
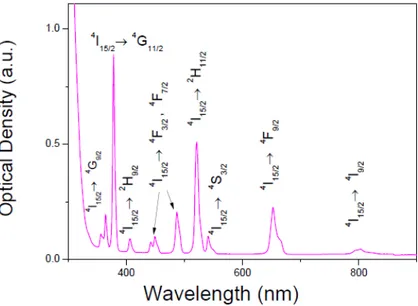
(4) https://cimav.repositorioinstitucional.mx/jspui/ photomultiplier tube. The signal was processed by using an EGG/PAR boxcar average and readout done on a stripchart recorder. Results and discussion Thermal properties The thermo-gravimetric analysis (TGA) was performed on a pH 5 glass (that is, a glass sample prepared from a starting solution of TEOS, water, ethanol and nitric acid with a corresponding pH = 5); it is shown in Figure 1; red line shows that the glass sample exhibits a constant mass loss until 800°C; the accumulated loss is approximately a 30% of its initial mass. This can be explained in terms of the loss of almost all the solvents contained in the whole glass. The differential thermal analysis (DTA) curve (blue line) showed an endothermic signal around the 50 to 125°C corresponding to the phase change on the sample; however, an exothermic signal occurred between 200°C and 400°C. It can be due to the decomposition of the nitric compounds. Also, the first weight loss of 2% around the 50°C is appreciable which is in agreement with the first exothermic signal in the DTA curve. This weight loss is mainly due to water evaporation (Rao and Pajonk, 2003). Optical properties In the visible range, the optical absorption spectrum of Er3+ ion in the sample prepared with pH 5 is presented in Figure 2. This consists of a series of narrow bands that goes from the UV to the IR regions. These spectroscopic characteristics can be associated to transitions from the ground state 4I15/2 to the different excited states in the configuration 4f12 of Er3+ (Sosa et al., 2001).. 4.
(5) https://cimav.repositorioinstitucional.mx/jspui/ Figure 3 shows a characteristic RT emission spectrum of a pH 5 Er3+-doped solgel glass sample excited at 280 nm. This emission consist structured broad band localized from 320 to 500 nm. The inset shows the intrinsic emission spectrum of undoped sol-gel glasses under same wavelength excitation (Garcia et al., 1995), this emission does not exhibit a structure similar to that exhibited by the emission of the solgel glass doped with erbium. In order to get a better insight of this process, a careful analysis of the observed structure in the emission board band was carried out. It was found that each time that a ―hole‖ is produced in the emission band, an absorption peak is present in the sol-gel glasses, corresponding to the absorption bands associated with the Er3+ ions. This one-to-one correspondence is clearly observed in Figure 4 in which the intrinsic emission spectrum Er3+-doped sol-gel glass has been drawn superimposed on their absorption spectrum. This result shows evidence that a radiative energy transfer occurred from the sol-gel glass to Er3+ ions, in every investigated samples.. 5.
(6) https://cimav.repositorioinstitucional.mx/jspui/. Under resonant conditions for the Er3+ UV–Visible excitation, no light emission that could be associated with the guest ions was detected in the 400 to 850 nm range,. 6.
(7) https://cimav.repositorioinstitucional.mx/jspui/ within the resolution of our experimental setup. Such a behavior could be related to the non-radiative relaxation processes resulting from the host-Er3+ interactions in our samples (Sosa et al., 2001). Another possible channel of non-radiative relaxation is the concentration quenching effect, which is due to the energy migration all over the sample caused by the energy transfer between two nearby Er ions, one being in some excited state and the other in the ground state. Due to this interaction, energy can migrate through the glass until a quenching center is met and the excitation is lost (Shixun et al., 2006; Pacifici et al., 2003; Snoeks et al., 1996). Preliminary results on the dependence of the optical properties of these materials on the concentration of Er ions suggest that the first mechanism mentioned pre-viously is the dominant one in each sample; it prevents the observation of any emission band associated with the relaxation of the erbium ions from the excited state to the ground state. Currently, experiments are being conducted in our laboratory in order to confirm these observations and to elucidate the actual nature of this phenomenon. Thermo-optical properties In the analysis of thermal lens effect, the wavelength of 488 nm was used to resonantly excite the transition corresponding to the absorption of the erbium ion. An attenuated 10 mW red He–Ne laser was used as a probe-beam to detect changes in the refractive index induced by the excitation beam. The spatial pattern of the transmitted probe beam was observed for different experimental conditions. The results were qualitatively similar for glasses prepared by the sol-gel method at different pH 2, 3, 4 and 5. Figure 5 shows the time evolution of the I(t), intensity at the center of the transmitted probe beam when the samples were placed just before and after the beam. 7.
(8) https://cimav.repositorioinstitucional.mx/jspui/ waist of the probe beam. If the sample was placed just before the beam waist, we observed an expansion of the transmitted probe beam profile when the excitation beam was turned on. With the samples placed just after the beam waist of the probe beam, we observed a contraction of the transmitted spatial pattern. These observations indicate that the excitation beam causes the sample to act as a positive lens. The magnitude of the change in the beam profile depends on the absorbance of the sample at the wavelength of the excitation and power of the excitation beam, as well as on the exact position of the sample relative to the beam waist of the probe beam.. The temporal variation of the observed changes in the probe-beam intensity provides useful information for understanding the mechanism of the laser-induced refractive index changes. A typical time evolution, of intensity in the center of the transmitted probe beam after tuning on the excitation beam is shown in Figure 5. The decay curves I(t) show two well-defined stages; the first stage lasts a few seconds while. 8.
(9) https://cimav.repositorioinstitucional.mx/jspui/ the second stage lasts several minutes before it reaches equilibrium. If the excitation beam is turned off after the equilibrium point, the signal does not return to its original level. This suggests the creation of permanent changes in the refrac tive index. The general characteristics and the response time observed in our experiments, in the first stage of the thermal lensing is the dominating mechanism of the laser induced refractive index that changes at medium power levels (10-2 to 10-3 W cm-2). Also, for our experimental configuration, the relative change in the intensity at the center of the transmitted probe beam can be determined from ray analysis by using transfer matrices under a Gaussian-beam approximation (Durville and Powell, 1987). According to this model, the ratio I0/I(t) is given by. where Ʈc = ω2 / 4D, ω is the excitation beam radius inside the sample and D is the thermal diffusivity in units of (cm2-s1). With D = ҡ/ƿCp, where ҡ is the thermal conductivity (cal s-1 cm-1 °C-1), ρ is the density (g cm-3) and Cp is the specific heat capacity (cal g-1 °C-1). The Ʈc constant represents the characteristic build-up time of the thermal lensing. Parameter θ of the equation is a dimensional and collects a set of variables and can be considered like a measurement of the self-focusing phenomenon (John et al., 1992; Hu and Whinnery, 1973; Gordon et al., 1965).. 9.
(10) https://cimav.repositorioinstitucional.mx/jspui/ where P is the power of the incident beam, α is the absorption coefficient at incident radiation at wavelength of the excitation beam λ/ is the thickness of the simple, and (dn/dT) is change in the refractive index produced by temperature rise. A computer fit to the experimental data using Equation (1) was obtained by treating θ and Ʈc as adjustable parameters. As an example, Figure 6 shows a typical result of such a fitting. Good agreement is obtained between the theoretical fit and the experimental results of the sample pH 5 of SiO2:Er3+. The values obtained for all the studied samples for different pH values are shown in Table 1.. 10.
(11) https://cimav.repositorioinstitucional.mx/jspui/ The 488 nm line laser Ar+ corresponds to the resonant excitation of the Er3+ ions; the heat is generated through radiationless relaxation processes producing local vibrational modes transferring their energy to the phonon modes of the glass network. The time constant of the thermal lensing is then governed both by the interaction between the rare-earth ions and the phonons and by the thermal properties of the bulk sample, namely the heat diffusion coefficient. The observed difference in the time constant Ʈc between the five samples reflects a difference in the thermal diffusivities of the sol gel glasses synthesized at different pH. The thermal properties of the bulk sample are pH dependent because they have different glass network structures with implications on the short-range structure, different for every one of the four glasses (Durville and Powell, 1987; Brinker and Scherer, 1985). The differences in the time constants for thermal lensing can be used to explain the differences in the strengths of the thermal lensing. The strength of the thermal lensing is associated with the change of the glass polarizability. The glass network at pH 5 sample is much more sensitive to thermal effects than the other samples because of the lower thermal conductivity (Durville and Powell, 1987). Conclusion In summary, experimental data on the effects of pH conditions during the synthesis of the SiO2:Er3+ (5% mol.) sol-gel glasses are presented and discussed. From the study of the optical properties of the pure and doped samples of Si02 sol sol-gel glasses, we have given evidence of an active mechanism for radiative energy transfer between the host glass and the Er3+. The thermo-optical parameter shows a. 11.
(12) https://cimav.repositorioinstitucional.mx/jspui/ dependence on the pH of the synthesis of glasses. These results provide quantitative information on thermal lens effects in sol-gel Er3+ doped glasses. The optical and thermo-optical properties have been employed to get a better understanding on the effects that are induced by dopant lanthanide ions on the properties of the network related with θ and Ʈc thermooptical parameters. Acknowledgements This work was partially supported by Consejo Nacional de Ciencia y Tecnología (CONACyT) under project 52349 F-2006 and PROMEP under project P/CA-121 200626-20. References Alvarez ER, Carrillo IG, Castaño ET, Muñoz AF, Clark AB, Taheri B (1996). Thermal lensing effects in Pr3+doped ZnO-CdO-SiO2 luminescent glass, J. Phys. Condens. Matt., 8: 5643–5648. Baesso ML, Bento AC, Andrade AA, Catunda T, Sampaio JA, Gama S (1997). Neodymium concentration dependence of thermo—optical properties in low silica calcium aluminate glasses. J. Non-Cryst. Solids, 219: 165-169. Baesso ML, Bento AC, Duarte AR, Neto AM, Miranda LCM, Sampaio JA, Catunda T, Gama S, Gandra FCG (1999). Nd2O3 doped low silica calcium aluminosilicate glasses: Thermomechanical properties, J. App Phys., 85: 8112-8118. Blasse G (1987).The quenching of rare-earth ion luminescence in molecular and non-molecular solids. Mat. Chem. Phys. 16: 237-252. Brinker CJ, Scherer GW (1985). Sol–Gel–Glass: I. Gelation and Gel Structure. J. Non-Cryst. Solids, 70: 301-322.. 12.
(13) https://cimav.repositorioinstitucional.mx/jspui/ Durville FM, Powell RC (1987). Thermal lensing and permanent refractive index changes in rare-earth-doped glasses. J. Op Soc. Am. B, 4: 1934-1937. Falcao EA, Steimacher A, Medina AN, Perreira JRD, Bento AC, Baessso ML, Remédios CMR, Sasaki JM (2005). Temperature dependence of the thermo-optical properties of KDP single crystal measured by thermal relaxation and thermal lens methods J. Phys. IV, 125: 391-394. Garcia JM, Mondragón MA, Tellez CS, Campero A, Castaño VM (1995). Blue emission in tetraethoxysilane and silica gels, Mat. Chem. Phys., 41: 15-17. Gordon JP, Leitte RC, Moore RS, Porto SPS, Whinnery JR (1965). LongTransient Effects in Lasers with Inserted Liquid Samples. J. App. Phy., 368: 3-8. Hu C, Whinnery JR (1973). New thermo optical measurement method and comparison with other methods. App. Opt., 12: 72-79. John DS, Taheri B, Wicksted JP, Powell RC (1992). Time-dependent thermal lensing in lead oxide–modified silicate glass. J. Opt. Soc. Am. B, 9: 610-616. lensing in lead oxide–modified silicate glass. J. Opt. Soc. Am. B, 9: 610-616. Kohli JT, Shelby JE (1991). Formation And Properties Of Rare-Earth Aluminosilicate Glasses, Phys. and Chem. Glasses, 32: 67-72. Lucas J, Chanthanasinh M, Poulain M, Brun P, Weber MJ (1978). Preparation and optical properties of neodymium fluorozirconate glasses. J. Non-Cryst. Solids, 27(2): 273-283. Pacifici FD, Irrera A, Franzo G, Miritello M, Lacona F, Priolo F (2003). Erbiumdoped Si nanocrystals: optical properties and electroluminescent devices. Phys. E: Lowdimensional Systems and Nanostructures.16: 331-340.. 13.
(14) https://cimav.repositorioinstitucional.mx/jspui/ Rao KAV, Pajonk RR (2003). Hydrophobicity And Physical Properties Of Teos Based Silica Aerogels Using Phenyltriethoxysilane As A Synthesis Component, J. Mater. Sci., 38: 4407-4413. Sosa Fonseca R, Flores M, Rodriguez RT, Hernández J, Muñoz AF (2001). Evidence of energy transfer in Er3+-doped PMMA-PAAc copolymer samples, J. Lum., 93: 327-332. Shixun Dai, Chunlei Yu, Gang Zhou, Junjie Zhang, Guonian Wang, Lili Hu (2006). Concentration quenching in erbium-doped tellurite glasses, J. Lum., 117: 39- 45. Snoeks E, Kik PG, Polman A (1996). Concentration quenching in erbium implanted alkali silicate glasses. Op. Mat., 5: 159-167. Weber MI (1990). Science and technology of laser glass. J. Non-Crystalline Solids, 123: 208-222.. 14.
(15)
Figure
Documento similar
The Brownian dynamical analysis based on the information ex- tracted from optical forces and torques on a particle in an optical tweezer, the analysis of the fulfillment of actio
The proposed architecture consists of a RFID tag printed on a flexible substrate for the monitoring of four different gases by means of chemical sensors with optical response.. The
Abstract: Transepidermal water-loss (TEWL), stratum-corneum hydration (SCH), erythema, elas- ticity, pH and melanin, are parameters of the epidermal barrier function and
Finally, by exploiting the temporal Talbot effect, DCS can be performed with two trains of optical pulses, as well as control their relative spectral phase by a fine tuning of
succeeded in improving the bioactivity and biocompatibility of grade 4 titanium dental implants by employing sol-gel hybrid coatings synthesized from polyethylene glycol (PEG) and
influence of these parameters on the size and distribution of Te inclusions, deep defects, optical and electrical properties of CdZnTe detectors. In the fourth chapter, the effect
In this work we use optical imaging and integral field spec- troscopy (IFS) to study the impact of the minor merger on the star formation properties of the individual galaxies of
We focus in the present paper on a level of description named Functional Thermo-Dynamics (FTD), which is char- acterized by the density field and the energy density field as
