An investigation on financial literacy: The Italian case
64
0
0
Texto completo
(2) Table of contents Abstract Introduction I. Literature review. page 4. 1.1 Attempts to explain the differing patterns of financial literacy in the population page 5 1.2 Efforts to evaluate the efficacy of individual financial literacy programs page 7 1.3 The New Zealand: a case of successful initiative to improve financial literacy page 9 1.4 The Italian case. page 11. II. The level of Italian’s financial literacy: a questionnaire proposed to the Italian population. page 14. 2.1 The design of the questionnaire. page 14. 2.2 The administration of the questionnaire. page 16. 2.3 Results of the questionnaire. page 17. 2.3.1 Socio demographic results. page 19. 2.3.2 The level of financial literacy of the sample. page 26. 2.4 Correlations between results: main evidences. page 34. 2.5 Anova test with R. page 37. III. Possible solutions to increase the Italian financial literacy. page 39. 3.1 Italians’ platforms preferences: results from the questionnaire. page 39. 3.2. A website to increase Italians’ financial literacy. page 45. 3.3 A proposal: an interactive mobile app. page 48. Conclusion Appendix A Appendix B Bibliography. 1.
(3) Abstract In the recent past a lot of studies have been devoted to analyze people’s financial literacy level. According to the results of such studies, Italy is always at the bottom of the list of all the European countries, with one of the lowest level of financial literacy in Europe (see the Program for International Student Assessment survey) and with the evidence of various gaps concerning the gender and respondents’ regional position. A questionnaire with 30 questions concerning both financial literacy and sociodemographic questions has been proposed to a sample of 105 Italian citizens. The main goal is to measure their level of financial literacy and understand their preferences for an innovative tool to increase it. The result of the survey shows that there exists a gender gap in financial literacy in Italy, but there are not enough elements to say that regional position of respondents matters in the sample. Based on the answers collected, people seems to prefer a website to find out information about finance. This result leads to the proposal of an innovative app connected to the national web site “Quello che conta”, to improve the Italian financial literacy.. Keywords: financial literacy, Italians’ financial literacy, questionnaire. 2.
(4) Introduction In today's economy and financial World it is not always enough to rely completely on experts of the financial sector. Each people should have a basic knowledge concerning the management of its own finances. To manage its own finances means to have a view of which are the main financial instruments of the market and what is the best way to use money. To do it each individual should be financial literate. Financial literacy is described by the OECD (2005“fundamental tool to increase people's material well-being, thanks to its role in improving choices in terms of training and wealth management and in reducing the risk of errors, deceptions and real frauds”. These positive effects have been widely highlighted by international organizations, with the OECD in first line, from the academic world and from the financial sector operators themselves (Brandimanti et al., 2017). Being Italy one of the European Country with the lowest rate (37% of people in Italy are financial literate, against the European average 52%) of financial literacy in the European Union (Klapper et al. , 2013) I thought it would be interesting to go more in deep on the topic and to suggest a different approach to increase the financial literacy in Italy. In order to propose an effective solution, it is useful to study both the financial literacy and the preference of a sample of people, and to check if the proposed method could have a positive feedback from the market. The dissertation is composed by three chapters: the first one reviews the main literature about financial literacy and the efficacy of some policies adopted during the years to increase it. The second chapter contains a questionnaire that I designed for a sample of 105 Italian people to see their literacy and the various possible correlations between factors. The third chapter deals with a solution proposed to increase the Italian financial literacy based on evidences and preferences of the questionnaire and on the existing tools.. 3.
(5) I Literature review To analyze the different results and findings concerning the financial literacy around the world is useful to first define what is financial literacy. It is easy to make mistakes in interpreting the meaning of financial literacy and associate it to the definition of “financial knowledge”. The definition that in my opinion explains in the easiest way what is financial literacy is the one by Sandra J. Huston (2010) “Financial literacy could be defined as measuring how well an individual can understand and use personal finance-related information”. From these definitions it is easy to understand that having financial literacy not only means to have knowledges in finance related subjects, but also to be able to apply these knowledges. Some papers use financial literacy and financial knowledge as substitute, and this is a problem because creates misunderstanding while reading the papers and analyzing the results of the tests. Several definitions of financial literacy have been proposed. Starting form Noctor et al. (1992) who had a more theoretical approach focusing on the decision making ability, they say: ‘'Financial literacy is the ability to make informed judgments and to take effective decisions regarding the use and management of money’’, a more philosophical approach, considering financial literacy as a tool of survival, is proposed using this definition “Financial literacy is a basic knowledge that people need in order to survive in a modern society” (Kim, 2001). Financial literacy has been also considered a tool needed to survive in the American life: “Financial knowledge is defined as understanding key financial terms and concepts needed to function daily in American society” (Bowen, 2002). The literature about financial literacy itself can be divided into two areas: attempts to explain the differing patterns of financial literacy in the population and the efforts to evaluate the efficacy of individual financial literacy programs. The difference between them is that the first one has the aim to explain what is financial literacy and how is considering around the world and from different authors, the second one focuses on a step further: the evaluation of the efficacy of measures already adopted for the increase of financial literacy around the world. Both aspects are going to be reviewed more in dept in the next two subparagraphs.. 4.
(6) 1.1 Attempts to explain the differing patterns of financial literacy in the population. The topic has been analyzed by several authors, and several questionnaires have been made around the world to test the level of financial literacy. One of the first and most famous paper about financial literacy is the one made in 2008 for the Jump$tart Coalition® for Personal Financial Literacy by Lewis Mandell ''The financial literacy of young American adults''. In 1997 started to make biennial surveys, when nobody even knew the word financial literacy. One of the indirect positives effects of the surveys made during the years is that today hundreds of organizations promote financial literacy, States introduced bills supporting it, and many other initiatives have been taken. For example, the US Department of Treasury in 2002 has created the Office of Financial Education with the goal of improving financial literacy. Before 2008 they tested the financial literacy only in the American high schools, but from that year also the sample of college students had been taken into consideration. The high school survey was filled by 6,856 students and was composed by 31 questions concerning four areas: income, money management, saving and investing, spending and credit. Considering the sex of the respondents, male did the test a 2% better than female, but this is not a result for which we can worry, the small difference between sex is not relevant. From 1997 to 2008 the average had fall down by almost 10 points (57.3 percent in 1997). To avoid eventual biases in the results they selected students from classes in English or Social Studies and non Economics. Diana J Beal and Sarath B. Delpachitra in 2002 made a research for testing the financial literacy among Australian university students. The sample was formed by 837 first year students of the University of Southern Queensland (USQ) in Toowoomba, Queensland. The 36.8 percent of students were male and 63.2 percent female. The questionnaire was filled by students of different faculties divided as in the Table 1 (see Appendix A). The test consisted in 25 technical four-option multi-choice questions in five areas: financial concepts, financial markets and instruments available, financial planning, making financial analyses and decisions and insurance as a risk management tool. There were also nine extra question concerning demographic information.. 5.
(7) No one obtained the maximum score of 25, the range of the results was from 2 to 24, the mean was 13. The evidence from the model is that people that are male, have greater work experience and high income got higher scores. Overall the level of financial literacy is pretty low between Australian first year college students, and for the authors this come from the lack of financial-skills subjects in primary, secondary and high schools. They suggest to the government an educational program in all states, to educate individuals and to consequently improve the economy of the country. A similar survey was conducted in Australia by Roy Morgan Research (2003a, 2003b, 2003c) on behalf of the ANZ Bank. Roy Morgan Research (2003a, 2003b, 2003c) spotted that people with low levels of financial literacy had also low levels of educational attainment, income and employment, they were mostly young and single. In Chen and Volpe (1998) there is the evidence that lower levels of F.L. are associated to female studying non-business majors and with almost no working experience. They had a sample of 924 students at 14 colleges and related these scores to a set of demographic and socioeconomic characteristics. Race and income were not significant factors. An earlier study by Volpe, Chen and Pavlicko (1996) had similar conclusions, along with the observation that finance business majors out-performed nonfinance business majors. Most recently, Beal and Delpachitra (2003) surveyed students at an Australian regional university and found that most respondents scored reasonably well for basic financial literacy concepts. However, financial literacy was found to vary with work experience and income, and business students generally outperformed those in other disciplines, irrespective of age. In 2003 Annamaria Lusardi and Olivia S. Mitchell wrote a paper” The economic importance of financial literacy: theory and evidence” in which they also studied the financial literacy. They draw a survey to evaluate the impact of financial literacy on economic decision making with a sample composed by Americans and non. They also tried to analyze which policies could be useful to eventually fill a gap between men and woman. The survey was made using four fundamental criteria: simplicity, relevance, brevity, capacity to differentiate. The criteria was reached by using three financial literacy questions designed by Lusardi and Mitchell (2008, 2011b): 1. Suppose you had $100 in a savings account and the interest rate was 2% per year. After 5 years, how much do you think you would have in the account if you left. 6.
(8) the money to grow: [more than $102, exactly $102, less than $102? Do not know, refuse to answer.] 2. Imagine that the interest rate on your savings account was 1% per year and inflation was 2% per year. After one year, would you be able to buy: [more than, exactly the same as, or less than today with the money in this account? Do not know; refuse to answer.] 3. Do you think that the following statement is true or false? ‘Buying a single company stock usually provides a safer return than a stock mutual fund.’ [Do not know; refuse to answer.] They found that a wide range of population is financial illiterate and that sometimes there are gender differences. It seems that people with less financial literacy usually do less retirement plan, so they save less money because they are not aware of the importance of it.. 1.2 Efforts to evaluate the efficacy of individual financial literacy programs In the first section it has been analyzed the part of literacy related to the theoretical framework of the topic, while this part has the aim to focus on the policies adopted during the years to improve the level of financial literacy and their efficacy. In 2009 Huddleston and Danes studied the influence of an high school financial program in the United States. The sample was composed by 5,329 teenagers who completed a financial planning curriculum. They saw a positive influence on students following this curricula and they suggested states to include personal finance in the school program. In 2002 Conversely and Chatzky found that there is no evidence in high school Australian students exposed to financial literacy of an increase of financial literacy. Garman et. al (1999) analyzed a workplace financial education program the conclusion was that positive impacts on financial health. Apart from these, Braunstein and Welch (2002) present a generally positive appraisal of homebuyer counseling programs, savings initiatives and workplace programs in the United States, while the Consumer Bankers Association (2003) documents the growth in financial literacy programs provided by US banks, especially those covering mortgages and home ownership.. 7.
(9) From a more practical point of view there are two discussion papers that I would like to highlight. The first one is by Fox, et al. (2005) “Considerations in Financial Education Programming for Women”. They studied the efficacy of financial education programs on women. Concerning the findings, first of all, it seems that short learning programs have less efficacy from a perceiving learning point of view. Women who already attended financial courses have a lower level of perceived learning. It also emerges that a practical approach is more useful and appreciated, for example the use of case studies for explaining a topic during a financial course have more results that a simple theoretical lecture. A good element of this paper is that differently from the previous research they considered a larger sample of people (in this case of women), and not only the high school and college students sample, but all the populations. In 2008 Lyons and Neelakantan highlighted the correlation between theory and practice and how difficult it is to let practitioners understand the importance of theory. Sometimes people of the financial sector give bad advice to consumers if they don’t rely to literature. For example in the case of more risk-averse investors they suggest to hold in their portfolio an higher quantity of bonds to stocks. However, this common advice has been hard to reconcile with what theory classify as optimal. Several other examples can be made but in this dissertation I am not going to focus on it.. 8.
(10) 1.3 The New Zealand: a case of successful initiative to improve financial literacy A really interesting and real tool has been proposed in New Zealand. Starting with part of the literature related with it, Diana Crossan (2011), focuses her attention on studying successful strategies to effectively improve financial literacy. The country taken into consideration is New Zealand and the Initiatives to improve New Zealanders’ financial literacy seems to be successful, for this reason they will be reviewed here. There are five strategies which seems to be useful but here there will be a list of only four of them, firstly because the fifth is related with Maori population and is still under development, and secondly because the analysis of the Maori population is not useful for the studies I am conducting for the difficulty to replace it. The four strategies are: 1. The development of a national strategy for financial literacy. The national strategy to which it refers is the so called “KiwiSaver”. KiwiSaver is a plan introduced in 2009 that gives the opportunity to citizens to voluntarly workplace retirement saving plan. The citizen has to request to partecipate to the plan and the government gives incentives and contributions. The government gives you up to $521 each year to put in the KiwiSaver and save money for the future. People with not enough financial literacy often underestimate the importance of saving plans for the retirement and for the future. 2.. The pursuit of public–private partnerships. This kind of approach used by the Retirement Commission has the aim to reach the larger target of population, all the community. In this way the financial education is a concern of a lot of associations, organizations etc. and not only of the government. They try to find together the best tools to reach the population and to let them learn. There are several a lot of cases in which there is the proof that this approach works. Is it important to highlight that New Zealand is one of the few country that since 2005 makes surveys to test the financial literacy of adults. The questionnaires are financed by banks, government and national agencies.. 9.
(11) The third strategy is 3. The choice of a website supported by ongoing promotion In 2000 the previously cited Retirement Commission decided to develop a website http://www.sorted.org.nz in which there were two topics treated: saving and managing debt, to reach three target: young people, families and households and people at work Statistics demonstrates that in 2009 one in three New Zealanders has used the website or its resources. The website has not implemented the topic treated, for example now includes a lot of financial topics and interactive tools (more than forty). There is also a section dedicated to an insurance calculator and a “money tracker” tool, which links your bank account to help the people with the management of the money they have. Sorted is on social media, to reach also young people. They government also spent a lot of money in promoting the website, and to improve it. A the moment sorted is a mix of website, booklets, seminars, social media, and short online movies. At the moment 40 percent of New Zealander’s associate the website with helping with money matters. The name of the website updated at August 2019 is “Live sorted’’. The following image shows the main tools of the website now:. Figure 2. Main tools of the Sorted’s website http://www.sorted.org.nz. There is a section called “Blog” dedicated to the the most important topics of the financial sector, in that section it is possible to read articles of actuality or about some government’s news. The website resulted to be a good tool to reach a large part of the New Zealand population. 4. The integration of financial education into schools and tertiary education 10.
(12) The aim of this policy is to reach also the adult population. For the New Zealand’s Government it is important to teach also to not young people how to manage money. Higher age normally corresponds to higher salary, and if you have more liquidity you should know how to invest them. Is not only about retirement plan, financial literacy and financial education deals also with the use of money now. In New Zealand the government introduced courses concerning financial topics also in tertiary schools or using separated techniques of learning, like courses related to the job you are doing, or in private schools financed by the state.. 1.4 The Italian case There are really few analyses about the financial literacy in Italy. To measure the level of financial literacy of young people, the OECD has made the PISA (Program for International Student Assessment), a survey promoted every three years internationally to measure students' skills of 15-year-olds people in different countries. PISA 2012 is therefore the first comparable survey at the level of international financial literacy for young people. The objective of the PISA survey was to measure the knowledge and skills of the 15-year-old students about the educational experiences, inside or outside the school. This approach is even more important for financial literacy, for which the impact of non-formal education and social context could be greater than for the basic domains. Among the Italians, as in the other areas of PISA, young southern Italians are less prepared than northern Italians. Concerning the teaching of financial subjects in Italy, one school up to three says that they provide classes of it for 15 years old students. An evidence of the research is that students from richer families in Italy are not characterized by greater financial literacy, thing that happens in other countries. Brandimarti et al. (2017) studied the Italian financial literacy using the so called “big three questions” by Lusardi and Mitchell (2014)already cited in this dissertation in the subparagraph 1.1. The results show a clear evidence of gender differences across respondent. Women are more insecure than man, and answer to a lot of questions “ I don’t know”. Difference across regions exist. Southern regions and islands responds worst than the rest of Italy. In the south only the 16% of the sample, answer correctly to all the three questions, while in the north the 27%. Financial literacy is also age-related. Young people. 11.
(13) (18-24) and old people (over 65) are less financial literate that people in the age range of 35-55. The educational level is also a relevant element in the analysis of the same. People with higher educational level are more financial literate. They also added some questions related to the auto evaluation of their own competences to see how much they are awareness of their educational knowledge. Figure 3 shows the results of three questions related to the evaluation of: how much they are good in mathematics, how much are their competences in financial related subjects and how much they are able to manage with daily life financial activities.. Figure 3. Auto valuation of their own competences with a range from 1 to 7 of three factors, starting from the left respectively: ”How much I am good in Mathematics”, ”General competence in finance”, ”I am albe to manage daily financial activities” (sample: Italian citizens) The blue line represents men and the red line women. As it is possible to see from Figure 3 the gender difference counts a lot. In all the three questions the level of the men is higher that the female one. Brandimarti et al. (2017) made also other three questions concerning the risk and the interest rate, the three questions can be seen in the appendix A. All the questions were made in Italian. The three extra questions. 12.
(14) proposed, confirmed the results of the previous “Big three’’, with an evident gender gap. The questionnaire studies also how Italians can acquire financial knowledge and where. Italians can get it in two ways: when they are young and their parents give them a quantity of money to manage, and with the financial education at school. Despite it, they are one of the Country with the lowest financial literacy, so probably these instruments are not the right ones and a new way should be proposed.. 13.
(15) II. The level of Italian’s financial literacy: a questionnaire proposed to the Italian population As discussed in the previous chapter, the level of financial literacy of the Italian population has not been tested from a lot of researchers. Being a focal point to understand how much they can deal with financial problems, I decided to propose a set of 30 questions to investigate the level of financial literacy in a sample of Italian people. Almost all the experiments made in the world about this topic cover a sample composed by only young people, mostly high school and college students. Also in the PISA1 analysis, which includes Italy, they made the questionnaire with 15-years-old respondents.. 2.1 The design of the questionnaire The questionnaire we made is composed by a set of 30 questions (it can be seen in Appendix B) and the sample is composed by 105 people. I divided the questionnaire in three sections. The first part is composed by half of the questions (from Question 1 to Question 15) which are devoted to understand the sociodemographic characteristics of respondents including the age, sex, education, income, region in which they live etc.2 Previous works3 showed that southern regions and island are less literate than northern ones, so the question about the region was made to see it is confirmed this gap. After all these socio demographic questions, there is the section related to the technical questions that is, the core of the questionnaire (from Question 16 to Question 21). The first three questions of the technical parts are the so called “big three questions” by Lusardi and Mitchell (2011).. 1. Programme for International Student Assessment more information about every single question in subparagraph 2.3 3 See, for example, di Salvatore et al. (2018) or the PISA survey 2. 14.
(16) The three questions are about topics like inflation, purchasing power, risk diversification and I chose to insert them in the analysis because have basic concepts that should be known from everybody. I then added other three questions that cover three areas: risk volatility, relation between interest rate and bonds’ prices, relation between loan and interest. The questions are made by the Cerp4 and are more complex than the most classic questions on financial literacy but still relevant for a normal life cycle with topics like risk, market mechanisms, relationship between the duration of a mortgage and the amount of the monthly installment (Brandimarti et al., 2017). After this part there are two questions designed by the MiFID5 to make investors more aware of the risks involved before making an investment. In short, there are questions that ask the investor about its actual experience, its knowledge, its level of income and the behavior he will have if a particular financial situation happens etc. and I took from this questionnaire only two questions to see how respondents face with the risk and if there are differences between male and female. The aim of the last part of the questionnaire is to see how people deal with the financial sector, the channel they use to do it, and if they recognize the need to have an online platform to increase their financial education. Going more into details, it is asked, for example, how much they use online channels of the bank (internet banking)6 or how much they go physically to the bank. What is it expected from this question is to see how many times people are not able to do normal bank transactions and turn to bank’s employees to do them. People who go frequently to the bank and are not able to use the internet banking should be the ones less financial literate because they need the help of someone else to solve problems. Online operations are a faster and saving time solution also for people in the central age range (35-55 years old) because they work and they probably have a family, so it is useful for them to have this opportunity to not go personally to the bank, so I expect from this target a preference in using the online banking.. 4. Center for Research on Pensions and Welfare Policies Market in Financial Instruments Directive 6 I didn’t put directly the word “internet banking”, instead I specified it later, because it is supposed that in the case of people with really low financial literacy they even don’t know what it’s meant in the question. 5. 15.
(17) The last three questions (Questions 28, 29 and 30) are the most important to know if people recognizes the need to have a platform that help them to have a richer financial background and ability to understand basic economics problems and manage them. In the case they do not consider important to have a platform they have the possibility to fill a space with the text giving me suggestions and letting me know the pros of the platform and which target will not use it.. 2.2 The administration of the questionnaire The questionnaire is designed using the online platform “Survey Monkey’’, that is an internet website that enables a person to create a survey and share it, to let people complete it (Waclawski, 2012). The survey was published in the Amazon Mechanical Turk’ website7 which is an online labor market where employees (called workers) are recruited by employers (called requesters) for the execution of tasks called HITs8. The HIT is often a survey that can be proposed using simple templates or technical scripts or linking workers to external online survey tools (e.g. SurveyMonkey). Workers and requesters are anonymous and everyone has an ID provided by Amazon. Requesters post HITs that are visible only to workers who meet predefined criteria (e.g., country of residence or accuracy in previously completed tasks). When workers access the platform, they find a list of tasks sortable according to various criteria, including size of the reward and maximum time allotted for the completion. Workers can read brief descriptions and see previews of the tasks before accepting to work on them (Paolacci et al. , 2010). Amazon Mechanical Turk has more than 100,000 users from over 100 countries and is frequently used for making these kind of analyses. Once a worker has completed a task, the requester who supplied that task can pay him9. In the questionnaire I proposed, workers have 30 minutes to answer to the survey and they are paid once they complete the task and all their answers are checked. In the platform there is a link that redirect them to the Survey Monkey Platform where they can see the survey and complete it. 7. Is a platform where it is possible to publish questionnaires and receive answers. It is not free. Acronym for Human Intel- Respondent 9 Rewards are usually between $0.01, and rarely exceed $1. Translated into an hourly wage, a worker is willing to work for about $1.40 an hour (Horton & Chilton, in press). 8. 16.
(18) The fact that every worker has an ID allows to see if they answer two times. In this case the response is rejected because can generate biases in the results, giving twice weight to a single response.. 2.3 Results of the questionnaire The collection of all the answers took one week. The 90% of the responses are made by workers of the Amazon Mechanical Turk website, and the 10% by people to who I directly sent the weblink to the questionnaire. It was decided to not take more than 10% of external respondents because they could be all belonging to the same target class (e.g. As I am a student, I send the link to my friends that are students as well) and this can lead to have a result that have biases. It is also true that the 10% is not paid, so can answer more superficially. The phenomena that can affects these kinds of analyses is the sample selection bias. The sample selection bias occurs when it is used a nonrandomly selected samples to estimate behavioral relationships between variables (J. Heckman, 1979). If the selection of the sample does not occur randomly, the results obtained will not really reflect the population, because the choice of the sample did not take place correctly (Vella, 1998). In the literature appears also that the behavior of Italian respondents seems to be influenced by the survey mode, which means that they are influenced by the way a survey is carried out, e.g. the percentage of “I do not know” answers is lower with face-to-face interviews. So, proposing the same questionnaire can lead to different results between the online mode and the face to face mood, only for the way the survey is conducted (PISA survey).. 17.
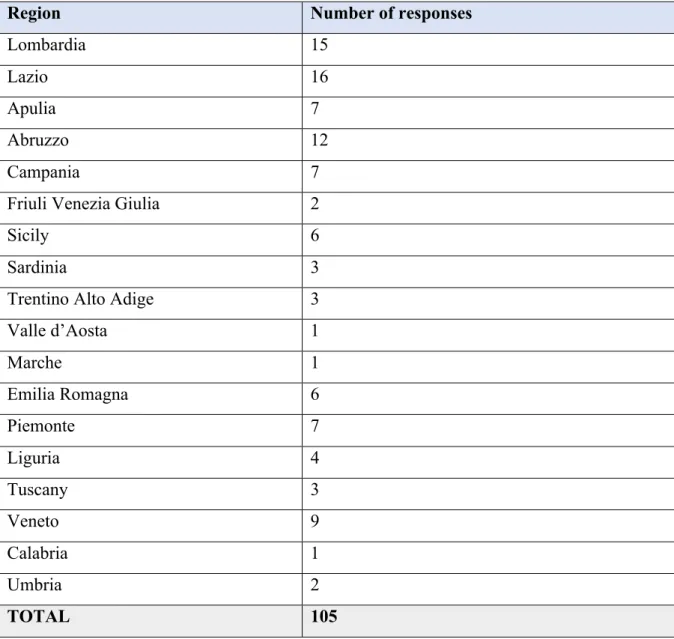
(19) 2.3.1 Socio demographic results The sample is composed by 105 people with age range 18-65 and they are 40% female and 60% male. Concerning the geographical location of respondents, we collect answers from 18 of the 20 Italian regions, which give me the possibility to see if there is connection between the geographical location and the financial literacy. The following table shows the distribution of responses through regions: Region. Number of responses. Lombardia. 15. Lazio. 16. Apulia. 7. Abruzzo. 12. Campania. 7. Friuli Venezia Giulia. 2. Sicily. 6. Sardinia. 3. Trentino Alto Adige. 3. Valle d’Aosta. 1. Marche. 1. Emilia Romagna. 6. Piemonte. 7. Liguria. 4. Tuscany. 3. Veneto. 9. Calabria. 1. Umbria. 2. TOTAL. 105 Table 1. Regional distribution of responses. 18.
(20) Having all the data about the regions makes possible to divide the sample in respondents from North, Center and South-Islands. Northern regions are Lombardia, Friuli Venezia Giulia, Trentino Alto Adige, Valle d’Aosta, Veneto, Emilia Romagna, Liguria, Piemonte and the total responses from there are 47. From the central Italy (Abruzzo, Tuscany, Lazio, Umbria, Marche) there are 34 answers, the rest of them is made by citizens living in the South (Calabria. Puglia, Sardegna, Sicily, Campania) and it counts 24. Connected to regions, the Figure 4 shows the size of municipality in which they live.. Figure 4. Size of the municipality of residence The largest part of the respondents live in a municipality with a number of inhabitants included between 15000 and 100000 (42.56%) of the total which means that they live in city relatively big compared to the Italian average of the municipalities which is 7.036 inhabitants (Istat, 2019). More than 50% of the sample have an University education (Figure 5). Only 5 people have the highest educational level presented in the question (PhD, master etc.).. 19.
(21) To better understand the results it is useful to understand how works the Italian education. The Italian educational system works in this way: primary school 5 years (children from 5 to 10 years old) and then 3 years of secondary school, and 5 years of high school or technical schools that finish at the age of 18. After the high school it is possible to go to the University.. Figure 5. Educational level It is not only important to know which is the educational level of the sample, but also if they have knowledge in economics subject. The majority of the sample did not experienced any study in economics. Only 26 people, who correspond to the 24.76% of the sample answered “yes” to the question, which means that the other part has no academic knowledge about finance related subjects. The results show that having previous experiences in finance related subjects does not lead to better results in the questionnaire.. 20.
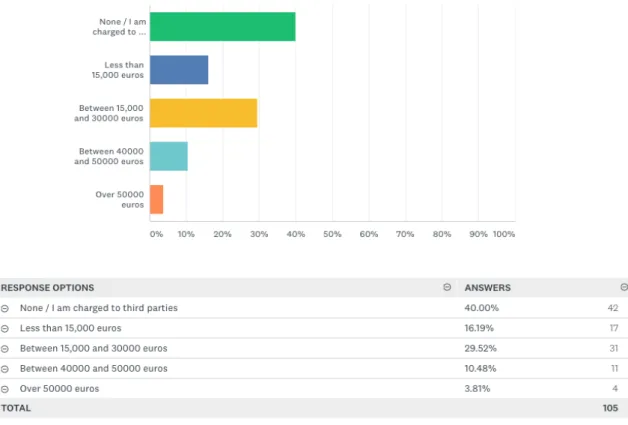
(22) It is important also to know the civil status of the respondents because can influence their ability to manage financial literacy. For instance, in the case of women, during the 2018 in Italy only the 49.5% of them had a job, against the 67.6% of men (Istat10 survey on the employment rate)11. The gross income of respondents is indicated in Figure 6 which shows how much they earn in a year and the majority of the sample is in charge of third parties. Being in charge of third parties means that they do not have income so they probably have no money to manage and they can consider unuseful to have financial literacy. To know their wealth, we do not only ask directly how much they earn per year, but indirectly try to elicit it. Indirectly means that we ask also for their lifestyle with questions 9 and 10. Question 9 asks if they have their own car and in this case the sample is it split in more or less two perfect parts. There is not a big prevalence of one answer to another because the 46.67% answered yes and the 53.33% not. The following question is about how much they go on holidays each year, and on average they go on holidays 1.6 times per year. In this case the overall average of the sample is it not extremely useful because what I wanted to see is if they lie about their income. The 78,57% of the people who declared to not have an income do not have their own car, while the 21,43% declared to have it which seems a bit weird do to the fact that they do not have an income. This result could be attributed to the fact that they inherited it or someone else bought the car for them.. 10 11. Italian National Institute of Statistics Which means that they probably don’t have their own money to manage 21.
(23) Figure 6. Annual gross income Concerning the times that people without income go on holidays, there is the evidence that they go less than the total sample with an amount of 1.24 times for a year against the average of the sample that is 1.61which can let me think that they are not lying about their income. Accordingly with Eurostat and OECD (see Figure 9) Italians are really good in saving money, Italy is one of the Country with the highest saving rate in the world. This is the reason why I asked about the percentage of savings and about how much they invest in financial products and tangible fixed assets (e.g. If they bought their own home or for example they rented it).. 22.
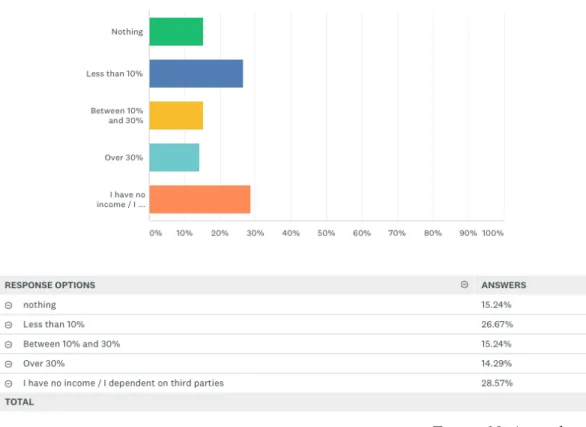
(24) Figure 9. Saving rates between 1995-2007 in Germany, France, the United Kingdom and Italy Due to the fact that the 40% of the sample does not have an income, in Figure 10 it is possible to see that the highest percentage of answers is attributed to the option “I have no income / I dependent on third parties”, so most of the sample does not save because does not have money to save.. 23.
(25) Figure 10. Annual savings People who answered “more than 30%”, so that save more than 30% of their income, are the ones with wages higher than 15000 euros and only 4 of them have an income lower than 15000 euros as showed in the following Figure. The person who answered “nothing/I am in charge of someone else” and then said to save more than 30% has probably misunderstood the question, because without having an income is not possible to save. The result of this question shows that in this sample savings are positively correlated with income, higher is the income, higher are the savings.. 24.
(26) Figure 11. Distribution of income between people who save more than 30% annually It is then asked in Question 13 how much of their savings it is invested in financial products, specifying what is meant by “financial products”. Only the 23.8% of the sample invest on it, with different amount of money, different percentages of savings, but they invest on it, so it is supposed that they know something about finance or about how to deal with money, in the case they use intermediaries to buy financial products. Results of Question 14 shows that 85% of the sample does not have medium-long term debts, while only 16 people admitted to have it, this depend in my opinion from the fact that most of the sample does not have income and is a student, so is in charge to third parties and do not have the need to get a mortgage. The part that follows now consists in more technical questions and aims to analyze the level of financial literacy of the sample.. 25.
(27) 2.3.2 The level of financial literacy of the sample As it is written at the beginning of the chapter, the questions related to the financial literacy of the sample are six. The first one is the Question 16: “Suppose you have € 100 in your current account in a savings account and the interest rate was 2% per year. After 5 years, how much do you think you would have in the account if you left the money to grow? More than €102, Exactly €102, Less than €102, Do not know.” Results showed that the 91.43% of the sample responded correctly, while one person answered “Exactly €102”, five people “Less than €102” and three “I do not know”. It can be said that the sample is almost completely literate on this topic. This result is in line with the findings of Lusardi and Michell (2014). The second question (Question 17) is about the topic of inflation and purchasing power and asks “Imagine that the interest rate on your savings account was 1% per year and inflation was 2% per year. After 1 year, how much would you be able to buy with the money in this account? More than today, exactly the same, less than today, do not know”. The majority of people (68.57% of the sample) chose the right answer (see Figure 12). Respondents are financial literate in the case of inflation and purchasing power.. 26.
(28) Figure 12. Results of the question about inflation and purchasing power Question 18 is useful to know if respondents understand the diversification of the risk and it is intrinsic to also know the difference between the two elements in the question: “Please tell me whether this statement is true or false: “Buying a single company’s stock usually provides a safer return than a stock mutual fund. True, False, Do not know.”. The 65.71% of the sample answered correctly “false”, while the 30.48% did not know how to answer and the 3.81% though it was true. Only the 65.51% knew the topic of risk diversification as a strategy used by investors to manage risk by spreading money across different assets and sectors. There are less correct answer in this question compared to the previous two.. 27.
(29) Figure 13. Results of the question about the diversification of the risk There are other three questions covering three areas: risk volatility, relation between interest rate and bonds’ prices, relation between loan and interest. The first one (Question 19) aims to see if people understand the risk, through asking which is the riskiest title between two having the same expected value, but different variability (volatility). Results show that only the 12.38% of the sample does not know the topic of risk, while the 87.62% answered correctly (see Figure 14). It is a really high percentage who shows that the sample is literate on the topic and knows the risk.. 28.
(30) Figure 14. Results of the question about the risk and the volatility Question 20 aims to see if people know market mechanisms such as the ratio between the change in the interest rate and the price of bonds; Between all the six questions concerning the financial literacy (from Question 16 to Question 21) this is the one with the highest rate of error. As it is possible to see from Figure 15 only the 14.29% answered correctly, which corresponds to 15 people up to 105. The highest percentage of answers is in the option “I do not know”, with a 40% of the sample that admit to not know what does it means. In my opinion this is a topic more complicated that requires previous knowledge, not attributed to daily life operations, so the majority of the sample did not know what to answer because they even do not know what was the question about. People who tried to answer without knowing the correct response are mostly men, who confirm the previous findings of other papers like Huston (2010).. 29.
(31) Figure 15. Results of question 20 about market mechanisms Question 21 has the goal to look at the relationship between the duration of a mortgage and the amount of the monthly installment (Brandimarti et al. , 2017) . The question is: “A 15-year mortgage normally requires higher monthly payments than a 30-year mortgage of the same amount, but the total interest paid for the total duration of the loan will be lower”, the correct answer is “True” and the 75.24% answered correctly, the 24.76% answered “False”, so it is possible to lead to the conclusion that most of the sample knows the relationship between the duration of a mortgage and the amount of the monthly installment (see Figure 16).. 30.
(32) Figure 16. Results of question 21 about the relationship between the duration of a mortgage and the amount of the monthly installment At this point there are the two questions about the risk tolerance (Questions 22 and 23) designed by the MiFID12 . Question 22 is about the reaction the respondent will have in the case of negative market movements and examines how the potential customer would react to a market movement that goes against his expectations. The options are: ”I disinvest immediately because I am not willing to accept further losses; I keep the investment and wait for it to recover value; I wait for a gain in value compared to the investment; I increase my investment to buy more favorable quotes; do not know how to answer”. The 15.24% of the sample does not know how to answer, while the majority of the sample ( the 50.48% ) is neutral about it (see Figure 17). Usually women are less risk takers than men, and this is confirmed in this study. Women tend to respond more frequently than mem “I do not know” or to choose options with less risk. 12. Market in Financial Instruments Directive 31.
(33) Figure 17. Results of the risk tolerance question 22 In the same line is the Question 23 that asks: “How much do you agree with this statement: I believe it is more important to make safe and guaranteed return investments, rather than facing risks in the hope of obtaining the highest returns?". Depending on how they respond can be seen the level of risk propension they have. (see Figure 18). Almost all the sample is risk averse because they “totally agree” or “almost agree” to the statement. Only a small part of the sample disagree or do not know, respectively the 9.52% and the 4.76%.. 32.
(34) Figure 18. Risk awareness of the respondents. Questions from the number 24 to 30 are going to be reviewed in the third chapter because are related to the possible solution of the problem.. 33.
(35) 2.4 Correlations between results: main evidences In this section we focus on people who answered correctly at least to the three “big questions” by Lusardi and Mitchell, 2014 (Questions 16,17,18). Let’s call them “literate people”. Only 50 up to 105 provide a correct answer to those questions, who corresponds to the 47,62% of the sample. Respondents are 70% male, which means that men know more than women. According to the results in Lusardi and Mitchell (2014) and PISA (2015)13, also in our sample a gender gap emerges. . Gender differences in financial literacy in Italy may be attributed to a combination of factors, such as differences in opportunities for learning, different interest in financial matters between male and female, socioeconomic backgrounds (Bottazzi and Lusardi, 2016). Literate people have a high level of education as it is possible to see in Figure 19, the 68% of the sample has an University degree and the 2% an higher level of education (master, PhD.).. Figure 19. Level of education of the financial literate sample 13. Where Italy is the only country where boys outperform girls by 11 score points. 34.
(36) They are on average 31 years old and the distribution of the age can be seen in Figure 20. The 32% of people who answered correctly studied economics while the 68% did not. I may conclude that there is no evidence for correlations between previous studies in economics and better performances in the results.. Figure 20. Age of the financial literate sample. 35.
(37) Figure 21. Gross income. To sum up, according to our findings, literate people are mainly young people who are for the 70% male and are students with a University education. Only five people answered correctly to all the six financial literacy questions (from Question 16 to Question 21). The sample is composed by people with age of respectively 24, 22, 49, 43, 41, and 60% are male. Regarding location, two of them are from the North, two from the Center and 1 from Sicily. They live in cities with more than 15000 inhabitants. The 80% of the respondents who answered correctly to all the 6 questions have a University education against the 20% that completed the secondary school. Concerning previous economics studies or education, the 60% did not have it, so it can be said that in this sample previous education in economics related subjects does not lead to a better performance in the results.. 36.
(38) In both analyses related to financial literacy people, male performed better than women and that previous studies in finance related subjects do not lead to more financial literate people, only a small percentage of both samples said to have studied economics. It incises, instead, the educational level: almost all the people in both samples have University education or more, only a small part of respondents have lower educational level (secondary school). This finding is not obvious, due to the fact that almost all the total sample of 105 people is composed by an almost 40% of people who do not have University education. 2.5 ANOVA test In order to confirm the previous findings, we will use the ANOVA test. One of the multiple definitions of ANOVA17 that we can find in the extensive multivariate analysis of literature is: “Anova is a set of techniques included in the inferential statistics that allows to compare two or more groups of data”. I analyzed three blocks of questions: first the correlations of some factors and the first three answers of financial education, second the question with the greatest percentage of wrong answers to see what was influencing it, and third the analysis of the sociodemographic factors that correlate all six questions. Starting from the analysis of the answers of the three big questions by Lusardi and Mitchell (Questions 16,17,18) I thought it appropriate to check the correlation between the three answers to the questions, the sex and the education.. Table 2. Anova test on Question 16,17,18 and sex and education As it is possible to see from the previous table, the sex is significant while the education is not. To double check if the two variables are really significant, I tested the two variables singularly and the results were the same, the sex is significant with p value= 0.00215**. 37.
(39) I did the same with the variable education that results to not be statistically significant with a p value 0.282. So it may be concluded that for the three big questions the gender matters while the education does not. I did the same analysis with the variables region and age and income and they are not significant, so they do not influence respondents’ answers. I considered interesting to check which are the relevant factors that influence positive answers to Question 20 which is the one with the highest percentage of incorrect answers (only almost the 15% of the sample answered correctly). Question 20 resulted to be significantly correlated with income14 with a p value 0.0209< α=0.05 and with the age with p value 0.0175 < α=0.05. Is not correlated with education and sex. I then analyzed the factors that could affect the correctness of all the six financial literacy questions (from question 16 to 21). The only factor that really influence it, is the regional position of respondents with a p value 0.0371 < α=0.05, while the sex is significant but less significant than the regional position, with a p value of 0.069. Age and income resulted to not to be statistically significant. This shows that people living in the northern regions answered better than people from the south and confirms the findings of the previous literature of Lusardi and Mitchell (2014). It can be concluded that in the case of the three big questions there is a gender gap and the sex is significant, while considering the all set of six financial literacy questions besides the sex is also relevant the regional positions of respondents. As said before the results obtained here are the same of the literature15. There is also the evidence that having studied previously finance related subjects does not affect the answers to the financial literacy questions. To both improve and generalize the results, the same analysis should be performed with a larger sample.. 14. The variable income has been encoded giving to each answer a number, for example at the option “I do not have income/ I am in charge of third parties” I gave the number 1 etc. 15 Lusardi and Mitchell, 2014 or PISA, 2015 38.
(40) III. Possible solutions to increase Italian financial literacy At this point it is clear, after the literature review and the questionnaire, that the Italian financial literacy is one of the lowest in the European union, only Portugal and Romania have lower literacy rates compared with Italy (Klapper et al., 2013) This chapter is dedicated to new proposals to increase the Italian financial literacy level. This will be done analyzing the last block of answers of the questionnaire since they are aimed to understand Italian preferences in terms of habits and online services.. 3.1 Italians’ platforms preferences: results from the questionnaire To know which are the online banking habits of the respondents I designed Question 24 and 25. I considered important for my analysis to ask about the use of the online banking because I thought it would be the most widespread “financial platform” that a large number of people use and can give an idea of their basic experience with the online financial world16. My aim is to suggest an online solution to increase financial literacy, but if people even do not use the online banking and are not in step with the times does not make sense to propose it. People who use frequently the internet banking should show an higher financial literacy (because if they deal with financial instruments or in general money, they should have a basic financial education) and a propensity to eventually prefer online channels to get financial skills. Question 24 is about how frequently they use online banking and the results show that they use it a lot. The 37,14% uses online banking every week, the 38,10% more than one time in a month, the 12,38% less than one time in a month and another 12,38% never used it (see Figure 23). This high use of online channels may depend on the medium age of the sample I analyzed, which is composed by almost all young people. It is also true that nowadays people have less and less time to spend, and they choose the shortest way to do things. Since the mid-1990 there has been a shift in banking delivery activities rather than face to face bank operations (T. Pikkarainen, 2004).. 16. even if they only do basic operations 39.
(41) Figure 23. Use of the online banking Question 25 make the opposite query by asking how much they physically go to the bank. The majority of the sample goes to the bank only when there are no other options and they cannot do the operation online (61.9% of the sample). The 18.10% of the respondents never goes to the bank physically, while the 11.43% goes less than one time in a month, and the 8.57% more than one time in a month. It is interesting to see that the 0% of the sample goes to the bank every week. I can deduce that this sample prefer online banking operations rather than the physical bank (see Figure 24). I suppose that people who use frequently the internet banking go to the bank only for operations like deposits of money or consultations with bank consultants, so the fact that they use the online and they also go physically to the bank does make them less inclined to prefer online channels.. 40.
(42) Figure 24. Use of the bank Question 26 concern how frequently people use social media (Facebook, Instagram etc.) to read articles and be informed about financial news. The goal of the question is to understand how and if, nowadays people get the information through different platforms not directly related with finance (see Figure 25). For example, a lot of journals have a Facebook page in which they publish articles with the link that directly redirect to the journal’s website, so some people can prefer to use this kind of approach to acquire information. In general, people who prefer to use social media or social apps for reading news are the ones more inclined to use every day the telephone and to be mobile friendly (e.g. Young people).. Figure 25. Use of social media to read information. 41.
(43) Question 27 goes more in deep asking how much they use websites or specific mobile apps to read information, because there can be the possibility of people that rely only to a specific website or app. The majority of the sample does not use social media to read information while only the 12,38% use it (see Figure 26).. Figure 26. How much people use social media to read information The last three questions (Questions 28,29 and 30) are the most important to know if the population recognizes the need to have a platform that help them to have a richer financial background and ability to understand basic economics problems. We then arrive to Question 28, which I consider the most important question of the survey. It is asked: “How useful do you think an online financial education platform is?”. More than the 90% of the sample consider important to have an online platform (see Figure 27). From these results it is evidenced the need for people to get information related to the financial world. They know that they need help and that their knowledge are not enough.. 42.
(44) Figure 27. Results of Question 28 on a financial education platform If they answer “quite important” or “important” to Question 28 they are redirected to Question 29 in which I asked: “Which of these online financial education platforms would you use more?”. There are five options: website, information through social media, specific app, video on Youtube, other. The selected sample showed a preference of 37.14% on the use of a website. Second in position is the answer D, related to financial education courses on Youtube (Figure 28). The 23.81% of the sample would prefer to be educated through an app dedicated to financial education, while the 10.48% would prefer the use of social media. In the option "other" it has been suggested to use a website called “Coursera”17 that offers online courses in physics, engineering, humanities, medicine, biology, social sciences, mathematics, business, computer science, and other subjects.. 17. Coursera is a for-profit educational technology company founded by two professors of the from Stanford University. The platform offers massive open online courses working with universities to make some of their courses available online. 43.
(45) Figure 28. Preferences on the online platform to use People are redirected to Question 30 if they answer to Question 28 “not very important or, I wouldn't consult it” in which they have to specify why, filling a space with a motivation. The majority of the answers I received are related to the fact that they are not interested in finance related topics or they already use other channels (like blogs or telegram), so they would not have curiosity to consult instruments to increase their knowledge. Only few answers were different, but they are not relevant for this analysis because they can’t be clustered into groups.. 44.
(46) 3.2. A website to increase Italians’ financial literacy Previous studies already analyzed different policies to increase financial literacy18. In 2009 Huddleston and Danes studied the influence of a high school financial program in the United States and they saw a positive I.D. on students following this curriculum which means that in this case there is a positive relation between education and financial literacy. The opposite happens in Australia where Conversely and Chatzky (2002) found that there is no evidence in high school Australian students exposed to financial literacy of an increase of it. High school financial programs are not the only tool experimented during the years: Garman et al. (1999) analyzed a financial education program in a workplace, showing that there was a positive impact on financial literacy level. Concerning the Italian’s strategies and policies adopted during the years, it can be said that with delay compared with the other European countries, in 2017 Italy started to do something to increase the financial literacy of the population. In that year was establish a committee for the financial education, and its first step was to create a national portal about financial education, insurance and social security: quellocheconta.gov.it.. 18. See chapter 1 subparagraph 1.2 45.
(47) The website was opened in April 2018 after a period of experimentation and the home page of the portal is presented in this way and is really similar to the Sorted website (http://www.sorted.org.nz) in New Zealand:. Figure 29. Home page of the Italian portal for financial education (quellocheconta.gov.it) In the website it is possible to do different operations such as to read news, have a look on the financial education events around the place where you live, have information etc. There is a section dedicated to “moments that count” which includes the main advice of how to behave when you do certain things fundamental in your file cycle as buying an house or perceive the first salary (see Figure 30).. 46.
(48) Figure 30. Main tools of the Italian Government website on financial education (quellocheconta.gov.it). The website is not the only tool created by the government. The website is connected with the main social media: Instagram, Facebook and Twitter and there is also a Youtube channel. The problem is that the government didn’t do a lot of advertising about it, and the social media pages are followed by really few people (on Instagram the page has only 350 followers). To have only 350 people following the Instagram page means that the government is not reaching the population and the strategy doesn’t create benefits. The same situation can be seen in the Youtube channel, there are video with 40 views in total. Another strategy that the government adopted is to set the month of financial education, who took place for the first time in October 2018, and will take place for the second time this year (October 2019). In 2018 the month of financial education was held in 120 cities with 350 events in total. The problem was that they did not advertise it and there was no much affluence to the events. The committee wants also to reach people through press, collaborating with different newspapers, like “Il Sole 24 ore”19 or “Donna Moderna” and “Oggi”20 which are read mostly by women, so they have a specific target.. 19 20. An Italian economics journal Trough specific spaces in the journal dedicated to financial education 47.
(49) 3.3 A proposal: an interactive mobile app The questionnaire showed that respondents consider important the creation of a tool to increase financial literacy. Analyzing the answers it is easy to see from question 29 which would be their preferred way to use it. Due to the fact that respondents use really often online banking services rather than face to face operations at the bank, is underlying that they are able to use mobile devices21. From the questionnaire the respondents evidenced a preference for a web site or for Youtube videos so I would suggest to keep going with these tools but to implement communication strategies to promote them through adverting in the national tv or whatever, but at least to make it used by people. Italians don’t know about the existence of the “Quello che conta” web site neither than the Instagram or Facebook page, because the government didn’t advertise it. My proposal is to create an interactive platform to supports the recently created government’ website. The platform could be a mix between the three main preferences of respondents, they prefer in order: website, financial education courses on Youtube and a specific app. On this basis, my idea is to suggest an app connected to the national website, where there are more interactive tools such as questionnaires with rewards, online video made by experts of a sector, courses by Coursera. The app has to be really easy to understand and able to reach the largest past of the population possible. It can be thought to do daily quiz with a daily review for the fast and best respondent. The government has to advertise it and to plan in the public expenses a part of money dedicated to the implementation of the app because the social media and the website are not successful till now. National programs in schools in my opinion are too far from what can be reached in the short period. There isn’t a subject related to financial education in all the high school so to insert a course depends only to the school and the education is not homogeneous in all the country because not all the students can follow it. 21. it is also implied to the fact that they answered to an online questionnaire so they know how to access to the online world 48.
(50) Advertising the website through the app can push people to download it for the reward and to follow courses on the Youtube page or directly in the app to answer better to the questions and try to win. The actual website needs to be improved and advertised because at the moment is not considered by Italian a reliable source of information like for example the “Sorted” web site in New Zealand.. 49.
(51) Conclusion The dissertation aimed to identify the Italian financial literacy and to propose a tool to increase it due to its low level. This has been done starting from the literature in the first chapter, going more in deep in the second one, and proposing an interactive app in the third one. The work has been supported from a survey administrated to an Italian sample to test their financial literacy level and see if they recognize the need to have a tool to increase it. Based on the results of the quantitative analysis made using the ANOVA test it can be concluded that in this sample there is correlations between financial literacy of the sample and their sex and regional position. People from the north are more financial literate and men are more financial literate than women. It emerged also that people prefer to use online banking services than going personally to the bank, that shows an inclination to the online word. They find it important to have a platform to increase their financial literacy. Thanks to the website created by the Italian Government in 201822 to increase the financial literacy in Italy, I proposed a tool to support it, due to the fact that the website it self and the social platform connected to it are not consulted by Italians and they still do not rely on it. The tool consists on an online app connected to the website with interactive content and reliable material. The app has not been developed but can be a good start for future research and works.. 22. quellocheconta.gov.it 50.
(52) APPENDIX A Figure 1. Number of respondents for faculty. Source: Personal reworking. Questions related to the subparagraph 1.4: The right answer is indicated with an asterisk * §. Question on the risk volatility. Consider two titles, A and B. Their performance is determined by flipping a coin. Title A offers a return of 20 percent if it comes out of head or 0 percent if it comes out cross. Title B offers a return 12 percent if heads or 8 percent if crosses. Can you indicate which of the following statements in your opinion is true? • Title A (which makes 20 percent if heads or 0 percent if crosses) is more risky than the title B (which makes 12 percent if heads or 8 percent if cross comes out) * • Title B (which makes 12 percent if heads or 8 percent if crosses) is more risky than title A (which makes 20 percent if heads or 0 percent if cross comes out) 51.
(53) §. Question on the relationship between interest rate and the price of bonds. When interest rates rise, what usually happens to bond prices? • Go up • Go Down * • They remain the same • There is no relationship between interest rates and bond prices • I do not know §. Application on mortgage and interest. A 15-year mortgage normally requires higher monthly payments than a 30-year mortgage same amount, but the total interest paid for the total duration of the loan will be lower. • True * • False. 52.
(54) APPENDIX B Survey on the level of financial literacy in Italy 1. Age (open question) 2. Sex o M o F. 3. In which region are you resident? (open question). 4. What is the size of your municipality of residence? o Less than 3000 inhabitants o From 3000 to 15000 inhabitants o From 15000 to 100000 inhabitants o From 100000 to 1000000 inhabitants o Over 1000000 inhabitants. 5. What is your educational level? o No formal education o Complete primary school cycle (primary school) o Complete cycle of upper secondary school (middle school) o Complete secondary school level second level (high school) o University education o other (master, research doctorate, etc.). 6. Does your education include courses of study in the economic field? (Eg you attended an accounting high school, you have a degree in economics, etc.) o Yes o No. 53.
(55) 7. What is your civil status? o Single o Engaged o Cohabitee o Married o Separated or divorced o Widow 8. What is your job? o Student o Employee o Self employed o Other (specify). 9. Do you own a car? o Yes o No. 10. How many times do you go on holidays in a year? (open question). 11.Which annual gross income does you belong to? o None/ I am charged to third parties o Less than 15,000 euros o Between 15,000 and 30000 euros o Between 40000 and 50000 euros o. Over 50000 euros. 54.
(56) 12. In percentage terms, how much do you save of your net annual income? o Nothing o Less than 10% o Between 10% and 30% o Over 30% o I have no income / I dependent on third parties. 13. What percentage of your savings invest in financial products? (shares and bonds, government bonds, mutual funds, derivative financial instruments) o Don’t know o I do not invest in financial products o Less than 10% o 10% to 30% o More than 30%. 14. How much are your medium-long term debts (over three years)? (eg mortgage) o I have no medium - long term debts o Less than 30000 euros o Between 30000 and 50000 euros o More than 50000 euros. 15. How much are your investments in real estate? o I have not invested in real estate o Home ownership o Home owned and second home o Other (specify). 55.
(57) 16. Suppose you have € 100 in your current account, which gives you 2 percent interest per year. There are no taxes or costs of any kind on your account. If you never withdraw for five years, how much do you think will accumulate on the account? o More than € 102 o Exactly € 102 o Less than € 102 o I do not know. 17. Imagine that the interest rate on your current account is 1 percent and that the inflation rate for the current year is 2 percent. After a year, how much do you think you will be able to buy with the money accumulated on the account? o More than today o Exactly like today o Less than today o I do not know. 18. Indicate whether the following statement is true or false: "Purchasing the shares of a single company usually guarantees a more secure return than an equity fund". o True o False o. I don’t know. 19. Consider two titles, A and B. Their performance is determined by flipping a coin. Title A offers a return of 20 percent if it comes out of head or 0 percent if a cross comes out. Title B offers a return of 12 percent if it comes out of head or 8 percent if crosses out. Can you indicate which of the following statements in your opinion is true? o Title A (which makes 20 percent if it comes out head or 0 percent if cross comes out) is more risky than Title B (which makes 12 percent if it comes out or 8 percent if cross comes out) o. Title B (which makes 12 percent if it comes out head or 8 percent if cross comes out) is more risky than Title A (which makes 20 percent if it comes out or 0 percent if cross comes out). 56.
(58) 20. When interest rates increase, what usually happens to bond prices? o Increase o Go down o They remain the same o There is no relationship between interest rates and bond prices o I don’t know. 21. A 15-year loan normally requires higher monthly payments than a 30-year loan of the same amount, but the total interest paid for the total duration of the loan will be lower. o True o. False. 22. What would be your reaction to negative market movements if you had financial products? o I would immediately divest because I am not willing to accept further losses o I would keep the investment waiting for a recovery of value o I await a gain in value with respect to investment o I increase my investment to buy more favorable quotes o I don’t know 23. How much do you agree with this statement? "I believe it is more important to make safe and guaranteed return investments, rather than facing risks in the hope of obtaining the highest returns" o I totally agree o I almost agree o I disagree o. Don’t know. 57.
(59) 24. How frequently do you use online banking channels (internet banking)? o Never o Less than once a month o More than once a month o Every week. 25. How often do you personally go to the bank? o Never o Only when it is indispensable or I cannot use internet banking to carry out the transaction o Less than once a month o More than once a month o Every week. 26. How much do you use social media (Facebook, Instagram, Youtube etc.) to read articles and find out about economic issues? o A lot o Quite a lot o Never 27. How much do you use economic information sites? (Web sites, specific apps) o A lot o Quite a lot o Never 28. How useful do you think an online financial education platform is? o A lot o Quite a lot o Not really important o I wouldn't consult it. 58.
(60) 29. If you answered '' A lot '' or '' quite a lot '' to the previous question: Which of these online financial education platforms would you use more? o A specific app o A website o Information on social media (e.g. a Facebook page) o Financial education courses on Youtube o Other (specify). 30. If you answered '' not really important '' or '' I would not consult it'' on question 28: why would you not consult it? (Open question) Enter the code 34173 to complete the survey. 59.
Figure


+7


Documento similar
It is against this backdrop that the study is enthralled in investigating the financial factors (access to credit, financial literacy and tax) that affect SMEs performance using
As illustrated in Table 2, financial inclusion indicators vary to a great extent across the coun- tries in the sample, while women are less likely to have an account with
As explained above, a multilevel simultaneous equation model (MSiEM) is estimated to allow for the consideration of: a) the possible simultaneous production of
The purpose of this investigation is determine the impact that the application of the International Financial Information Standard 16 Leases (IFRS 16) will have on
For people with rheumatoid arthritis, the costs of care nearly double if they have depression,14 and for asthma the increase is 140%.12 People with depression also face a higher
We advance the hypothesis that fraudulent behaviours by finan- cial institutions are associated with substantial physical and mental health problems in the affected populations.
Financial decision-making should be based on the level of economic development, guided by the goal of macroeconomic development, and ensure the realization of
If thinking is high and emotions become salient after thinking, they can lead people to rely or not rely on the thoughts generated either because the emotion leads people to like
