TítuloCapillary zone electrophoresis for analysis of phytochelatins and other thiol peptides in complex biological samples derivatized with monobromobimane
21
0
0
Texto completo
(2) 150 mM phosphate buffer at pH 1.60. Separation efficiency was improved when 2.5% v/v methanol was added to the background electrolyte. The electrophoretic conditions were 13 kV and capillary dimensions with 30 cm length from the inlet to the detector (38 cm total length) and 50 µm inner diameter. The injection was by pressure at 50 mbar for 17 s. Under these conditions, the separation between desglycyl-peptides and phytochelatins was also achieved. We also describe the optimum conditions for the derivatization of biological samples with mBrB to increase electrophoretic sensitivity and number of theoretical plates. The improved method was shown to be simple, reproducible, selective, and accurate in measuring thiol peptides in complex biological samples, the detection limit being 2.5 µM glutathione at a wavelength of 390 nm.. Keywords: Capillary zone electrophoresis; Glutathione; Monobromobimane; Phytochelatins; Thiols. 1 INTRODUCTION Organisms have developed different mechanisms for metal tolerance. Phytochelatins or class III metallothioneins are molecules that appear when certain organisms, such as plants, fungi, and algae, are exposed to metals [1–3]. Phytochelatins are oligo- and polypeptides with the amino acid structure (γ-Glu-Cys)n-Gly, where n = 2–11. Some species, instead of the amino acid Gly, present another amino acid as Glu, Ser, or β-Ala. In other species, the terminal amino acid is not present [4]. The functions of these peptides are detoxification of metals, binding these elements to the thiol group of Cys in an innocuous form, or participate in the mechanisms of regulation of these elements in biological systems [5]. However, these functions are not fully understood. To better understand the role of these molecules in the metabolism of metals in these organisms, it is essential to analyze them quickly and efficiently. The classical technique for analysis of phytochelatins is reverse-phase HPLC. The relatively strong absorption of peptides in the short wavelength UV region (200–220 nm) provides a universal detection method, but there is a marked lack of selectivity. Therefore, additional steps to purify the sample prior to analysis are needed. However, the.
(3) derivatization with a specific chromogenic or fluorogenic compound provides better selectivity in the detection process. In the case of phytochelatins, derivatization with monobromobimane (mBrB) prior to separation with HPLC [6–8] or post-column derivatization with Ellman’s reagent [3, 9–11] provides the desired selectivity for the analysis of these molecules. These compounds react with the thiol group to form labeled molecules that allow their detection at a specific wavelength or by fluorescence. Under these conditions, these peptides can be analyzed without the need to first purify the biological sample. Therefore, the general development, characterization, and application of procedures involving mBrB to label thiol compounds have been reported previously in HPLC analysis [12–14]. HPLC methodology was used in the early characterization of phytochelatin peptides and is still in use for the detection and quantification of these compounds. Capillary zone electrophoresis (CZE) is the most universal and most frequently used electroseparation technique for qualitative and quantitative analysis of peptides [15–17]. For this reason, this technique is also a useful alternative for the analysis of peptides containing thiol groups. CZE offers several advantages over HPLC, including simple instrumentation, small amounts of reagents, the ability to process very small samples, and shorter run times. In the last years, new applications of CZE to the analysis of peptides have been published, but few papers report the successful separation of phytochelatins by CZE. Previous works [18, 19] reported the detection of these peptides without any previous thiol labeling. As in HPLC, intrinsic to the determination of underivatized thiols is an inherent lack of selectivity. This is the reason why previous purification steps by different techniques, such as gel-filtration chromatography, are also required for phytochelatin detection. These steps considerably prolong the total analysis time. This problem is alleviated by means of derivatization with different specific reagents before being separated by CZE. Sutter et al. [20] used on-line derivatization of thiol-peptides with N-ethylmaleimide. Kubota et al. [21] used 4aminosulfonyl-7-fluoro-2,1,3-benzoxadiazole for labeling phytochelatins prior to the separation of these molecules by CZE. Mounicou et al. [22] developed another alternative technique for the determination of phytochelatins without derivatization by capillary electrophoresis. In the work of these authors, capillary electrophoresis was coupled with electrospray-mass spectrometry, which allows a structural characterization of these molecules..
(4) Probably, mBrB is one of the most used compounds for labeling phytochelatins and other thiols, but to date there exist no data on its use to label phytochelatins prior to the separation by a CZE technique. The mBrB derivatization is sensitive and specific [23]. Taking into account the advantage of the specificity of mBrB for molecules with thiol groups and the higher number of theoretical plates of capillary electrophoresis, these can be combined to develop a procedure that allows a rapid and adequate analysis of phytochelatins and other thiol molecules. The aim of this work was to develop a simple and sensitive method to detect and measure phytochelatins and other thiol-containing molecules derivatized with mBrB in crude extracts of biological samples using CZE.. 2 MATERIALS AND METHODS 2.1 Chemicals and reagents All chemicals used were of the highest purity available. Ortho-phosphoric acid (H3PO4), citric acid (C6H8O7), boric acid (H3BO3), hydrochloric acid (HCl), sodium hydroxide (NaOH), 5-sulfosalicylic acid 2-hydrate (C7H6O6·2H2O), mBrB (C10H11N2O2Br), 2,2,2,trifluoroethanol (C2H3F3O), sodiumborohydride (NaBH4), 2-mercaptoethanol(C2H6OS), diethylenetriaminepentaacetic acid anhydride (DTPA) (C14H19N3O8), Cys (C3H7NO2S), γ-Glu-Cys (C8H14N2O5S), and glutathione (GSH) (C10H17N3O6S) were purchased from Sigma (St. Louis, MO, USA). HPLC-grade acetonitrile and methanol were from Scharlau (Scharlau Chemie, Barcelona, Spain). Filters were obtained from Millipore (Millipore Ibérica, Madrid, Spain). The different reagents and buffers were prepared with water obtained from a Milli-Q system. Phytochelatin standards were a kind gift from Dr. Zenk (University of Munich). 2.2 Capillary electrophoresis conditions The electrophoretic analysis was performed in an HP3DCE Capillary Electrophoresis System (Agilent Technologies, Waldbronn, Germany) equipped with a photodiode array detector. The electropherograms were analyzed with the Agilent ChemStation Software (Agilent Technologies). Detection was set at a wavelength of 390 nm. The capillary temperature was maintained at 25ºC. Uncoated fusedsilica capillaries (Composite Metal Servicesm Hallow, UK) with 25 and 30 cm effective lengths (33 and 38 cm total lengths), 50 µm ID and 375 µm OD were used for the method. Phosphate buffer was.
(5) used as background electrolyte to study the effect of pH on the separation. The phosphoric acid was titrated with 1 M NaOH to obtain a pH from 1.50 to 1.75. Different concentrations (150, 170, 200 nM) of phosphate and citrate at optimum pH for the separation were assayed. Citric acid was titrated to the adequate pH with 1. M. HCl.. Different concentrations of acetonitrile, methanol or trifluoroethanol, dissolved in the background electrolyte and used as organic modifier, were also assayed. Comparative separations were run at 12 kV and with a capillary with 30 cm length. All buffers were passed through a 0.22 µm nitrocellulose filter and degassed before use. Prior to the runs, the capillary was rinsed with 0.1 M NaOH solution, distilled water, and then conditioned with the background electrolyte. The protocol for each sample run consisted of a 3 min prerinse with the background electrolyte followed by sample injection. Samples were introduced into the capillary by pressure at 50 mbar. For the assays of sample injection volume, different times of injection were used: 15, 17, 20, 25, and 30 s. Each run was repeated 6 times. The number of theoretical plates and resolution was calculated by software. Linearity in a graphic of current vs. voltage applied to the selected background electrolyte (Ohm’s law plot) was used to select the suitable voltage. Different voltages (1–20 kV) were applied to the background electrolyte and the current was registered. A graphical representation with these two parameters was performed. The maximum voltage was indicated by the point at which nonlinearity occurs. 2.3 Biological samples Biological samples of a marine microalga were used to develop this procedure. The marine microalga Tetraselmis suecica (Kylin) Butch was cultured in natural seawater enriched with inorganic nutrients without EDTA and Tris [24]. Cultures were grown in glass bottles (Pyrex) with natural sterile air at a flow rate of 10 L/min. They were maintained at 18 ± 1ºC and 68 µEinstein/m2 /s, with a dark:light cycle of 12:12 h. Initial cell density was 25x104 cells/mL. Cadmium was the metal used for the induction of phytochelatins. The marine microalga was exposed to 8 mg/L of this metal, added to the culture medium as CdCl2. After 7 days culture, cells exposed to cadmium were collected by centrifugation (12 000 x g for 10 min) and washed with metal-free seawater. Samples were stored at -20ºC until analysis of phytochelatins..
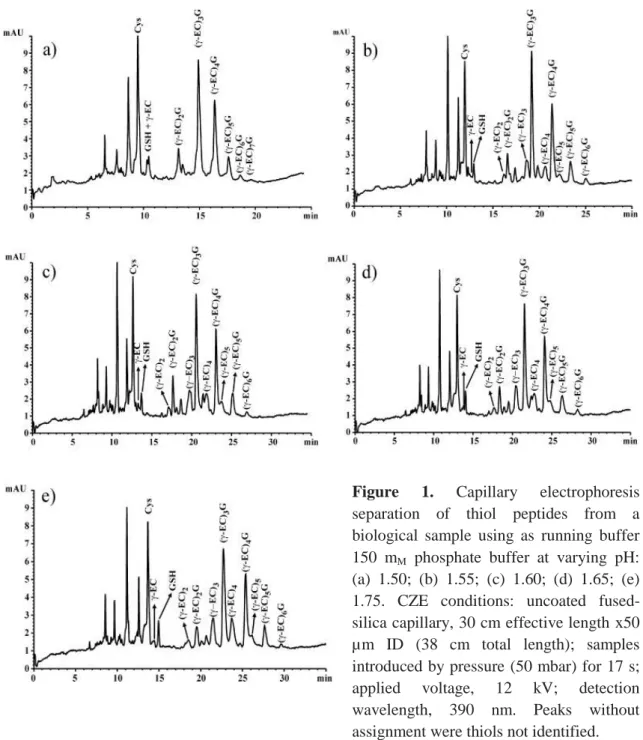
(6) 2.4 Extraction and derivatization of phytochelatins in biological samples using mBrB The derivatization procedure was adapted from Rijstenbil et al. [25]. Frozen samples were resuspended in 0.1 M HCl. In addition, 0.05, 0.1 and 0.2 M sulfosalicylic acid was assayed as possible substitute of HCl for extraction of phytochelatins from cells. Cells were homogenized with an ultrasonic cell disrupter for 3 min at 14 µm. Unbroken cells and cell debris were removed by centrifugation at 12 000 x g for 15 min at 4ºC. The supernatant was collected and 500 mL was added to 500 µL of a freshly prepared derivatization buffer. This buffer was composed of 1. M. borate buffer (pH 9), 1 mM. DTPA, and different concentrations of a reducing agent. 2-Mercaptoethanol in concentrations varying from 1 to 10 mM and concentrations of NaBH4 from 0.05 to 5 mg/mL were assayed as reducing agents. Once the sample was mixed with derivatization buffer, 8 µL 0.1. M. mBrB dissolved in acetonitrile was added and. incubated at room temperature in Eppendorf tubes for 1 h in darkness. Samples were centrifuged at 12 000 x g for 10 min at 4ºC. Finally, 600 µL supernatant was transferred to CZE vials for injection. Standards of phytochelatins, Cys, γ-Glu-Cys, and GSH, derivatized in the same way than biological samples, were used to identify the different peaks.. 3 RESULTS The optimum conditions needed for the separation of samples derivatized with mBrB during capillary electrophoresis were examined. Buffer electrolyte and sample matrix were considered to obtain an adequate resolution and separation efficiency of peaks in electropherograms. 3.1 Optimization of the capillary electrophoretic conditions Different pHs of 150 mM phosphoric acid were assayed as running buffer: 1.55, 1.60, 1.65, and 1.75 (Fig. 1). The shortest migration time was obtained with the lowest pH, but the peaks were not well-separated. In this case, Cys and an unidentified thiol comigrated together. GSH and γ-Glu-Cys were not separated. Phytochelatins and their respective desglycyl-peptides also comigrated together. When the pH was increased, Cys, γ-Glu-Cys, and GSH showed a good separation and desglycyl-peptides were.
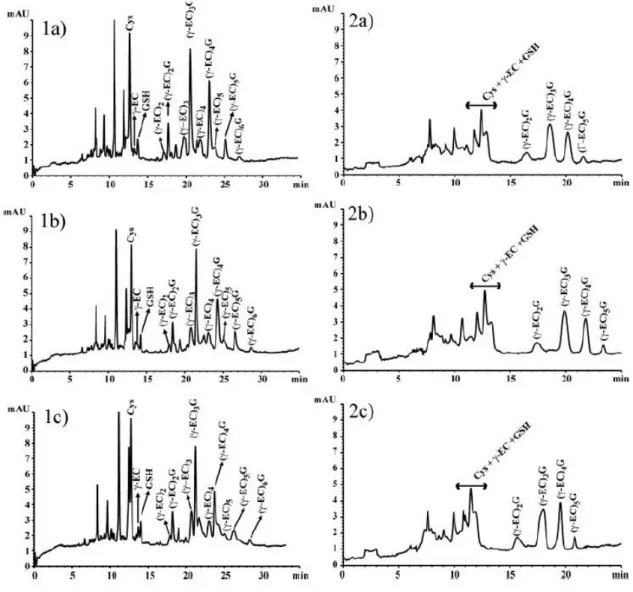
(7) visible. The best separation was obtained with pH 1.60, allowing to resolve the peaks of phytochelatins and their respective desglycyl-peptides that comigrated as a single peak. Resolution values and the number of theoretical plates increased with respect to the lowest pH assayed. With pH 1.75, although the resolutions of Cys, γ-Glu-Cys, and GSH were improved, the number of theoretical plates decreased. Migration times and their standard deviation obtained from six runs are reported in Table 1. Different concentrations of phosphate and citrate at pH 1.60 were also assayed as separation buffers (Fig. 2). The concentrations used were 150, 170, and 200 mM. A voltage of 12 kV was also applied. Although the current was relatively low (55, 60, and 65 µA, respectively) and the migration time was longer with citrate, sensitivity and resolution were higher with phosphate buffer. Smaller thiol peptides (γ-Glu-Cys and GSH) and the amino acid Cys were not separated with citrate and comigrated as a single peak, the phytochelatin peaks were broad and not defined, and desglycyl peptides did not appear. Citric acid without pH titration to 1.60 was also assayed at the same concentrations than phosphate buffer (150, 170, and 200 mM). With this buffer, sensitivity and resolution were lower than with phosphate buffer, although, desglycyl peptides appeared and phytochelatin peaks were sharp (electropherograms not shown). Therefore, phosphate was chosen as optimum running buffer. Adequate separation of Cys, γ-Glu-Cys, GSH, and phytochelatins was obtained with a concentration of 150 mM phosphate pH 1.60 (Fig. 2, 1a). When the concentration of background electrolyte was increased, the migration time increased slightly but resolution decreased. Raising the background electrolyte concentration to 200 mM phosphate resulted in a considerable current increase and band-broadening, which produced a decrease in the number of theoretical plates of the peaks (Fig. 2, 1c)..
(8) Figure 1. Capillary electrophoresis separation of thiol peptides from a biological sample using as running buffer 150 mM phosphate buffer at varying pH: (a) 1.50; (b) 1.55; (c) 1.60; (d) 1.65; (e) 1.75. CZE conditions: uncoated fusedsilica capillary, 30 cm effective length x50 µm ID (38 cm total length); samples introduced by pressure (50 mbar) for 17 s; applied voltage, 12 kV; detection wavelength, 390 nm. Peaks without assignment were thiols not identified.. Organic modifiers were also assayed to optimize the background electrolyte (electropherograms not shown). The organic modifiers were methanol, acetonitrile and trifluoroethanol. These modifiers were added to the running buffer at concentrations of 2.5, 5, and 10% v/v. The addition of these modifiers produced a decrease in conductivity and an increase in migration time. The resolution and the number of theoretical plates did not change when a concentration of 2.5% v/v acetonitrile and trifluoroethanol was added, although (γ-EC)4 (desglycylphytochelatins with 4 Glu-Cys subunits) comigrated with another unidentified thiol when acetonitrile was added. When.
(9) the concentrations of acetonitrile and trifluoroethanol were increased to 10% v/v, γ-GluCys and Cys comigrated with other unidentified thiol molecules and both separation efficiency and resolution decreased. Addition of 2.5% v/v methanol resulted in a slight increase in resolution and the number of theoretical plates. With the higher concentrations of methanol, resolution did not change significantly but migration time increased. The best results were obtained with a running buffer of 150m M H3PO4, pH 1.60, and 2.5% v/v methanol. The Ohm’s law plot was used for the determination of the maximum voltage that can be utilized with this background electrolyte. Linearity in the graphical representation of current vs. voltage applied (graphic not shown) was lost when a voltage of 14 kV was applied to this background electrolyte. The number of theoretical plates, resolution of peaks, and migration times were slightly improved when a voltage of 13 kV was applied. The use of a shorter capillary also means a shorter analysis time. Initial separations were performed in a capillary of 30 cm length from inlet to detector. When the capillary was shortened to 25 cm, the migration time decreased but the number of theoretical plates decreased considerably, even with a voltage of 12 kV. Different injection volumes were assayed to achieve a higher sensitivity without losing the efficiency of the method. The injection of the sample was performed by pressure at 50 mbar for 15, 17, 20, 25, and 30 s. The sample introduction into the capillary for 20– 30 s provoked a loss of resolution that increased with injection time. Also, new peaks of phytochelatins (with n > 6) that could be in low concentrations did not appear. With 15 s injection, sensitivity of peaks decreased and peaks of (γ-EC)6G were not detected. Therefore, sample injection was kept by pressure at 50 mbar for 17 s..
(10) Figure 2. Separation of thiol peptides using (1) phosphate buffer and (2) citrate buffer as background electrolyte, both at pH 1.60, at different concentrations: (a) 150 mM; (b) 170 mM; (c) 200 mM. Instrument conditions were the same as in Fig. 1. Peaks without assignment were thiols not identified.. 3.2 Optimization of sample preparation from biological material: extraction and derivatization of phytochelatins Several buffers have been assayed in this work for the extraction and derivatization of phytochelatins and other important thiols using mBrB to achieve an adequate capillary electrophoretic separation with the method developed. The background electrolyte and the electrophoretic conditions used to optimize the sample preparation were those obtained from the optimization procedure previously developed: 150 mM H3PO4, pH 1.60, and 2.5% methanol v/v, 13 kV, capillary of 30 cm length from inlet to detector and injection with pressure at 50 mbar for 17 s..
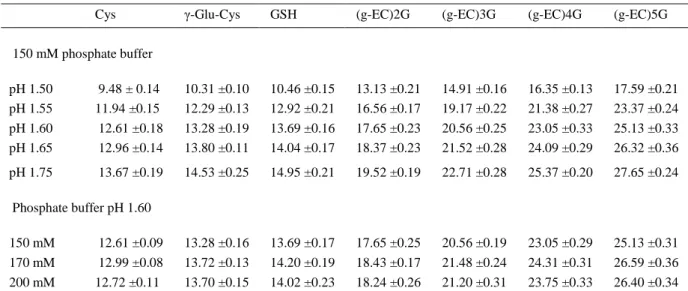
(11) Table 1. Migration time, with their respective standard deviation, of thiol peptides and the amino acid Cys on increasing the running buffer pH and concentration Cys. γ-Glu-Cys. GSH. (g-EC)2G. (g-EC)3G. (g-EC)4G. (g-EC)5G. 150 mM phosphate buffer pH 1.50 pH 1.55 pH 1.60 pH 1.65. 9.48 ± 0.14 11.94 ±0.15 12.61 ±0.18 12.96 ±0.14. 10.31 ±0.10 12.29 ±0.13 13.28 ±0.19 13.80 ±0.11. 10.46 ±0.15 12.92 ±0.21 13.69 ±0.16 14.04 ±0.17. 13.13 ±0.21 16.56 ±0.17 17.65 ±0.23 18.37 ±0.23. 14.91 ±0.16 19.17 ±0.22 20.56 ±0.25 21.52 ±0.28. 16.35 ±0.13 21.38 ±0.27 23.05 ±0.33 24.09 ±0.29. 17.59 ±0.21 23.37 ±0.24 25.13 ±0.33 26.32 ±0.36. pH 1.75. 13.67 ±0.19. 14.53 ±0.25. 14.95 ±0.21. 19.52 ±0.19. 22.71 ±0.28. 25.37 ±0.20. 27.65 ±0.24. 13.28 ±0.16 13.72 ±0.13 13.70 ±0.15. 13.69 ±0.17 14.20 ±0.19 14.02 ±0.23. 17.65 ±0.25 18.43 ±0.17 18.24 ±0.26. 20.56 ±0.19 21.48 ±0.24 21.20 ±0.31. 23.05 ±0.29 24.31 ±0.31 23.75 ±0.33. 25.13 ±0.31 26.59 ±0.36 26.40 ±0.34. Phosphate buffer pH 1.60 150 mM 170 mM 200 mM. 12.61 ±0.09 12.99 ±0.08 12.72 ±0.11. Values are presented as means ± SD. The number of determinations performed for assessment of means and standard deviation was 6.. Sulfosalicylic acid concentrations of 0.05, 0.1, and 0.2 M, and 0.1. M. HCl were used for. phytochelatin extraction (Fig. 3). Sulfosalicylic acid drastically affected the separation by CZE. With sulfosalicylic acid concentrations of 0.1 M and 0.2 M, Cys and γ-Glu-Cys were not separated, and although (γ-EC)2–5G was discerned, sensitivity was low, peaks were broad, and desglycyl peptides comigrated with phytochelatins. At a concentration of 0.05. M,. Cys, γ-Glu-Cys, and GSH were separated and resolution and number of. theoretical plates were considerably improved but phytochelatin peaks were still too broad and desglycyl peptides migrated close to phytochelatins. However, HCl produced appropriate peaks which were clearly separated and identified (Fig. 3). Different concentrations of NaBH4 or 2-mercaptoethanol were added to the buffer to avoid oxidation of the thiol groups (Fig. 4). However, 2-mercaptoethanol interfered in the analysis, giving poor results. When 1, 5, and 10 mM 2-mercaptoethanol was used, peaks corresponding to γ-EC, GSH, and (γ -EC)2–4G were only slightly higher than the baseline (Fig. 4c). Three NaBH4 concentrations were assayed: 0.05, 1.5, and 5 mg/mL, along with a control without a reducing agent (Figs. 4a, b). Unlike with 2mercaptoethanol, peaks were very high with NaBH4 and all compounds were clearly detected. The higher NaBH4 concentration affected the separation of peaks because desglycyl peptides and γ-Glu-Cys comigrated with other peaks and the number of.
(12) theoretical plates decreased (Fig. 4, b1). The lower concentration of NaBH4 (0.05 mg/ mL) and the control evidenced a sharp decrease in the height of the peaks (Fig. 4, a and b3). The best results were obtained with a concentration of 1.5 mg/L NaBH4. 3.3 Characteristics of the method developed The linearity and the concentration limit of detection of the method were checked by analyzing GSH solutions of different concentrations (0.5–100 µM). After the derivatization process and the analysis, the peak area versus concentration was linear (R2 = 0.997) in this concentration range. An amount of 2.5 µM standard GSH was detected. Table 2 shows the number of theoretical plates and resolution of phytochelatins and other thiols obtained with the method developed.. Figure 3. Effect of sulfosalicylic acid and HCl on the extraction of thiols. Sulfosalicylic acid: (a) 0.2 M; (b) 0.1 M; (c) 0.05 M. HCl: (d) 0.1 M. Running buffer, 150 mM H3PO4, pH 1.60, and 2.5% methanol v/v. CZE conditions: uncoated fused-silica capillary, 30 cm effective length x 50 µm ID (38 cm total length); samples introduced by pressure (50 mbar) for 17 s; applied voltage, 13 kV; detection wavelength, 390 nm. Peaks without assignment were thiols not identified..
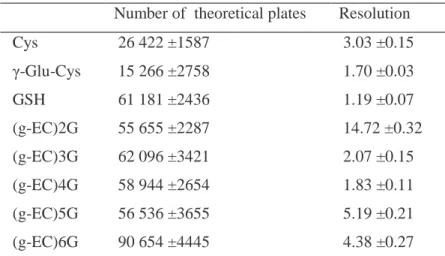
(13) Table 2. Number of theoretical plates and resolution values obtained for phytochelatins and other thiols in the electropherogram of the method developed Number of theoretical plates. Resolution. Cys. 26 422 ±1587. 3.03 ±0.15. γ-Glu-Cys. 15 266 ±2758. 1.70 ±0.03. GSH. 61 181 ±2436. 1.19 ±0.07. (g-EC)2G. 55 655 ±2287. 14.72 ±0.32. (g-EC)3G. 62 096 ±3421. 2.07 ±0.15. (g-EC)4G. 58 944 ±2654. 1.83 ±0.11. (g-EC)5G. 56 536 ±3655. 5.19 ±0.21. (g-EC)6G. 90 654 ±4445. 4.38 ±0.27. Running buffer, 150 mM H3PO4, pH 1.60, and 2.5% methanol v/v. CZE conditions: uncoated fused-silica capillary, 30 cm effective length x 50 µm ID; samples introduced by pressure (50 mbar) for 17 s; applied voltage, 13 kV; detection wavelength, 390 nm. 4 DISCUSSION The presented method permits the separation of thiol peptide phytochelatins and other related thiols derivatized with monobromobimane in complex biological samples without previous purification steps by CZE. This method is a good alternative to other electrophoretic methods for the analysis of these molecules [22, 26]. Sutter et al. [20] used on-line derivatization of thiol peptides with N-ethylmaleimide. The method was suitable for the simultaneous determination of phytochelatins and their precursor molecules by CZE, increasing the sensitivity compared to underivatized thiols. The authors used standards to perform the analytical method, but once the method was applied to biological samples, differences between the chromatograms of standards and biological samples appeared (phytochelatin peaks were broad and migration times were different). Desglycyl-phytochelatins were not detected with that procedure. Kubota et al. [21] used 4-aminosulfonyl-7-fluoro-2,1,3-benzoxadiazole for labeling phytochelatins prior to the separation of these molecules by CZE. Here, desglycyl peptides were detected and the run time was short, however, 4-aminosulfonyl-7-fluoro-2,1,3benzoxadiazole is considered little specific for labeling thiol groups..
(14) Figure 4. Effect of the reducing agent (2-mercaptoethanol and NaBH4) and different concentrations on the derivatization process and CZE analysis of thiol peptides. NaBH4: (b1) 5 mg/mL; (b2) 1.5 mg/mL; (b3) 0.5 mg/mL. 2-Mercaptoethanol: (c1) 10mM; (c2) 5mM; (c3) 1mM; (a) Sample without reducing agent. Running buffer and instrument conditions were the same as in Fig. 3. Peaks without assignment were thiols not identified..
(15) Another compound often used to label thiol groups is mBrB, but to date, separation of mBrB-thiol peptides by CZE was not developed and this separation was achieved only by HPLC. For this reason, it was necessary to optimize a procedure for the separation of these molecules by CZE. In CZE, parameters, such as background electrolyte, ionic strength, electrical field strength, capillary temperature, capillary diameter and length, sample preparation, etc., can affect the efficiency of the separation of the molecules and so, they have to be taken into account to optimize a capillary electrophoresis procedure. The background electrolyte system is the most direct route for the optimization of the separation [27]. This optimization can be achieved using several types of buffers, ionic strengths, additives, such as organic solvents or inorganic salts, and pH modification. The pH is the most important selectivity factor in electrophoretic separations of ampholytes, such as peptides, because the net charge of the ion is dependent on the pH. In this way, both the charge and peptide size play a major role in determining the electromobility of peptides. In buffers of low pH, electromobility differences between peptides will be determined by the total number of protonated basic residues in the chain and separation will be based on the positive charge density of peptides. Peptide charge is changed most readily by altering the pH of the separation electrolyte. Previous publications have demonstrated the advantages of acid background electrolytes. Acid pH suppresses the dissociation of silanol groups on the capillary surfaces and allows the separation of peptides with minimum wall interaction. In addition, a very small electroosmotic flow (EOF) is obtained, leading to a higher resolution for cationic peptides, although in many cases the analysis time can be longer [28]. For low-pH buffers, phosphate and citrate are routinely used. Ban et al. [27] studied the optimal conditions for separating a mixture of four neuropeptides using citrate and phosphate pH 2.0 as running buffer and obtained a sensitivity 5-fold higher with 100 mM sodium phosphate than with 100 mM citrate. Yang et al. [29] used different concentrations and pH of phosphate buffer to resolve structurally related synthetic peptides; the assayed peptides were resolved with 25 mM phosphate buffer, pH 2.0. One previous work [18] reported on the successful CZE separation of thiol peptides phytochelatins from a crude extract using 150mM phosphate, pH 3.50, as background electrolyte with migration from the negative to the positive pole at a voltage of 12 kV, but other important thiol peptides were not detected. In the present study, the pH of 150.
(16) mM phosphate was decreased to values in a narrow range of 1.50–1.65. As one can see in Fig. 1, even small changes of the pH had a drastic influence on the resolution of the components. A pH value of 1.60 was the optimum for the separation of phytochelatins, moreover, it allowed the separation of phytochelatins and their respective desglycyl peptides as well as their precursors (GSH, γ-Glu-Cys, and the amino acid Cys) in an mBrB-derivatized biological sample. In capillary electrophoresis, the concentration of the background electrolyte can be adjusted to enhance the separation performance. However, higher concentrations of 150 mM of phosphate buffer (170 and 200 mM) produced worse results. This effect was due to Joule heat that was not efficiently dissipated and thus provoked an increase in the current and EOF. The use of electrolytes of high ionic strengths requires a wellcontrolled capillary temperature or the use of lower field strengths with an increase in the analysis times. Lower concentrations than 150 mM phosphate were also assayed, but the separation was insufficient (data not shown) because, although the analysis time was shorter, the peaks were too broad and several important thiols comigrated as one peak. Once the buffer and its concentration were established, the resolution and the analysis time were considered for improvement. Different modifiers were tested at varying concentrations. The addition of modifiers to the background electrolyte has different effects, depending on the nature of the additive. These cosolvents can improve analyte solubility, detector sensitivity, separation, and resolution and can help to control the EOF. In the presented work, three organic modifiers were assayed: acetonitrile, methanol, and trifluoroethanol. In general, the effect of organic solvents on the electrophoretic mobility is difficult to predict. Only one of the solvents assayed in this work (2.5%v/v methanol) enhanced the performance of the method. With this solvent, the differences in mobility of the analyzed mBrB peptides increased and, therefore, resolution was improved. A background electrolyte composed of 150mM phosphate pH1.60 and 2.5%v/v methanol was found to be optimum for the separation. An electropherogram showing the separation of the thiols is demonstrated in Fig. 5. A simple strategy used to decrease the analysis time is to raise the voltage when the capillary length is not modified, since higher voltages result in shorter analysis times and narrower peaks. However, the ionic strength of a background electrolyte restricts the maximum voltage that can be utilized because the voltage should not be so high that.
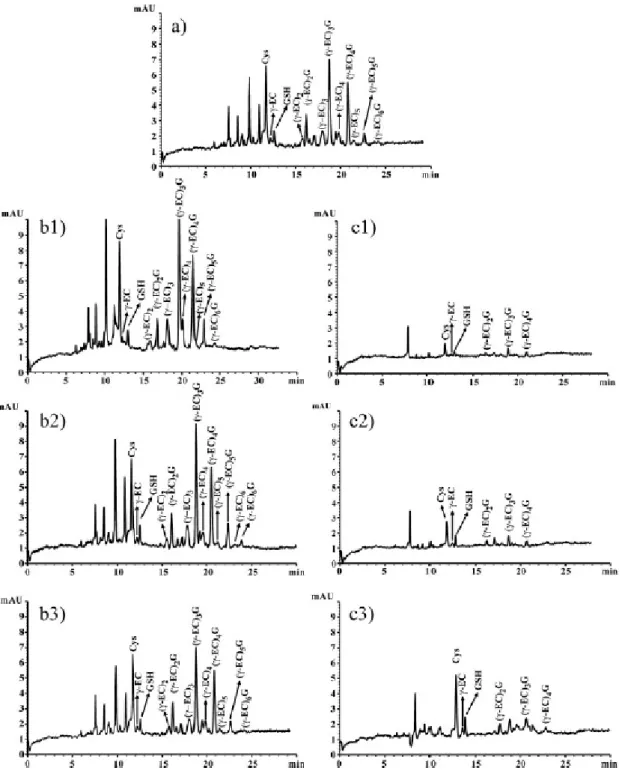
(17) the heat cannot be effectively dissipated. For this reason, the Ohm’s law plot was used for the determination of the maximum voltage that can be utilized with the optimum background electrolyte. A voltage of 13 kV was the most suitable for the electrophoretic conditions used in this work.. Figure 5. Electropherograms of phytochelatins and related thiol peptides from samples of the marine microalgae Tetraselmis suecica. Running buffer, 150 mM H3PO4, pH 1.60, and 2.5% v/v methanol. CZE conditions: uncoated fused-silica capillary, 30 cm effective length x 50 µm ID (38 cm total length); samples introduced by pressure (50 mbar) for 17 s; applied voltage, 13 kV; detection wavelength, 390 nm. Extraction procedure: 0.1. M. HCl and 1.5 mg/mL NaBH4. Peaks. without assignment were thiols not identified.. One of the most critical points in quantitative analysis is the injection of the sample. The length of the sample plug that is injected is an important parameter [30]. Selecting an appropriate sample volume in CZE is difficult. Low sample volumes offer very high theoretical plates but they yield small detector signals. The sample volume to be injected into the capillary is a trade-off between the number of theoretical plates and sensitivity. For maximum efficiency of the developed method, the smallest volume of injected sample that gave detectable quantities of the solutes was 17 s at 50 mbar pressure. The influence of sample processing on separation was also examined. Although the sample constitutes a very small portion of the overall volume in the capillary once it is injected, the matrix of the sample has profound effects on the separation by CZE [20,.
(18) 27, 31]. The results obtained in the present study indicated that both separation and migration times of the examined compounds were influenced by sample composition. Several buffers have been assayed for the extraction and the derivatization of phytochelatins and other important thiols using mBrB to achieve an adequate capillary electrophoretic separation with the method developed. Acid extraction is necessary to avoid oxidation of thiols and allows the precipitation of proteins and other undesirable molecules that could interfere in the derivatization reaction. In the literature, extraction of nonprotein thiols (phytochelatins and others) is carried out in different acids, such as trichloroacetic acid, sulfosalicylic acid, trifluoroacetic acid, and HCl. Plant tissue and algae are routinely homogenized in 0.2 M sulfosalicylic acid or 0.1. M. HCl to extract phytochelatins [32–35]. The effect on the. separation of using these acids was studied in this paper. The results showed than the best acid to extract phytochelatins for the analysis by the procedure developed was 0.1 M. HCl. Sample deproteinization with sulfosalicylic acid negatively influenced the. separation of the examined compounds during CZE. After extraction of the phytochelatins, they were derivatized with mBrB. The reactions of mBrB with thiols are pH-dependent and an alkaline buffer has to be used for good derivatization [13]. Under these conditions, a reducing agent must be added to avoid oxidation of the thiol groups. NaBH4 is the most common reducing agent used in phytochelatin analysis, but 2-mercaptoethanol has also been utilized in several works [36]. From the results presented here, it is concluded that 2-mercaptoethanol interfered the analysis (Fig. 4). The reason for this finding is that most of the mBrB binds to the thiol group of 2-mercaptoethanol, preventing the derivatization of thiols present in the sample. To avoid this problem, a higher mBrB concentration or a smaller 2mercaptoethanol concentration should be used. This involves an unnecessary loss of reagent or a higher risk of thiol oxidation. Otherwise, assays with NaBH4 did not raise this problem, and therefore it was selected as more suitable reducing agent. The best concentration was 1.5 mg/L NaBH4. In comparison with the lower concentration of NaBH4 (Fig. 4, b2) or with a control (without reducing agent) (Fig. 4, a) all peaks were separated and a loss of thiol groups due to oxidation was not observed. Therefore, the derivatization process must be taken into account to obtain good results in the analysis of phytochelatins, not only by a CZE procedure. NaBH4 would be more appropriate as reducing agent to obtain good derivatization efficiency..
(19) Finally, most authors stop the reaction by means of the addition of metanosulfonic acid after the derivatization process. In this work, this step was avoided, leaving the sample under alkaline conditions. This is an important aspect because, as a result of using an acid background electrolyte and since the sample has alkaline conditions, stacking is produced (pH-mediated stacking). This procedure allows an increase in both sensitivity and number of theoretical plates. An amount of 2.5 µM standard GSH was detected with the technique developed. Detection was set at a wavelength of 390 nm because mBrB has a maximum absorbance at this wavelength and other compounds that could be present in the sample do not absorb. Peaks in an electropherogram were not detected at this wavelength when a sample without derivatization was injected. The sensitivity of this technique could be increased by several orders of magnitude using a capillary electrophoretic system equipped with a fluorescence detector since mBrB is also a fluorescencent compound. Hart et al. [26] performed a method capable of detecting about 1 fmol GSH derivatized with 5-bromomethylfluorescein (5-BMF) using an HPCE-LIF apparatus. Mounicou et al. [22] performed detection with electrospray-mass spectrometry allowing a greater selectivity in the detection process of phytochelatins. However, these detection types are rather expensive. The method described in this paper, which employs a commercially available CZE instrumentation with photodiode array detection, is a good alternative to analyze phytochelatins and other related thiols in a rapid, low cost, and selective procedure. In conclusion, a method to improve the analysis of phytochelatins and other thiol peptides derivatized with mBrB in complex biological samples by CZE was described. The electrophoretic conditions used to optimize the separation were: 150 mM H3PO4, pH 1.60, and 2.5% methanol v/v, 13 kV, capillary of 30 cm length from inlet to detector (38 cm total length), 50 µm ID, and 375 µm OD. Injection was done with pressure at 50 mbar for 17 s and the detection wavelength was set to 390 nm. Derivatization of biological samples was also optimized to achieve good sensitivity and efficiency in the analysis. Extraction of thiols with 0.1. M. HCl showed the best results to analyte these. compounds by the technique developed. In addition, NaBH4 was more suitable than 2mercaptoethanol as reducing agent in this procedure. The conditions established in this work allow a rapid, reproducible, and sensitive analysis of phytochelatins and other.
(20) thiols using a UV detector and of crude extracts of biological samples, avoiding previous complicated purification steps (Fig. 5 and Table 2).. This work was funded by the Plan Nacional de I+D (Ref: REN 2003 – 02414), Spain. The authors wish to thank Prof. Zenk and his co-workes for preparing the phytochelatin standards.. 5 REFERENCES [1] Cobbett, C., Goldsbrough, P., Annu. Rev. Plant Physiol. Plant Mol. Biol. 2002, 53, 159–182. [2] Salt, D. E., Rauser, W. E., Plant Physiol. 1995, 107, 1293–1301. [3] Hirata, K., Tsujimoto, Y., Namba, T., Ohta, T., Hirayanagi, N., Miyasaka, H., Zenk, M. H., Miyamoto, K., J. Biosci. Bioeng. 2001, 92, 24–29. [4] Rauser, W. E., Plant Physiol. 1995, 109, 1141–1149. [5] Kaplan, D., Heimer, Y. M., Abeliovich, A., Goldsbrough, P. B., Plant Sci. 1995, 109, 129– 137. [6] Cazale, A. C., Clemens, S., FEBS Lett. 2001, 507, 215–219. [7] Doring, S., Korhammer, S., Oetken, M., Markert, B., Fresenius’ J. Anal. Chem. 2000, 366, 316–318. [8] Maier, E. A., Matthews, R. D., McDowell, J. A., Walden, R. R., Ahner, B. A., J. Environ. Qual. 2003, 32, 1356–1364. [9] Maita, Y., Kawaguchi, S., Bull. Environ. Contam. Toxicol. 1989, 43, 394–401. [10] Sneller, F. E. C., Noordover, E. C. M., Bookum, W. M. T., Schat, H., Bedaux, J. J. M., Verkleij, J. A. C., Ecotoxicology 1999, 8, 167–175. [11] Hu, S. X., Lau, K. W. K., Wu, M., Plant Sci. 2001, 161, 987–996. [12] Fukushima, T., Usui, N., Santa, T., Imai, K., J. Pharm. Biomed. Anal. 2003, 30, 1655– 1687. [13] Kosower, E. M., Kosower, N. S., Methods Enzymol. 1995, 251, 133–148. [14] Newton, G. L., Dorian, R., Fahey, R. C., Anal. Biochem. 1981, 114, 383–387. [15] Righetti, P. G., Biopharm. Drug Dispos. 2001, 22, 337–351. [16] Hearn, M. T. W., Biologicals 2001, 29, 159–178. [17] Kasicka, V., Electrophoresis 2003, 24, 4013–4046..
(21) [18] Torres, E., Cid, A., Fidalgo, P., Abalde, J., J. Chromatogr. A 1997, 775, 339–347. [19] Perez-Rama, M., Herrero, C., Abalde, J., Torres, E., Environ.Toxicol. Chem. 2001, 20, 2061–2066. [20] Sutter, K., Friebe, S., Krauss, G. J., Int. J. Environ. Anal. Chem. 1999, 74, 167–178. [21] Kubota, H., Sato, K., Yamada, T., Maitani, T., J. Chromatogr. 1998, 803, 315–320. [22] Mounicou, S., Vacchina, V., Szpunar, J., Potin-Gautier, M., Lobinski, R., Analyst 2001, 126, 624–632. [23] Sneller, F. E. C., van Heerwaarden, L. M., Koevoets, P. L. M., Vooijs, R., Schat, H., Verkleij, J. A. C., J. Agric. Food Chem. 2000, 48, 4014–4019. [24] Perez-Rama, M., Abalde, J., Herrero, C., Torres, E., Biores. Technol. 2002, 8, 265–270. [25] Rijstenbil, J. W., Dehairs, F., Ehrlich, R., Wijnholds, J. A., Aquat. Toxic. 1998, 42, 187– 209. [26] Hart, J. J., Welch, R. M., Norvell, W. A., Kochian, L. V., Electrophoresis 2002, 23, 81–87. [27] Ban, E., Choi, O. K., Chung, W. Y., Park, C. S., Yoo, E. A., Chung, B. C., Yoo, Y. S., Electrophoresis 2001, 22, 2173–2178. [28] Oda, R. P., Landers, J. P., in: Landers, J. P. (Ed.), Handbook of Capillary Electrophoresis, CRC Press, Boca Raton, FL 1994, pp. 9–42. [29] Yang, Y., Boysen, R. I., Chen, J. I., Keah, H. H., Hearn, M. T., J. Chromatogr. A 2003, 1009, 3–14. [30] Baker, D. R., Capillary Electrophoresis, John Wiley & Sons, New York 1995, pp. 184– 186. [31] Krˇivankova, L., Pantu˚ ckova, P., Gebauer, P., Bocˇ ek, P., Caslavska, J., Thormann, W., Electrophoresis 2003, 24, 505–517. [32] Pawlik-Skowronska, B., Aquat.Toxicol. 2003, 62, 155–163. [33] Tripathi, R. D., Rai, U. N., Gupta, M., Chandra, P., Bull. Environ. Contam. Toxicol. 1996, 56, 505–512. [34] Mehra, R. K., Tran, K., Scott, G. W., Mulchandani, P., Saini, S. S., J. Inorg. Biochem. 1996, 61, 125–142. [35] Rijstenbil, J. W., Gerringa, L. J., Aquat. Toxicol. 2002, 56, 115–131. [36] Pistocchi, R., Mormile, M. A., Guerrini,.
(22)
Figure

+4

Documento similar
Petri nets have proved their usefulness for the modelling, analysis, and simulation of a diversity of biological networks, covering qualitative, stochastic, continuous and
For the extraction of photon reconstruction and identifi- cation efficiencies, the photon energy scale, and expected properties of the isolation transverse energy distributions,
In a survey of 1,833 business management undergraduates in six Ibero-American countries, factor analysis identified three approaches to stakeholder relations, behaviors, and
In this work, the improvement of the semantic description extraction process from video sequences using contextual information (from a speci c application domain) and
The analysis of the biological effects of gold nanoparticles generated by biological reduction of HAuCl 4 gold precursor in HeLa cells and the comparison with
Different methods for removing interference by humic substances in the analysis of polar pollutants have been compared in the analysis of environmental water by solid-phase
In the present work, the supercritical fluid extraction of heather, marigold and the combined extraction of both plants (50:50 heather + marigold) was carried out, the concentration
Given the importance of the minutiae extraction process with latent fingerprints in forensic applications, in this work we compare and analyze the performance of automatic and
