Analysis of the leaf litter arthropod fauna of a lowland tropical evergreen forest site (La Selva, Costa Rica)
8
0
0
Texto completo
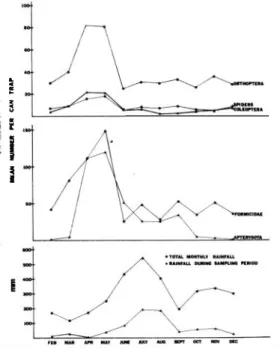
(2) REVISTA DE BIOLOGIA TROPICAL. 28. out at 1 0 m intervals in two transect lines, one in undisturbed forest, the other in the cacao plantation. f;ach trap had a top that could be removed during trapping operations, and con tained pichc acid solution to fIx all specimens at time of capture . Traps were operated at both plots once a month for a period of 1 3 months, from February 1 974 to February 1 97 5. Sam pling spanned a continuous four-day period in each of the 1 3 months. The traps were cleared every 6-1 0 hours day and night (mean satTlpling period: 9 .02 ± 3 .7 hours), the picric acid 'was replaced, and the arthropods removed and preserved. In the laboratory , can trap samples were evaluated. Each sample was recorded with respect to numbers of various arthropod groups and their respective sizes. Most arthropods were classifIed to order (Table 1 ). Ants we re sepa rated from other Hymenoptera ; arachnids were. �. ! 5. .... D.. .. �. ii �. Fig.. 1. S ea s o n al a bu n d a n c e s of p r e d ominant arthropods and rainfall patterns for the same periodo. divided into spiders, ]l1ites, and other arachnids. Chilopoda and Diplopoda were placed together, as were snails, worms, and leeches (all relatively uncommon). Though snails, worms ana leeches are not arthropods, they were the only other invertebrates found and were thus included. The larvae were initially separated into Diptera,. Lepidoptera, Coleoptera, other identifiable lar vae , and unidentifiable larvae. The data base for the separation was too small, and no sienificant differences between them were found. Conse q�ently all larvae are grouped together through out the paper. The miscellaneous category i ncludes Ephemeroptera, Neuroptera, and Lep i d o p t e r a . The unidentified category includes all arthropod individuals that could not be accurately identified. RESULTS A total of 2 1 ,944 individual arthropods were collected, of which 34.8% were ants, 22.7% Orthoptera, 1 8 .0% Apterygota, 5.0% spiders, and the remaining 1 9 .5% was comprised of all other groups combined. Figure 1 shows the average numbers of individuals collected per months for the major groups. Total monthly rainfall and rainfall during the sampling periods are also presented. Numbers for all major groups peaked in spring and subsequently declined in summer. With the exception of the Apterygota, numbers re mained relatively constant over the remainder of the year. Apterygota exhibited a further decline in numbers in late fall and winter. More individuals were trapped during the day among the Apterygota, Diptera and the Miscellaneous group, than at night. More indi viduals were trapped at night than during the day among the ants, spiders, Isopoda, other arachnids, and Chilopoda and Diplopoda. Fur thermore , more individuals were found in the forest plot than in the cacao for the Or thoptera, spiders, and Homoptera. Table 1 lists the results of multiple analyses of variance for each arthropod group's abundance. The three factors in the analyses ofvariance were months of the study, forest versus cacao site, and day versus night. The purpose of such anovas is to test if there are significant effects due to any of these factors, and to test if there are any interactions between the factors. The table lists the probability that there is a significant effect ; probability values greater than .05 are not listed and are not considered significant. The three way multiple anova u sed allowed for an adjust ment for unequal sample sizes. The condition of homoscedasticity was met. Significant effects exist for month of trap ping for all arthropod groups except larvae, miscellaneous, and unidentifIed (all very rare)..
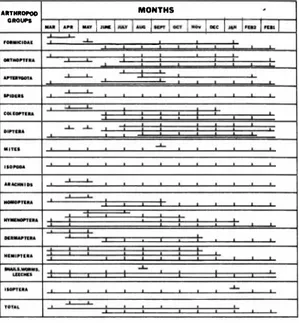
(3) L1EBERMAN el DOCK:. Arthropod fauna, La Selva, Costa Rica. Except for the Hemiptera (p .006), Isoptera (p .03), and the Dennaptera (p .007), these effects are significant at the .000 1 level or better. Interactions between sampling� month and forest versus cacao occur in the following groups : Orthoptera, mites, Isopoda, Coleoptera, Apterygota, Homoptera, Hemiptera, and Isoptera. Interactions also occur between month and time of day for ants, Orthoptera, Diptera, Isopoda, Coleoptera, Apterygota, Ar achni d a , Ho moptera, Hemiptera, and Dermaptera. For many groups, the difference between day-night abundances depends on the month (and possibly the associated rainfall). For other groups, the differences between abundances in the forest versus cacao plots also depend on the month of the year. Three-way interactions between month, forest-cacao, and day-night occur only for the Apterygota and the Homoptera. Figure 2 represents the results of Duncan's multiple-range a posteriori test. This test was run o subsequent to the three-way multiple anovas on aH abundance variables for which there was a significant effect due to month. In Figure 2, lines connect those months for which the means (average abundance of the group) are not significantly different at the .05 level. =. =. .ITHIOII'OD OooUl'S. =. MONTHS. 1-_., 1,,,' 1.,,'1,_ ' , I' � ,r -"" I .� I ..I�" I---"I'M"' ,r 1 -1"' 1,-,.¡,,-.' , 1---1 '. ... .... ..... .L-...L. ,. Fig. 2. Results 'of Duncan's Multiple Range a posteriorl test. Bars connect those months for which there is no significant difference between the mean abundances of the particular arthropod group.. 29. For ants, the average abundance in May is significantIy different from a11 other months; March and April fonn a cluster, as do M arch. September, November, and the fo11owing Janu ary. Sorne taxa have o nly two groups of months that cluster (e.g. 'spiders and mites) , while others evince a greater complexity, with up to five such clusters (Diptera, Apterygota) . Figure 3 relates directly to Table 1 . The abundances in the forest and cacao plots, separated into day and night collections, are tabulated. They are tabulated o nly for those arthropods with significant effects dile to either the forest-cacao factor, the day-night factor or both. Table 2 represents the Pearson product moment correlations between the numbers of individuals of the arthropod groups. Those correlations significant at the .001 and .0001 levels are indicated. Such stríngent significance levels were deemed necessary due to the large sample sizes. DISCUSSION Many studies have shown that pit traps (also caBed can traps or pitfall traps) are the most efficient way of coHecting litter arthropods and evaluating thcir abundances over time (Baars, 1 979; Meijer, 1 974; Mitchell, 1 963 ; Uetz and Unzicker, 1 976). Specifically,. Meijer ( 1 974) and Denboer ( 1 97 1 ) have founa pit traps to be vtiry successful as measures of relative abundance and particularly useful in comparing populations in differe nt sites, even though trap efficiency varíes from species to species and habitat to habitat (Mitchell, 1 963). Baars (1 979) cautions that many traps are needed in micro-spatially heterogeneous habi tats. The large sample size in this study reflects this consideration. The numbers recorded in this study must be viewed comparatively ; Le. sorne arthropod groups may be sampled more completely than others, hut this selectivity will presumably be the same for forest and cacao and for day and night. Previous studies (Baars, 1 979 ; Meiier, 1 974; Uetz and Unzicker, 1 976) have used smaller pit traps (approxiinately 0.8 liter). It should be emphasized that this study used one gaBon (3.8 liters) pit traps, thus increasing the size of the sample , and pre sumably the efficiency as well. Monthly differences : As seen , in Figure 1 , rainfall begins to increase in May and June and.
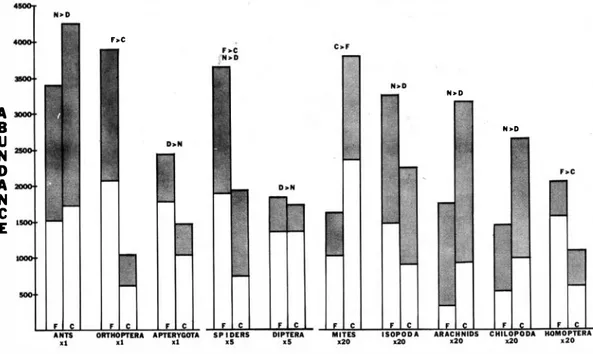
(4) REVISTA DE BIOLOGIA TROPICAL. 30. he. N>D. A B U N D A N e E. N >D. dO. Fig.. 3. Tótal abundance of arthropod gr oup s, separated into forest (F) and cacao (C) sites. Shaded porti ons are during the day. Qnly arthr opod groups with significant effects due to either the forest-cacao or day·riight fact ors, or both, are included. Those effects that are signifi€ant at the 0.5 level are indicated above the individual histograms.. peaks for the sampling period in J uly and August. Numbers of all major groups of insects reach a maximum between the onset of the rainy season and the period of peak rainfaÍl.. tane rain forest (also in Costa Rica), found ' maximum insect abundance late in the d ry season and early i n the rainy season. Wolda { l 9 79), working with light traps in Panama,. While a causal relationshio cannot be proven , a. also found a large decrease in insect abundance. correlation betwe en the onset of the rainy. during the dry season. Denlinger ( 1980), using Malaise traps in Kenya, foun d a complex. season and insect abundance is indicate d. The peak rainfall months of July and August. relationship between rainfall and abu ndance,. show no significant difference in iose ct abun dance from subsequent drier months for many. with the peak of abundance coincident with. arthropod groups (ants, Orthoptera, spiders, for. Several factors influencing the response of insect populations to the onset of the rainy. example). Notably , it is the non-arthop ods, the snails, worms, and leeches, that have a signifi cantly different abundance in August; these are the groups that are likely to do particularly well in wet. areas.. The two Februaries share. a. maximum rainfall.. season have been postulated. The increase in insect populations may be due to the height ened availab ility of plant food (Buskirk and Buskirk, 1976; Wolda, 1 979). Work in progress. cornmon group of non-significantly different. concerns. means for all insect groups, suggesting that the. which were measured concurrently with the can. year studied is generalizable to other years.. various. biotic and abiotic. factors. trap samples. These include temperatu re , rain. Bigger ( 1 9 76) has shown cyclical behavior of. f all ,. and. numerous. vegetation. variables.. insect populations over several years. Though. Following analyses of variance it was found. our data are insufficient to generalize an annual. that among the vegetation variables, only leaf litter depth varies significantly with m onth.. pattern,. a. striking. monthly. variation. in. arthropod abundances has been shown . Others. Specifically, litter depth is greatest in May and. have showo comparable resp onses in tropical forest ecosystems. Buskirk and Buskirk ( 1 976),. least in October and November. Herbaceous cover appears to be greatest in March and April,. working with sweep samples in a lower moo-. and least in November and December (though.
(5) UEBERMAN & DOCK: Arthropod fauna, La Selva, Costa Rica.. 31. TABLE 1 Three-way multiple analyses oi varÚlnce. The three factors are month (l3 1evels) . forf!st or cacao (2 1evels), and doy or night (2 levels). Listed �f!low are the probabilities that the effects are significant for tnese three factors and their interactions (*). Ifp �. 05, the probabl1ity is not listed. FC is forest cacao, and DN is day-nigh t.. VARIABLES. 1. Total Ants Orthoptera Spiders Mites Hymenoptera Diptera 1 sopada Coleoptera Apterygota Chilopoda Arachnida Larvae Homoptera Hemiptera Isoptera Dermaptera Miscellaneous Snails, Worms Unidentified. MONTH. FC. .0001 .0001 .0001 .0001 .0001 .0001 .0001 .0001 .0001 .0001. .0001. DN. MONTH *FC .0004. .0001 .000 1 .0001. .000 1 .00 7 3 .0208. .0183. .000 1 .005 1. .000 1. . 000 1. .0001. .0232. .000 1. .0001 .0056 .03 24 .0007. . 0004. FC*DN. MONTH FC*DN. .0001 .0:395 .0001. .0204. .003 9 . 0006 .0001. .0001 .0005 .0273 .0001. .000 1. .00 1 6 .0196 .0156 .01 1 1. .0147. MONTH *DN. .0001 .0009. . 04 3 0. .0003 .00 1 3. .0001. Chilopoda, aboye, includes both Chilopoda and Diplopoda. Arachnida includes aH Arachnid� !?ther ' than spiders. Snails. Wonns includes snails, wonns, and lee ches . The miscellaneous category is explained in the texto. not at the .05 level of significan ce). Thus, we find that insect populations are greatest when there is more food available , just befare and at the onset of the rainy season. The ability of insect populations to peak in response to the beginning of the rainy season (whether the response is specifically to the vegetation , the rainfall, both, or sorne other factors) has been p ostulated to be due to developmental arrest, with environmental para meters triggering the termination of diapause (Denlinger, 1 980). This may be happening in the leaf litter at La Selva as well . In the groups studied, it seems far less likely that individuals are migrating in and out of the area. Forest versus cacao : Mixed cacao plantations are believed to harbor sorne of the most complex insect communities (Bigger, 1 976). However, more individuals were found in the forest plot than in the cacao for the. Orthoptera, spiders, and Homoptera . These groups may be particularIy sensitive to the effects of environmental perturbations. In the case of mites, more individuals were found in the cacao than in the forest. Perhaps mites are more capable of exploiting perturbed eco systems. While other groups have more indi viduals in the cacao than the forest (ants, other arachnids, Chilopoda and Diplopoda), these differences are not large enough to be statis tically significant. Further study is recomrnended to determine if these groups, as well as the mites, are either related ecologically or are (as a group) better capable o f u tilizing the resources in a disturbed ecosystem. Conversely,study is also recomrnend ed to determine if those groups more abun dant in the forest are indeed less capable of exploiting perturbed ecosysterns . Indeed, this shift in composition of the leaf litter arthropod.
(6) REVISTA. 32. DE BIOLOGIA TROPICAL. TAB LE 2 Pearson product-momen.t co"elations 2. 1- Formicidae. X. 2- Orthoptera 3· Spiders. 4. 5. 9. 6. *+. *+. *+. *+. *+. X. *+. *+. *+. *+. *+. X. *+. *+. *+. *+. *+. *+. 4· Mites 5· Hymenoptera. X. X. 6· Diptera. X. 7· Isopoda. X. lO. 11. *+. *+. 12. 13. 14. *+. *+. 15. 17. )6. X. 9· Apterygota. 19. *+. +. *+. *+. *+. +. *+. *+. *+. *+. *+ *+. 10· Chilopoda 1 1 · Arachnids. *+. *+. *+. X. +. *+. *+. *+. *+. *+. X. *+. *+. X. 1 2· Larvae. 20. *+. *+. *+. 8· Coleop tera. 18. X. X. 13· Homoptera. +. *+. *+. *+. *+. +. +. *+. *+. *+. X. 14· Hemiptera. *+. +. X. 15· !soptera 16· Oermaptera. X. 17· Mise.. X. 1 8· Snails, Worms. X X. 1 9· Unidentified. X. 20· Total. The variables, above, are lhe numbers of individuals colleetcd per can trap (n= 1 3 8). The symbols used above are : * + : If p. < .0001. +: If p. < .001. In all cases, r >0.. fauna may have implications b oth in succession. fore st. Several' workers have noted a compara ble dorninahce andfor prep onde:rance of ants in. and resource management in the tropics. It should be noted that total abundance is. tropical. forest. litters. and. sOlls (Strickland,. also greater in the forest. This is to be expected. 1 945 ; Wolda,. in light of the concept that disturb ed eco systems, particularly in the tropics, have fewer. ( 1 976) found 2 5 0 species of ants in a cacao. available. niches, less environmental. 1 9 77 ;. Collins,. 1 980).. Bigger. fore sto Collins ( 1 980), working in Sarawak on. predict. the soil macrofauna, found terrnites (62 .2%). ability and gre ater variability , and sub se quent. and ants ( 1 9 .7%) to be the most abundant in a. redu ced abundance and species richness within and among very different taxa. Re search is in. lowland site . Qur finding of more ants than any other group (34 .8%) and only 0 . l 9% terrnites. p rogre ss to assess the ecological differences between disturbed and undisturbed forest eco. may in part be due to a soil-Ieaf litter differ. systems for leaf litter amphibians and reptiles. World difference. This study further supports. that prey upon the arthropods in this study .. Diel differences: There were significantly m ore. ants,. Isopoda,. spiders,. and. other. arachnids at night than during the d ay , and more Apterygota and Diptera during the day than at night. It se ems probable that niche partitioning exists among the arthropods in the forest leaf litter, with respect to time of day.. Ants:. Ants are by far the m ost abundant. macro-invertebrate s in the leaf litter of this. ence, or p ossibly an interesting Old World-New the contention that ants are ecological domi nants. Though. not. statistically. si gnificant ,. the. greater abundance of ants in the cacao may be due to the presence of one or more species which thrive in disturbed habitats. For exam pIe , Wasmannia auropuncta is present in both afeas, but does better in disturbed habitats, is m ore flexible in its requirements, and is a very aggressive species (Roy Snelling, pers. comm.). There are more ants active at night than during the day. It should. be noted that day-night.
(7) 33. LlEBERMAN & DOCK: Arthropod fauna, La Selva, Costa Rica. differences m a y relate i n part t o the possibility. that· arthropods may better see and avoid traps. during the day. Ants collected during the day are larger on the avemge than those ,t aken at night. Furthermore, no difference exi�ts in ant. size between the forest and cacao, su�esting. J ames Talbot, ando R . Wayne Vandevender for. their invaluable help in collection and identifi cation of the specimens in Costa Rica. We also. want to thank Roy Snelling for reading and. commenting on the m anuscript.. that the same groups are utilizing both habitats.. Different. groups. appear. to. RESUMEN. be foraging at. different times of the day. As seen in Table. 2,. the abundance of ants corre lates highly with. the abundances of most other groups, with the. exception of mites, other Hymenoptera, and. Apterygota ( and other rarer groo ps). Ant abun. dance is seen as an excellent predictor of overall arthropod abundance. A verage ant abundance. peaks in April and May, with a sharp drop froin. May to June. As se en in Figure. Los. grupos. de. artrópodos más frecuen. temente capturados con trampas cilíndricas. un galón. (3 .78. de. litros) en ambientes de suelo. vegetal en un bosque húmedo de tierras .bajas de. Costa Rica fueron h ormigas, ortópteros y co lémbolbs. Las muestras indican variaciones esta cionales significativas en la abundancia de los. grupos mayores. Los n úmeros de artrópodos. 2 , March, A pril,. fueron, mayores entre la iniciación de la tempo. other months. As in all other arthropod groups,. colémbolos, moscas y grupos menos comun es. and May are significantly different from the. rada lluviosa y el máximo de precipitación.Los. the February values for the two years are not. misceláne os se capturaron en mayor cantidad. Orthoptera: Orthoptera are the second most abundant leaf litter group. The sam pling method used may underestimate very mobile, hopping and flying grou ps such as Orthoptera. While they may be underestimated, their num bers are great enough for meaningful com parisons. Though there is no difference in Orthoptera abundance between day and night, there is a substantial difference between the forest and cacao. Orthopteran abundance is reduced in the disturbed ecosystem (Fig. 1). Unlike ants and Apterygota, Orthoptera may be. mayor cantidad durante la noche. se capturó. significantly different.. arañ as, milpiés y. less able to tolerate environmental perturba tion . Orthoptera also peak in A pril and May,. just prior to the rain iest months.. Apterygota: The third most abundant group. is the Apterygota. Their abundance in tra ps. varies. greatly,. Febru a r y , Lieberman. to. from. ( 1 982). 0-36 899-101 1. in. in. December. April-June.. has shown Apterygota to be. a rare prey item for Amphibians and Reptiles,. which may be related to this un predictable abundance. Apterygota are significantly more. abundant during the day than at night, while no. forest-cacao difference in abundance exists. A CKNOWLEDGEMENTS. This study was undertaken as part of NSF. Grant #BMS. 7301 6 1 9 A0 1 ,. durante el día, mientras que las h ormigas,. to Jay M. Savage. and Ian R. Straughan. We thank Cad Ueb,. una. may or. cienpiés se colectaron en. cantidad. de. artrópodos. en los. ambientes no perturbados que en los habitats. modificados · de cultivo. de cacao. Los grupos. más comunes en ambientes no perturbados. fueron los ortópteros, arañas y h omópteros.. Los mayores números de artrópodos correspon. den a los espesores máximos de cubierta vegetal � durante los trece meses de muestreq.. LlTERATURE CI TED. Allen, W.C. 1 926. Distribution of animals in a tropical rain-forest with relation to environmental factors. Ecology, 7 : 445-468. Anderson, J.M. 1975. Succession, diversity, and trophic relationships of sorne soil anirnals in decomposing leaf litter. J. Anim. E col. , 44: 4 75-495. Baars, M.A. 1 979. Catches in pitfall traps in relation to mean den sitie s of carabid beetles. -Oecologia (Berl.), 4 1 : 25-46. Bigger, M. 1 976. Oscillations of tropical insect p opula tions. Nature, 259 : 207-209. Buskirk, R., & W. Buskirk. 1 97 6. Changes in arthropod abundance in a highland Costa Rican Forest. Amer. Midl. Nat., 95 : 288-298. Collins, N.M. 1 980. The distribution of soil macro fauna on the West Ridge of Gunung (Mount) Mulu, Sarawak, Oecologia (Berl.), 44: 26 3-275..
(8) 34. REVISTA DE BIOLOGIA TROPICAL. Davis, D.E. 1945. The annual cycle of plants, mosqui tos, birds and mammals in two Brazilian forests. Eco!' Monogr., 1 5 : 243-295.. Meijer, J . 1 974. A comparative study of the immigration of carabids (Coleoptera: Carabidae) into a new . polder. Oecologia (Ber!.), 1 6 : 1 8-208.. Denboer, P.J. 1 9 7 1 . Stabilization of ani¡nal numbers and the heterogeneity of the envhonment, p. 7 7-97. In Proc. Adv. Study Inst. Dynamics. Num. Popu!. (Oosterbeck 1 970). Wageningen: Pudoc.. Mitchell, B. 1 963. Ecology of two carabid beetles. 11. Studies on Populations of ádults in the field with special reference to the technique of pitfall trapping. J. Anim. Eco!. , 3 2 : 377-392.. Denlinger, D. 1 980. Seasonal and annual variation of insect abundance in the Nairobi National Park, Kenya. Biotropica, 1 2 : 1 00-106.. Montgomery, G., & Y. Lubin. 19 79. Abundance and diversity of arthropods in the canopy of a moist tropical foresto SmithsolÚan Contr. to Zoo!. (In Press).. Elton, C. 1 97 3 . The structure of invertebrate populations inside neotropical rain foresto 1. Anim. E col. , 42: 5 5-104 . Elton, C . 1 975. Conservation and the low population density of invertebrates inside neo tropical rain foresto Bio. Conservation, 7 : 3-1 5 . Hanlon, R., & J. Anderson. 19 72. The Effects of Collembola grazing on microbial activity in decomposing. leaf litter. Oecologia (Ber!.) , 39: 93-99. Holdridge,¡ L.R: 1 96 7. Life zone ecology. Tropical Science Center. San José, Costa Rica.. Janzen, D. 1 9 7 3 . Sweep samples of tropical foliage insects. Ecology, 54: 687-708. Lieberman, S. 1 982. The ecology of the leaf litter herpetofauna of a Neotropical rain forest: La Selva, Costa Rica. Ph.D. Díssertation. University of Southern California.. Stanton, N. 1 979. Piltterns of species diversity in temperate and tropical litter mites. Ecology, 60: 295-304. Strickland, A.H. 1 945. A survey of the arthropod soil and litter fauna of sorne forest reserves and cacao esta tes in Trinidad, British W. Indies. J. Anim. Eco!., 1 4 : 1-1 1 . Uetz, G.W. 1 979. The influence of variation in litter habitats on spider communities. Oecologia (Ber!.), 40: 29-42. Uetz, G.W., & J.D. Uilzicker. 1 976. Pitfall trapping in e cological studies of wandering spiders. J. Arachnology, A3: 101-1 1 1. Wolda, H. 1978. Fluctuations in abundance of tropical insects. Amer. Nat., 1 1 2 : 10 17-1045. Wolda, H. 1 979. Seasonal fluctuations in rainfall, food, and abundance of tropical insects. J. Anim. Eco!., 47: 369-382..
(9)
Figure
Documento similar
The purpose of the research project presented below is to analyze the financial management of a small municipality in the province of Teruel. The data under study has
The above analysis leads to an experimental scenario characterized by precise mea-.. Figure 4: The allowed region of Soffer determined from the experimental data at 4GeV 2 ,
For each unit of analysis we quantify both its percentage of forest cover (our habitat amount variable), and the proportion of this percentage occurring in the largest forest patch
In the preparation of this report, the Venice Commission has relied on the comments of its rapporteurs; its recently adopted Report on Respect for Democracy, Human Rights and the Rule
H I is the incident wave height, T z is the mean wave period, Ir is the Iribarren number or surf similarity parameter, h is the water depth at the toe of the structure, Ru is the
This means that a small number of observations drives the apparent decreasing pattern observed in Figure 4a and that the true pattern for the entire pool is random forest area
2) If the temperature (TCOLD) inside the greenhouse is cold , then it is therefore somewhat below the set temperature then the fuzzy controller sends a signal to automatically
One might expect that there is a smooth transition between a small sample regime, in which finite size effects such as those observed in sums of heavy-tailed random variables,
